
Standardized Crop Production Index
Standardized Crop Production Index (SCPI)
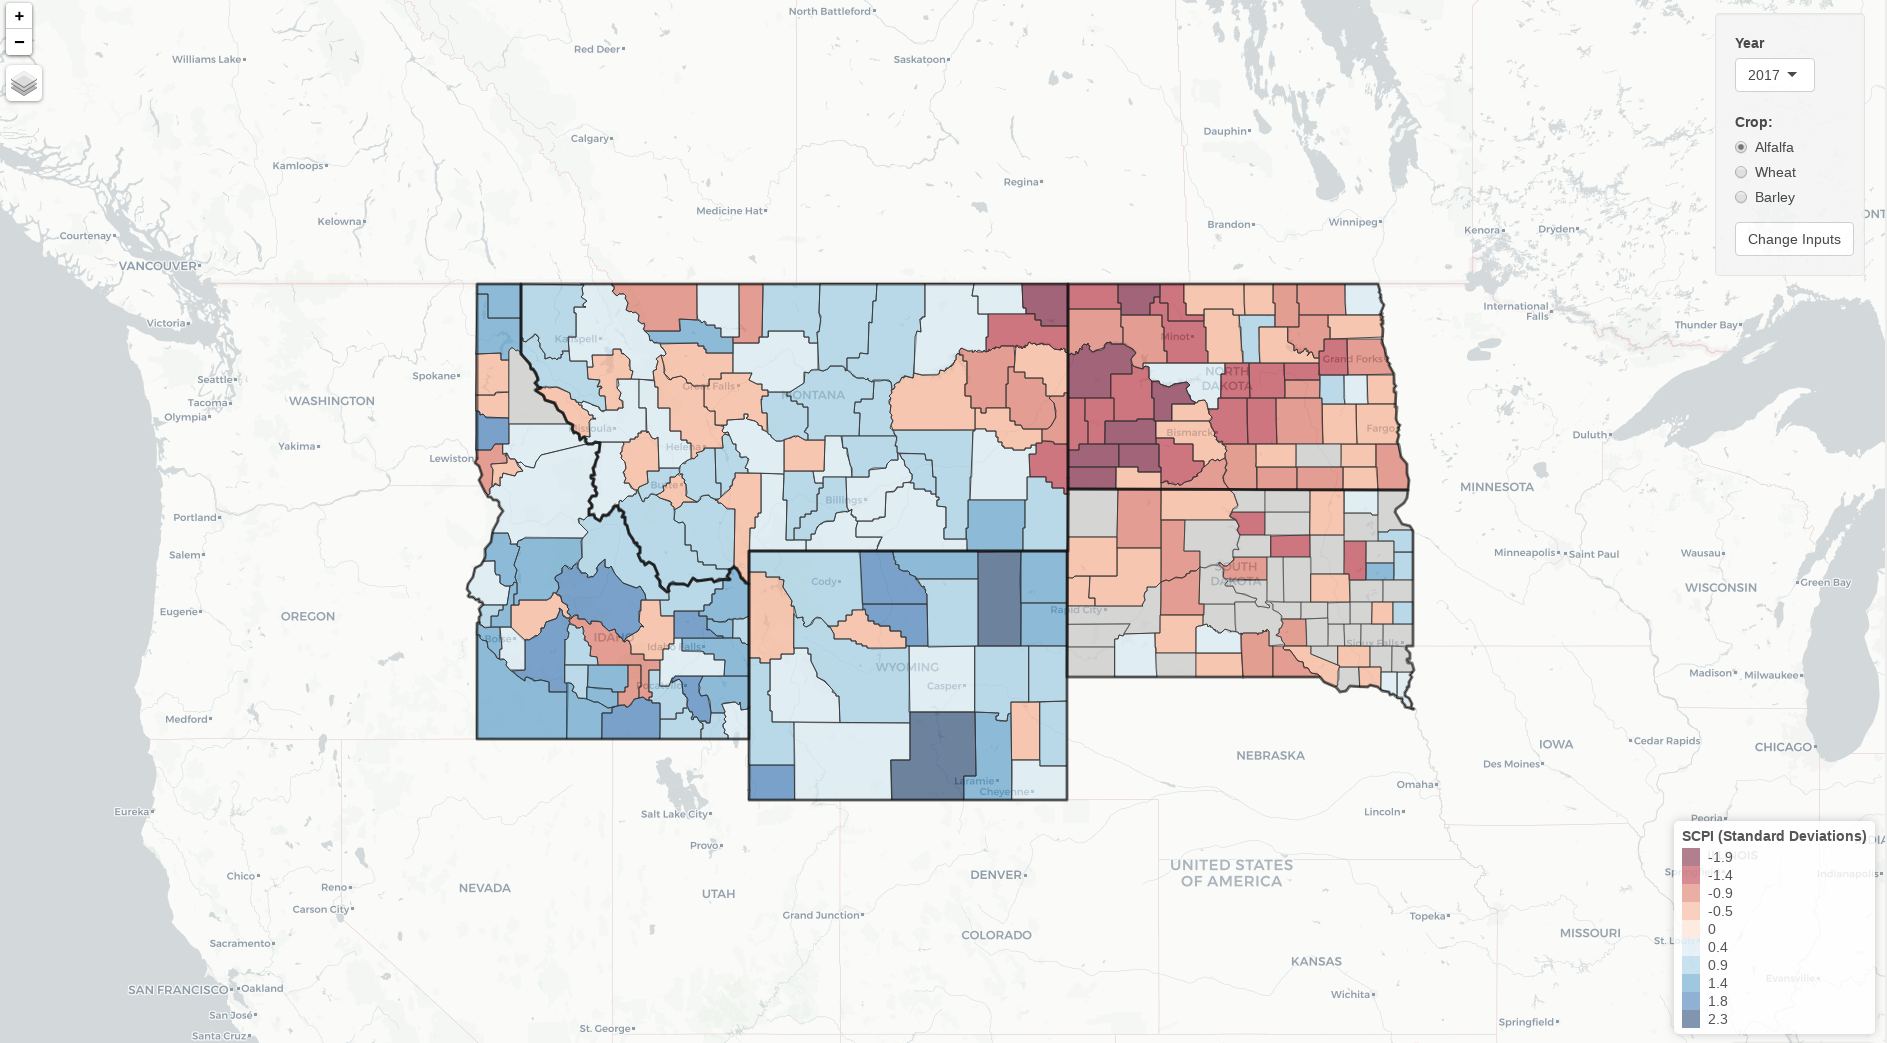
The Standardized Crop Production Index (SCPI) is a model that predicts future production anomalies of alfalfa, barley and wheat for counties in Idaho, Montana, North Dakota, South Dakota, and Wyoming. The model combines county-level precipitation data with state-level crop price data to predict the next year’s production anomaly of a crop. The image below shows the alfalfa SCPI for each county in 2017. The blue counties are counties where crop production is projected to be higher for 2018 than normal. The red counties are counties where crop production is projected to be lower for 2018 than normal. In Western Montana and the Western Dakotas, there is a notable spot of red counties. The low SCPI values of these counties can be happened in the attributed to the flash drought that happened in the summer of 2017. These low SCPI values suggest that crop production in Eastern Montana and the Dakotas is heavily reliant on rainfall.
The graph below shows a time series of the actual production anomaly (in blue) and the SCPI (in red) for Wibaux County, a county in Western Montana. While the model doesn’t perfectly match actual crop production anomalies, it comes very close and is almost an exact match in many years. In 2017 (the projection and actual anomalies for 2018), the year with a severe flash drought, the modeled SCPI is lower than normal. Even thought the model correctly predicted a lower than average alfalfa production, it missed the true anomaly by almost 1.5 standard deviations. This suggests that in years with extreme precipitation anomalies, the SCPI might correctly predict the direction of the anomaly but under/over predict the magnitude.
