
Mathematics and Big Data
The Department of Mathematical Sciences has developed an innovative, industry-centered program to train students in data science. Our focus, which is significantly different from other Universities that also have begun data science programs, is to focus on teaching data analytics and theory for real big data problems. Our goal is to produce graduates that have faced the challenges of big data with real problems and are ready to be productive employees. We want our graduates to be productive on the first day of the job.
We offer four course aimed directly at data science.
- Practical Big Data Analytics. A methods course taught in a lab format with a very heavy emphasis on programming (90% Python, 10% R) and big data algorithms such as Map/Reduce. Students program all of the algorithms they use so that they understand what’s going on.
- Theoretical Big Data Analytics. A theory course aimed at providing students with the knowledge and understanding necessary for innovation and creating new algorithms.
- Big Data Analytic Projects. Practical experience in solving real problems brought by technology companies. The next paragraph explains more.
- Numerical Methods for Computational & Data Science.
We have numerous other courses that are very valuable for students studying data science. These include, but are not limited to
- Introduction to Probability. A one-semester course on probability that does not assume any previous exposure to probability.
- Statistical Methods. A one-year course covering almost all of the statistics needed to be a successful data scientist.
- Mathematical Statistics. A one-year advanced course covering probability theory, estimation, and hypothesis testing.
- Applied Linear Regression. A intermediate-level course covering the methods of regression analysis.
- Statistical Learning. An intermediate-level course focusing on predictive analytics and artificial neural networks.
Are there any other reasons to come to Missoula and the University of Montana to study Data Science? Yes:
- Missoula is the best place in Montana for technology businesses, it’s one of 50 Google eCities, and it's ranked fifth in the country among cities with a population of less than 250,000 for its number of high-tech launches. Plus, the skiing, hiking, mountain biking, kayaking, floating, hunting, and fishing is great.
- The University offers a Certificate in Big Data Analytics.
- The Department of Mathematical Sciences offers a Masters' degree in Data Science. The number of graduate students is capped at 10 so that each student will receive an education tailored to their interests and abilities.
- The School of Business offers business-oriented data science courses and a Master degree in business analytics.
The Big Data Analytic Projects course
The Big Data Analytic Projects course is entirely about solving data science problems. Some recent projects have been:
- Development of a system for forecasting numbers of influenza cases by week and county for the State of Montana.
- Analysis of EEG data and identification of patients at risk for post-traumatic epilepsy.
- Identifying neighborhoods with large percentages individuals at risk for smoke-induced and related diseases.
- Estimate inter- and intra-company teleconference usage from incomplete log files.
The Big Data Projects class and the InterCall teleconferencing problem
This project involved an Advanced Technology Group client, InterCall. InterCall provides, among a number of services, a conference call service. InterCall aims to optimize resource allocation by strategically locating hubs, but the amount of teleconferencing traffic between user locations was imprecisely known. The objective of the project was to estimate call traffic load between user locations.
The difficulty in estimating traffic between locations arose because when a conference call takes place, only the host location is known; the locations of participants is usually unknown. There is no direct way of precisely determining location-to-location traffic load.
The Big Data Projects class team tasked with the problem consisted of Soya Bjorlie (math), Ben Campbell (math and computer science), and J.R. Reynolds (business management information systems and computer science).
Data
The data provided by InterCall consisted of teleconferencing logs. All identifying information was made indecipherable by hashing. The line below is a conference call log.
muNoV1388617588455172042270,ecdee5de15af6876cfab0801bb36f445,PSTN,Dial In,User Initiated,AIP,2014-01-01 18:14:23.025000,2014-01-0118:19:42.083000,421927,343,.1,4.1,4.2,4.1,90,89,91,91,G711Ulaw,ATT_8005,221,swn01gsx23,VoIP,PSTN-TO-IP,,,,,,None,False
Log files from 38 consecutive days were provided by InterCall. Approximately, the total volume of the data was 13 GB consisting of 7 million unique phone number IDs and 24,500 company IDs.
The team pursued two approaches both of which involved estimating the amount of traffic between hosts. Location-to-location traffic can be easily determined once this information is known.
First approach
This approach attempted to predict the the owners of participant phone numbers. The motivation for the approach was the assumption that most of the time, the plurality of conference calls involving a participant would be to the employer of the participant. Therefore, the predicted owner of a participant phone number was the company that owned the majority of the calls involving the participant ID.
An algorithm was implemented that examined all teleconferences that a each phone number participated in and determined the host company of each conference. A second algorithm predicted the phone number owner. A third algorithm determined the amount of traffic between each pair of companies.
The algorithms were programming in Java and implemented as a sequence of three Map/Reduce algorithms executing on a Hadoop platform.
Results
The table below shows a snapshot of the estimated resource utilization between of resource utilization by a few of the companies with the greatest amount of resource utilization (hours). Execution time was less than one hour.
| Company ID | Company ID | Resource Utilization (hours) |
| 32348 | 32348 | 491,759.8 |
| 32348 | 191821 | 150,263.0 |
| 355602 | 355602 | 2,341,980.0 |
| 355602 | 421927 | 22,868.9 |
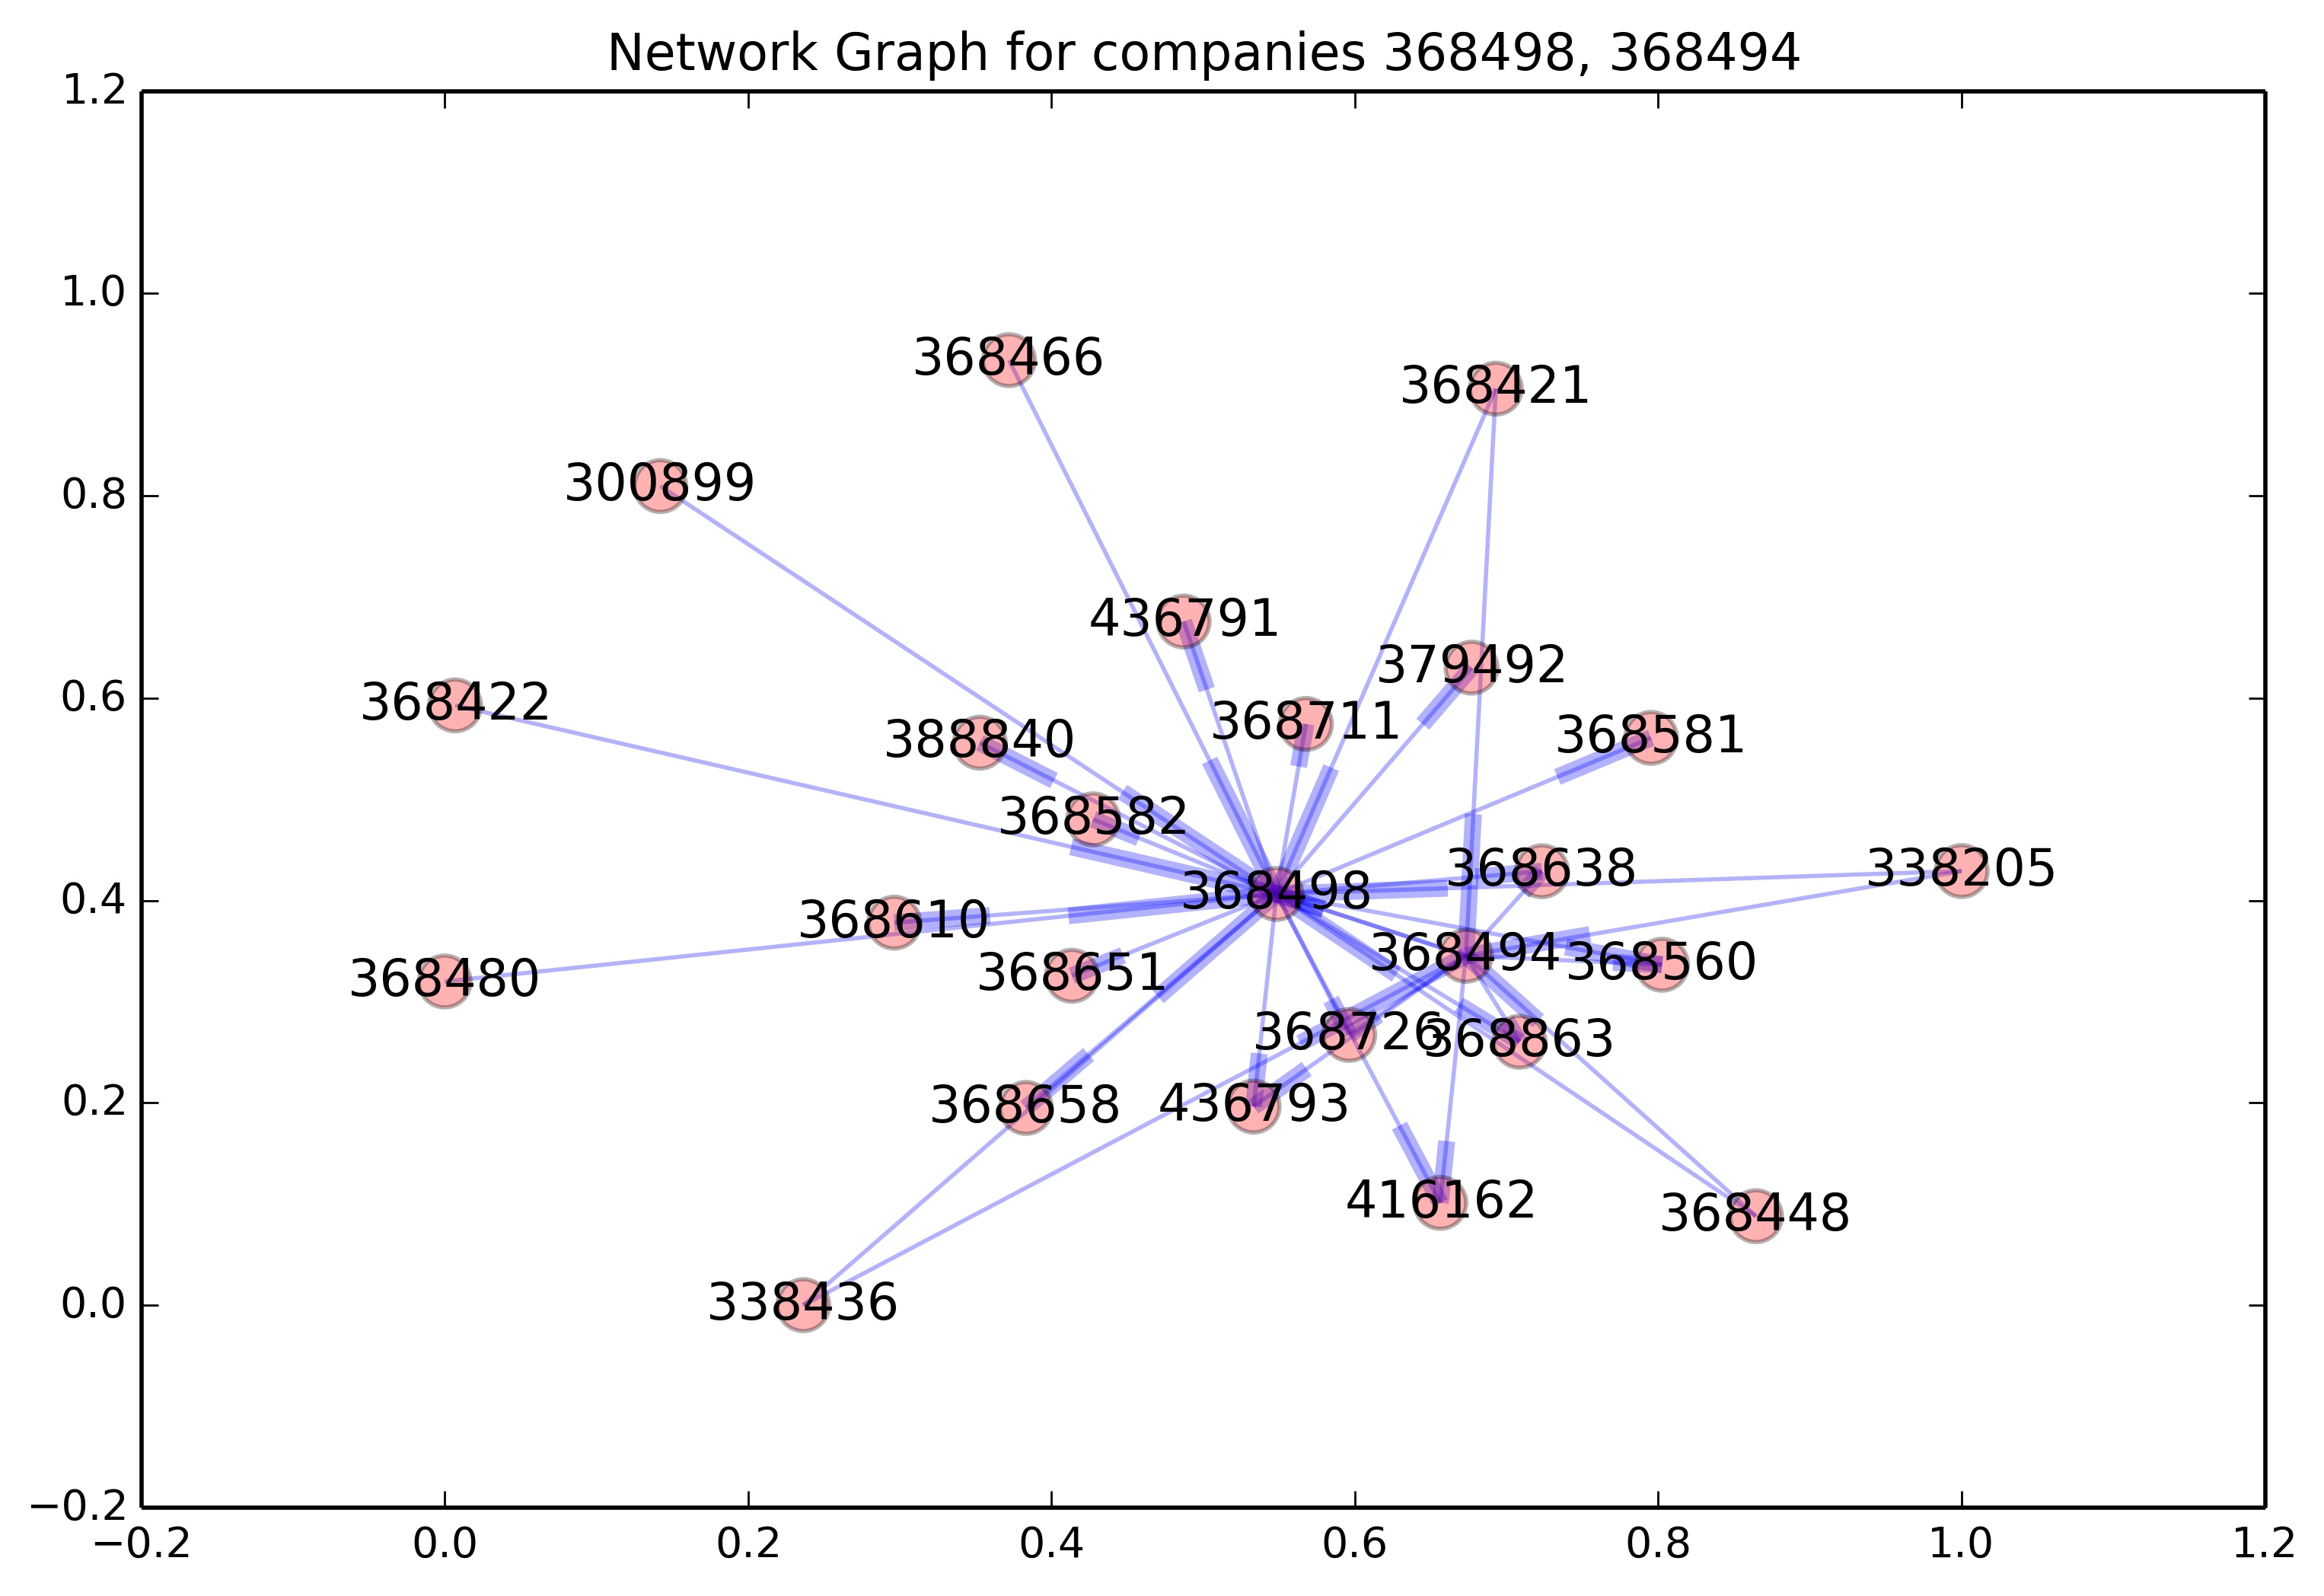
The second approach
The second approach aimed to estimate traffic between pairs of companies pairs according to fraction of participants that were involved in teleconferences to both companies relative the number of participants that were involved in teleconferences to either companies. This comparison leads to the Jaccard measure of similarity. The difficulty with the approach is that the number of possible company pairs was on the order of 300,000,000. Consequently, the approach is adapted to process only those companies with the largest numbers of calls.
The Figure isolates two companies and shows major company-to-company connections for each. These two companies are strongly connected to each other and a handful of other companies.
Practical Big Data Analytics class
The content of this course is the mathematics and algorithms of data science. Since programming is an essential skill needed of data scientists, students program every algorithm covered in the course. A laboratory format is used; we meet once a week for 3 hours. There’s often a short lecture at the beginning but about 75% of the class time is spent coding.
All data used in the class are real and available on the web. For example, we use election campaign contribution data available from the Federal Election Commission. Students were tasked with extracting information from these data. To illustrate, the Figure below, constructed by Jay Engenhoff, shows the donation totals for each of 29,770 zip codes from approximately 3.7 million contribution records collected during the 2011 and 2012 election cycle.
2012 Political Contribution by Zip Code
Figure 1. 2012 election cycle donation totals by zip code for the continental U.S. Data obtained from the Federal Election Commission.
The FEC data also provide an opportunity to reveal the political complexion of employees of major corporations. The Figure below shows the distribution of donations to Republican and Democratic parties for a few of the employers with the largest total employee donations. Asset management firms tend to donate to Republican candidates whereas technology and health sector companies favor Democratic candidates. Department of Defense and US Army employees tended to donate to Democratic candidates.
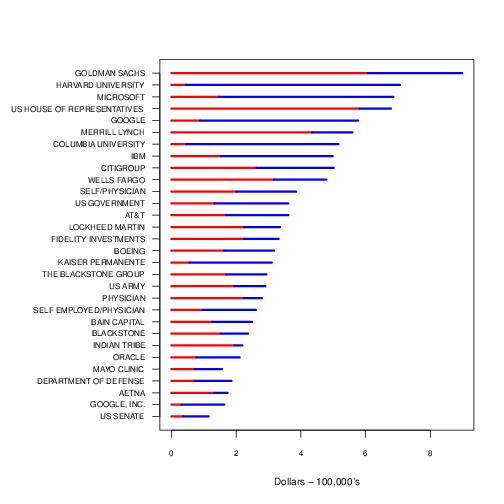
Figure 2. Donation totals for Republican and Democratic party candidates by employer for the 2012 election cycle. Data obtained from the Federal Election Commission.
What is a data scientist?
Slideshow for Peter Coffee's Big Data Goes to Work: Liberating Latent Value in a Connected World
You can learn more from the official Data Science Initiative webpage