One of our goals was to create a trauma screener that could be administered in 12 minutes or less. Data from 119 completed screening instruments show that 75 percent of the time EES administration took less than 10 minutes with delivery median of 7 minutes and a mean at 9 minutes. Most remaining screener deliveries took between 10 and 15 minutes. No EES administration took over 30 minutes.
The EES was designed to document the prevalence of trauma, victimization, and symptoms of PTSD and depression in Montana youth. Data illustrated below documents the prevalence of trauma and victimization in 128 Montana youth.

Figure summary: This figure shows the most common type of potentially traumatic experience reported by youth screened is bereavement, with 73 percent. The second most common potentially traumatic event is witnessed violence; 63 percent of youth report such an event. That number is followed by property victimization, at 50 percent, and child neglect or maltreatment, with 44 percent. Thirty-one percent of the sample reported experiencing peer and sibling victimization, 25 percent medical trauma, 24 percent cyber-victimization, and 13 percent sexual victimization.
The following figure displays the frequency of “expressions” found among youth surveyed. On the EES, young people are prompted to respond to one of the following options for each “Expressions” section question (as itemized on the left side of the chart below). For each question about the youth’s feelings, they are asked if they “never,” “one or two times,” “three to five times,” or “more than five times” experience the individual expressions within the past 30 days.
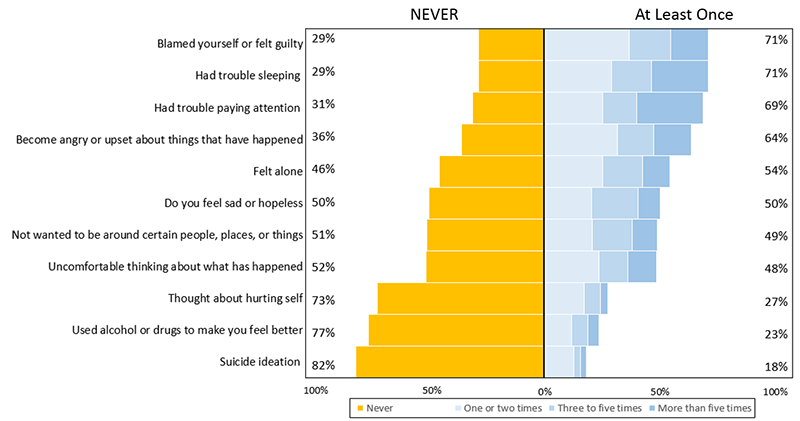
Figure summary: The two most commonly reported expressions among youth screened are self-blame and feeling guilty for things that have happened, which is reported through one EES question, and trouble sleeping or bad dreams, as indicated through answers to another question. Both expressions were reported by 71 percent of youth administered the screener. Sixty-nine percent of youth surveyed had trouble paying attention and 64 percent became angry or upset when thinking about things that have happened. About half of the youth said they felt alone or not close to the people around them (54 percent), felt sad or hopeless like things will not get better (50 percent), did not want to be around certain people, places or things (49 percent), and had uncomfortable feelings thinking about what has happened (48 percent). Twenty-seven percent thought about hurting themselves, 23 percent used alcohol or drugs to feel better, and 18 percent contemplated thinking about ending their life or killing themselves.
Total Experience and Expression section scores have a strong positive correlation (r =.613). Youth with higher Experiences section scores are likely to have higher Expression section scores. The following figures display this correlation by illustrating the average Expressions section score based on how many experiences a youth reported. Expressions section scores are also broken down into PTSD questions and depression questions and individual scaled variables of PTSD and depression are shown in the figure below as well.
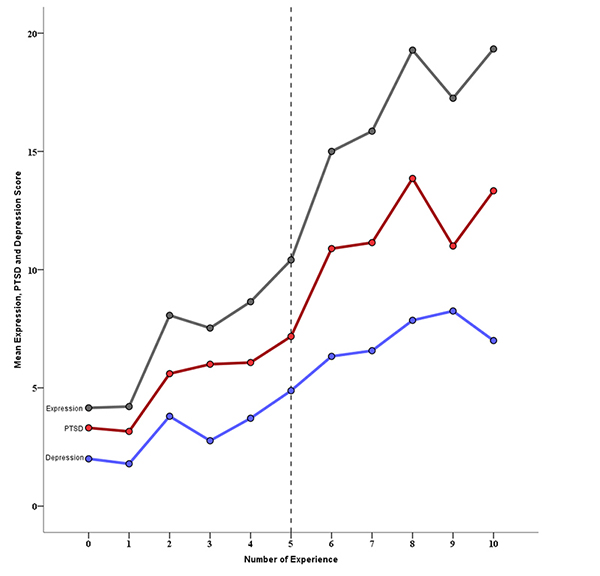
Figure summary: For all three variables (Expression, PTSD, and Depression scores), there is a strong positive correlation. The figure shows that the more traumatic events a child has experienced the more symptoms of PTSD and depression the child has experienced in the past month.
Once the EES has been completed, two scores are calculated to determine if the EES recommends the youth be referred to services. First, if the youth scores four or greater on the Experience section the EES will recommend a referral. Second, if the youth scores ten or greater on the Expressions section the EES will recommend a referral.
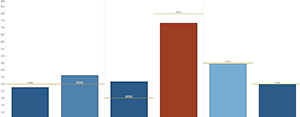
The figure below demonstrates how the EES predicts three severe symptoms of PTSD and Depression based on the two referral scores discussed above.

Figure summary: In the figure above, each cluster of bars represents the percent of youth who reported to using drugs or alcohol, thought about hurting self, and thought about suicide based on the number of recommended referrals from the EES scores. For the blue bars, both the Experience and Expression scores recommend zero referrals. The orange bars are for those youth that had one referral based on either the Experience or Expression score and the other score recommended no referral. Finally, the red bars are those youth who have two recommended referrals, one from the Experience score and one from the Expression score.
The figure above demonstrates a very clear pattern in regards to the EES scores and recommended referrals. Those youth who have no referrals have very low rates of using alcohol or drugs to feel better (2%), thoughts of hurting self (5%), and thoughts of suicide (3%). Those youth who have only one score that recommends referral have higher rates of these symptoms of PTSD and depression but are still relatively low. And finally, youth that have recommended referrals from both the Experience and Expression scores have significantly higher rates of using drugs or alcohol to feel better (39%), thoughts of hurting self (56%), and thoughts of suicide (40%). Overall, these findings demonstrate evidence that the EES is able locate youth who are clearly in need of services.