Grizzly Bears: Predicted Space Use & Connectivity Pathways in the US Northern Rockies
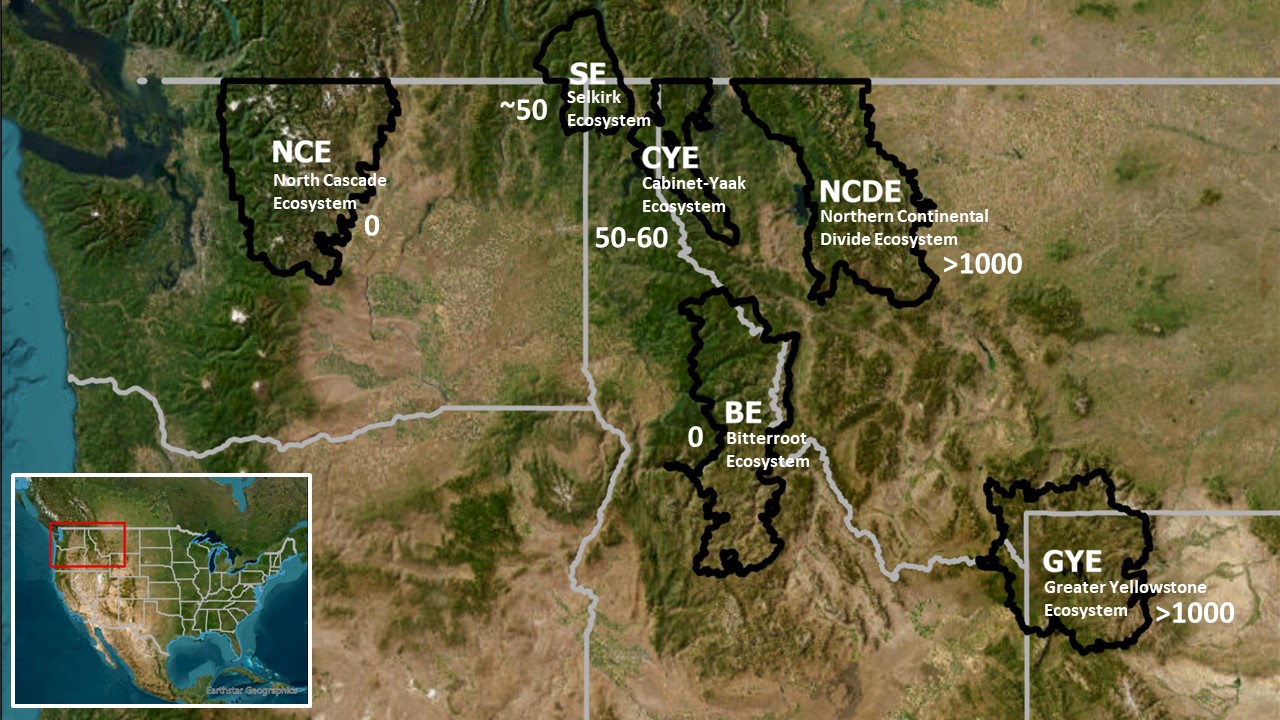
Grizzly bears were nearly extirpated across the western United States in recent centuries. Today, 4 populations are recovering thanks to the past 50 years of legal protections and intensive conservation efforts. Population estimates exceed 1000 bears each in the Northern Continental Divide Ecosystem (NCDE) and Greater Yellowstone Ecosystem (GYE). The Selkirk (SE) and Cabinet-Yaak (CYE) Ecosystems have 4-5 dozen bears each. To date, the Bitterroot (BE) and North Cascade (NCE) Ecosystems lack any known permanent residents.
Map: grizzly bear recovery ecosystems and approximate populations sizes.
Research can help inform recovery efforts. Connectivity between populations is a conservation goal, as is establishment of populations in currently unoccupied recovery areas. This requires a better understanding of habitat selection within existing populations and ability to predict connectivity pathways among ecosystems. Working in close collaboration with Montana Fish, Wildlife and Parks, we developed a multi-phase approach to study grizzly bear movement, habitat use, and population connectivity.
Process Diagram: our multi-phase approach to investigate grizzly bear habitat use and population connectivity.

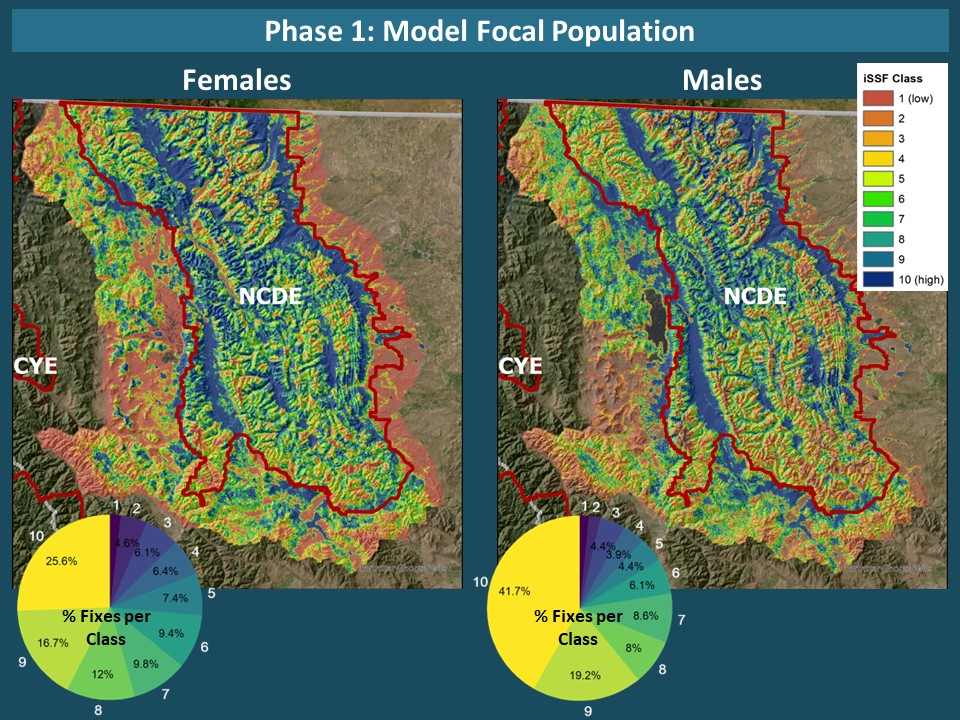
Phase 1: Model Focal Population
Using GPS collar data collected from 67 bears in the NCDE from 2003—2021, we developed integrated step selection functions (iSSFs) for each bear to model their movements. We then used these iSSFs to simulate habitat use within the NCDE.
Our simulation results predict habitat use in the NCDE. Below, maps depict predicted habitat use (iSSF class 1 = low relative predicted use, 10 = high). Each class is represented by 10% of the mapped area. The associated pie charts reveal our external validation of the habitat maps, based on >375,000 fixes for 262 grizzly bears wearing GPS collars, 2003—2021. Pie chart values are percentages of fixes in each iSSF class (1-10). More fixes in higher classes indicate the maps predict habitat use. For example, >25% of all female locations occur in just the blue mapped area (10% of the map), and the top 5 classes (6 – 10) contain >73% of all female locations.
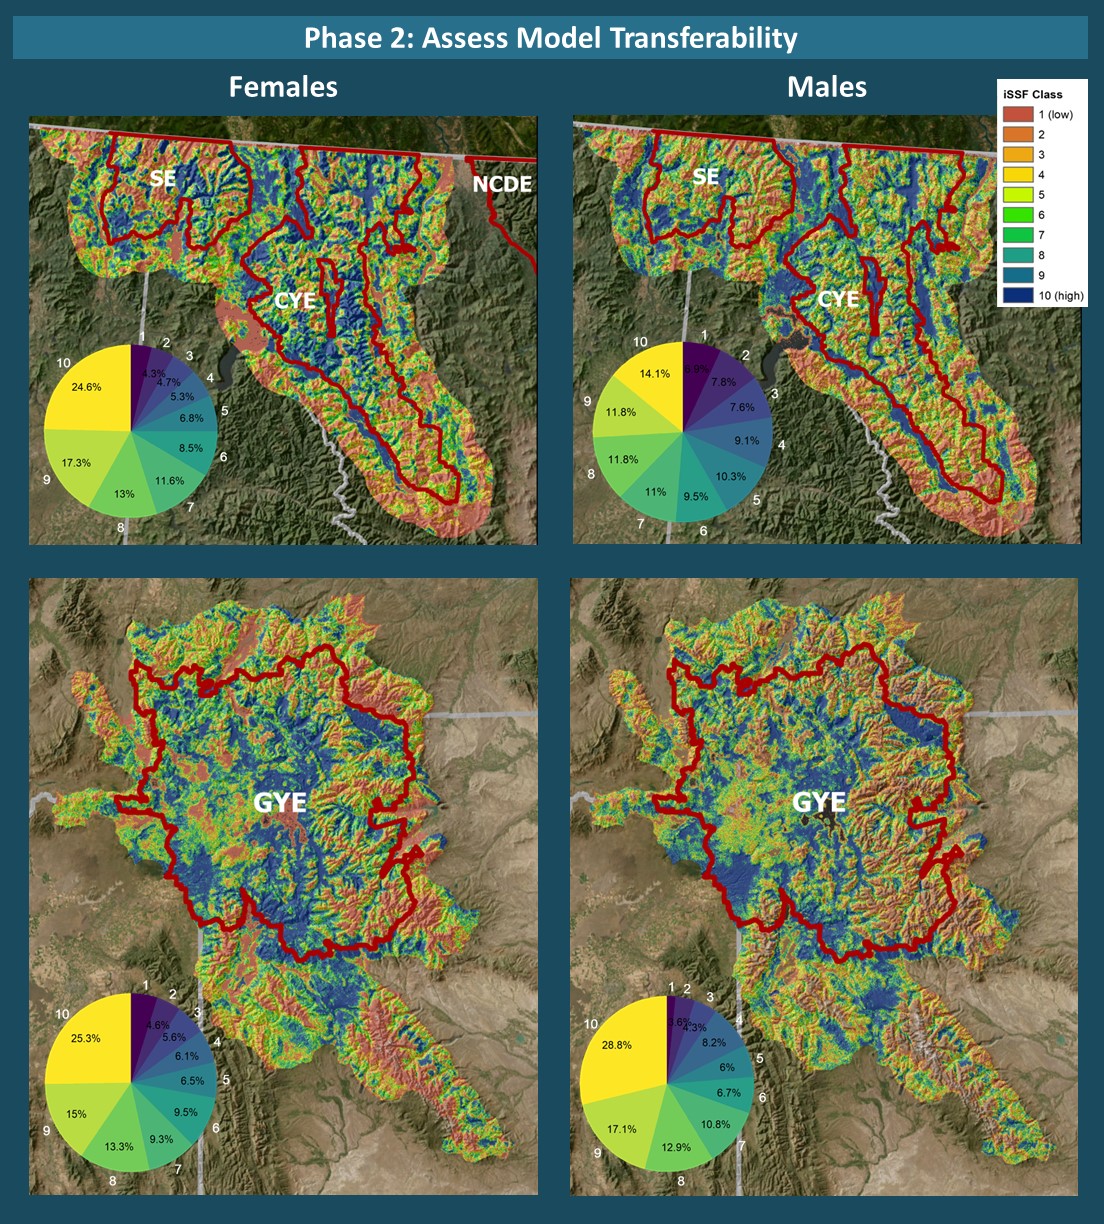
Phase 2: Assess Model Transferability
We next used our iSSFs from Phase 1 to simulate habitat use for the SE, CYE, and GYE. GPS collar data for bears in these populations demonstrate transferability.
The maps below depict predicted habitat use for SE/CYE & GYE grizzly bears. Similar to Phase 1, pie charts depict results of external validation of the habitat maps, based on >106,000 grizzly bear fixes for 72 individuals (SE/CYE) and >526,000 fixes for 166 individuals (GYE) wearing GPS collars, 2010—2021. Values are percentages of fixes in each iSSF class (1-10).
Phase 3: Simulate Connectivity Pathways
We next used our iSSFs to simulate connectivity pathways. Our directed simulations provided simulated bears with a start point and an end point in an adjacent population. In contrast, our undirected simulations provided simulated bears with only a start point (no predetermined end point). Known grizzly bear outliers aligned well with predicted connectivity pathways.
The maps below depict predicted connectivity pathways for grizzly bears. Predictions were based on directed movements (top row; simulations using start and end nodes between ecosystems) or undirected movements (bottom row; simulations using start nodes associated with the NCDE, CYE, and GYE). Verified grizzly bear outlier locations are shown as red stars.
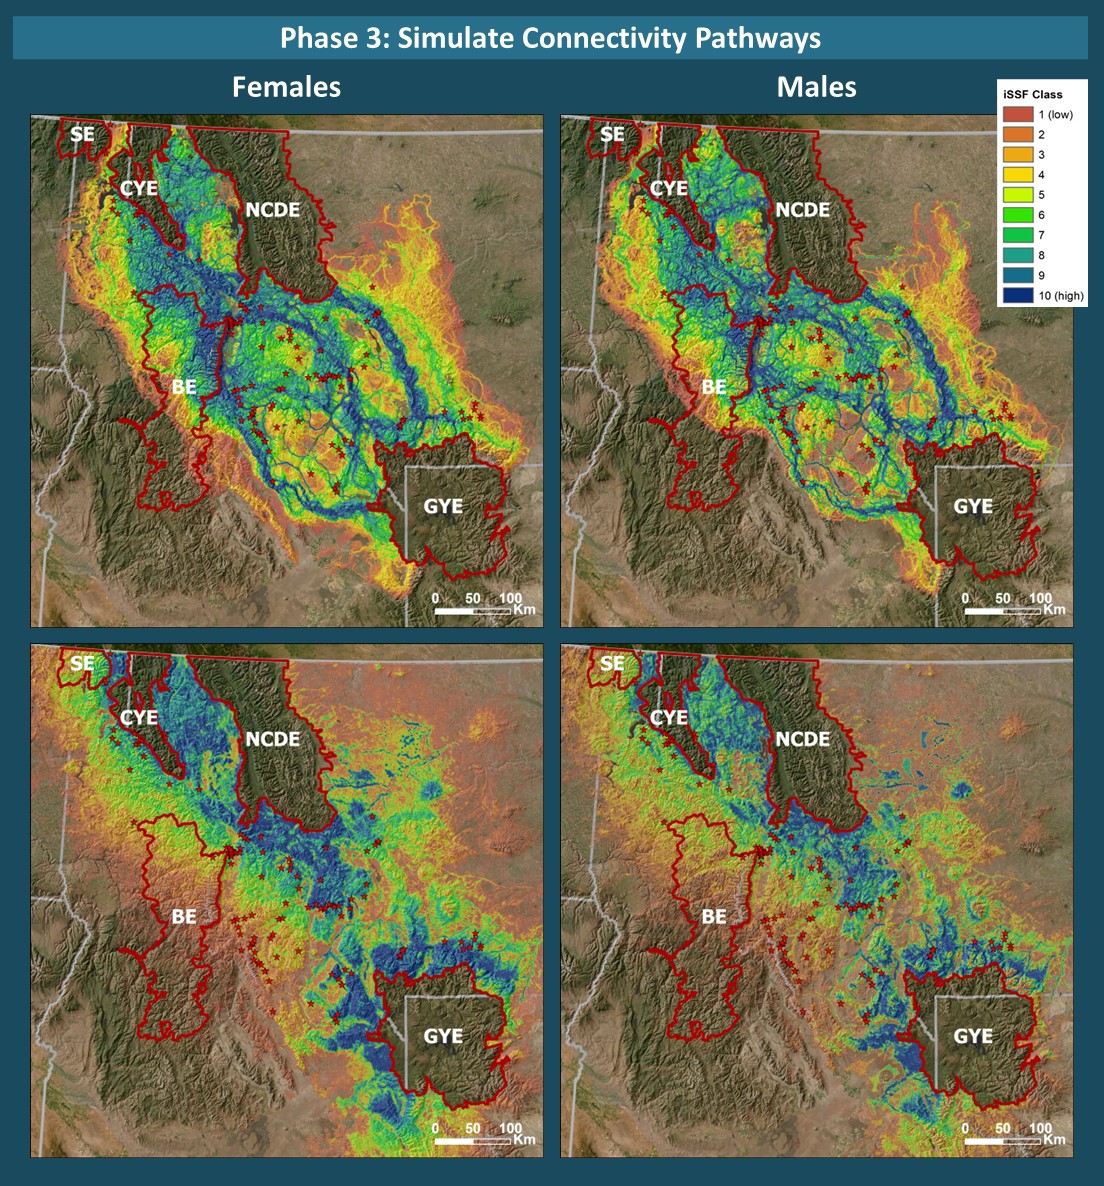
We also simulated undirected movements of bears from the eastern NCDE and northeastern GYE to predict space use and connectivity pathways in central Montana. Although not associated with a formal publication, these predictions and additional details are available in a data release on the United States Geological Survey website.

Phase 4: Predict for Future Populations
In Phase 4, we applied the models to the Bitterroot Ecosystem directly to predict habitat under natural recolonization and reintroduction scenarios. In the maps below, the top left panel shows predictions for natural recolonization (i.e., bears returning to the area from nearby populations in the SE, CYE, NCDE, and GYE), the top right panel shows predictions for reintroduction (i.e., bears released directly within BE North, BE Central, or BE South), and the bottom left panel shows the combined predictions if both reintroduction and recolonization occurr simultaneously. Analysis of locations of naturally recolonizing grizzly bears in this area align well with that map's predictions.
Alongside the connectivity maps from Phase 3, these maps can be used to plan conservation efforts to facilitate the return of grizzly bears to the BE.

Learn More
Phase 1: Sells et al. 2022. Grizzly bear habitat selection across the Northern Continental Divide Ecosystem. Biological Conservation
Phase 2: Sells et al. 2023. Grizzly bear movement models predict habitat use for nearby populations. Biological Conservation
Phase 3: Sells et al. 2023. Predicted connectivity pathways between grizzly bear ecosystems in Western Montana. Biological Conservation
Phase 4: Sells and Costello. 2024. Predicting future grizzly bear habitat use in the Bitterroot Ecosystem under recolonization and reintroduction scenarios. PLOS ONE.
Data available at United States Geological Survey website