
Earth's Response to Oceanic, Atmospheric, and Hydrologic Loading
Introduction
The oceans, atmosphere, and continental water are in constant motion. Gravitational forces from the moon and sun generate the ocean tides. Heat from the sun drives the Earth's water cycle and creates pressure gradients in the atmosphere. As water and air masses shift around on Earth's surface, the Earth experiences differences in surface pressure through time.
Since the Earth is not perfectly rigid, the Earth flexes and deforms under the weight of the surface masses. Earth's surface is depressed downward under the weight of heavy surface masses (e.g. during high tide), and Earth's surface rebounds back upward when the masses are unloaded (e.g. during low tide). The amount of Earth deformation caused by surface mass loading depends on the material properties of Earth's interior. A rigid object deforms less than a more flexible object when subjected to the same stress conditions. Consider, for example, pressing your thumb into a bowling ball and then into a foam ball with the same amount of force. Clearly, you will be able to make a deeper impression in the foam ball than in the bowling ball. The same general principle applies to the Earth: the structure of the interior of the Earth governs the amount of deformation.
Mission and Goals
The Global Positioning System (GPS) provides precise monitoring of changes in the shape of Earth's surface. Motions of Earth's fluid envelopes, including the oceans and atmosphere, generate displacements of Earth's surface on the order of millimeters to centimeters, which may be measured using GPS. Many regions of the world, including the United States, now support dense arrays of GPS receivers that continuously observe surface displacements. We use GPS data to explore how the shape of the Earth changes through time due to surface mass loading and tectonic processes.
We have three main goals:
- To assess the distribution and evolution of water and air across Earth's surface,
- To better constrain the material properties of Earth's interior using geodesy, and
- To improve the analysis of tectonic deformation in GPS time series by effectively accounting for the contributions of surface mass loading to the time series.
Modeling and Data Analysis
We develop computational models (LoadDef, Martens et al. 2016) to quantify the deformation response of the solid Earth to external forcing from the oceans, atmosphere, and continental hydrology. The models are informed by empirical observations from ground- and space-based instruments, including the NASA GRACE satellites, global tide gauges, and meteorological stations. The load models are convolved with displacement load Green's functions, computed internally within LoadDef, to generate predicted load-induced surface displacements at a particular location.
We evaluate the Earth-deformation models in the context of empirical data, including from the UNAVCO Plate Boundary Observatory (PBO) GPS stations in the western US and Alaska. We process some of the GPS data in-house for non-standard, high-rate applications.
LoadDef Software
The LoadDef software suite provides end-to-end modeling of Earth deformation caused by surface mass loading. From an input model for radially heterogeneous, elastic Earth structure, LoadDef computes Love numbers and load Green's functions. The load Green's functions may then be convolved with local- to global-scale load models to compute the predicted surface displacement at any geographic location. The software is written in Python and MPI compatible. If you are interested in using the LoadDef software suite for academic research or teaching purposes, please navigate to the "Software" tab. Feel free to reach out to me with questions or feedback. My contact information may be found below.
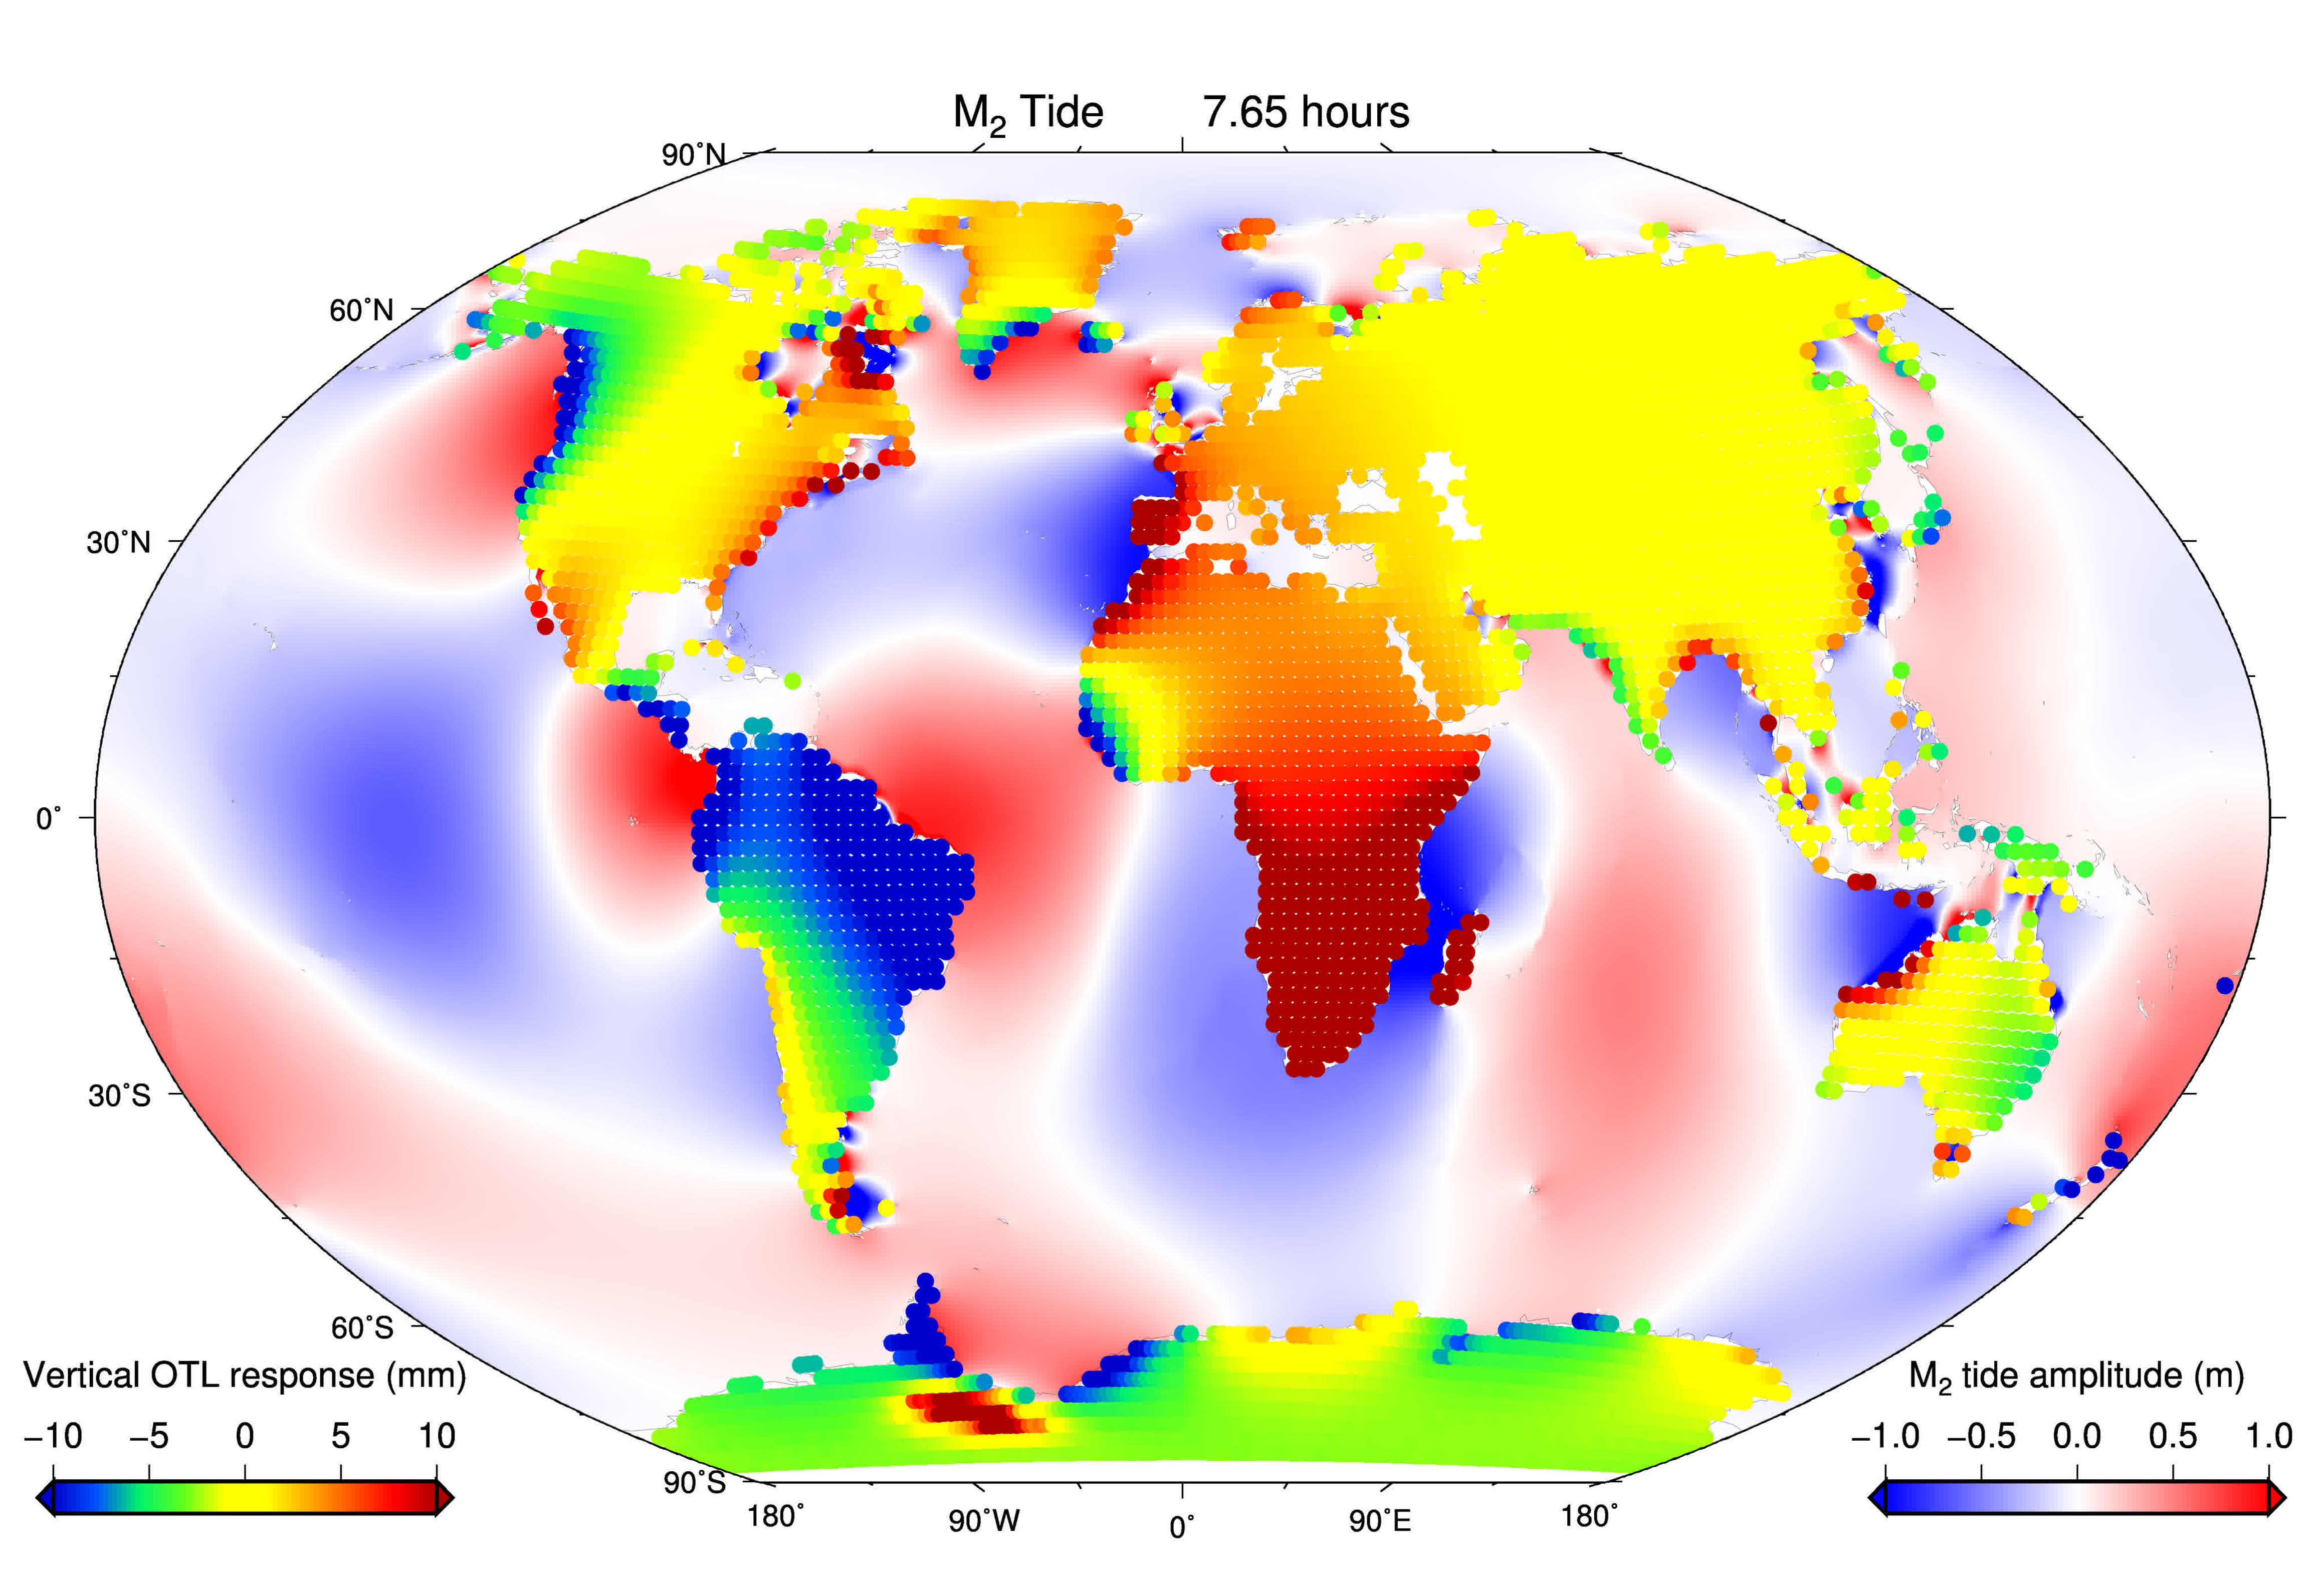
Modeled response of the solid Earth to ocean tidal loading of the M2 harmonic. The M2 tide model (FES2014) is shown in the oceans, and the vertical displacement of Earth's surface due to the loading is shown over the continents. A high tide offshore causes the ground to be depressed downward. A low tide offshore allows the ground to rebound back upward. The M2 ocean tide ranges in amplitude up to about 1 meter, though can be up to severalfold larger in some localized regions. The displacement response ranges in amplitude up to about 4-5 cm, which is readily measured by modern scientific-grade GPS stations. Here, we have assumed the structural properties of the Preliminary Reference Earth Model (Dziewonski and Anderson, 1981).
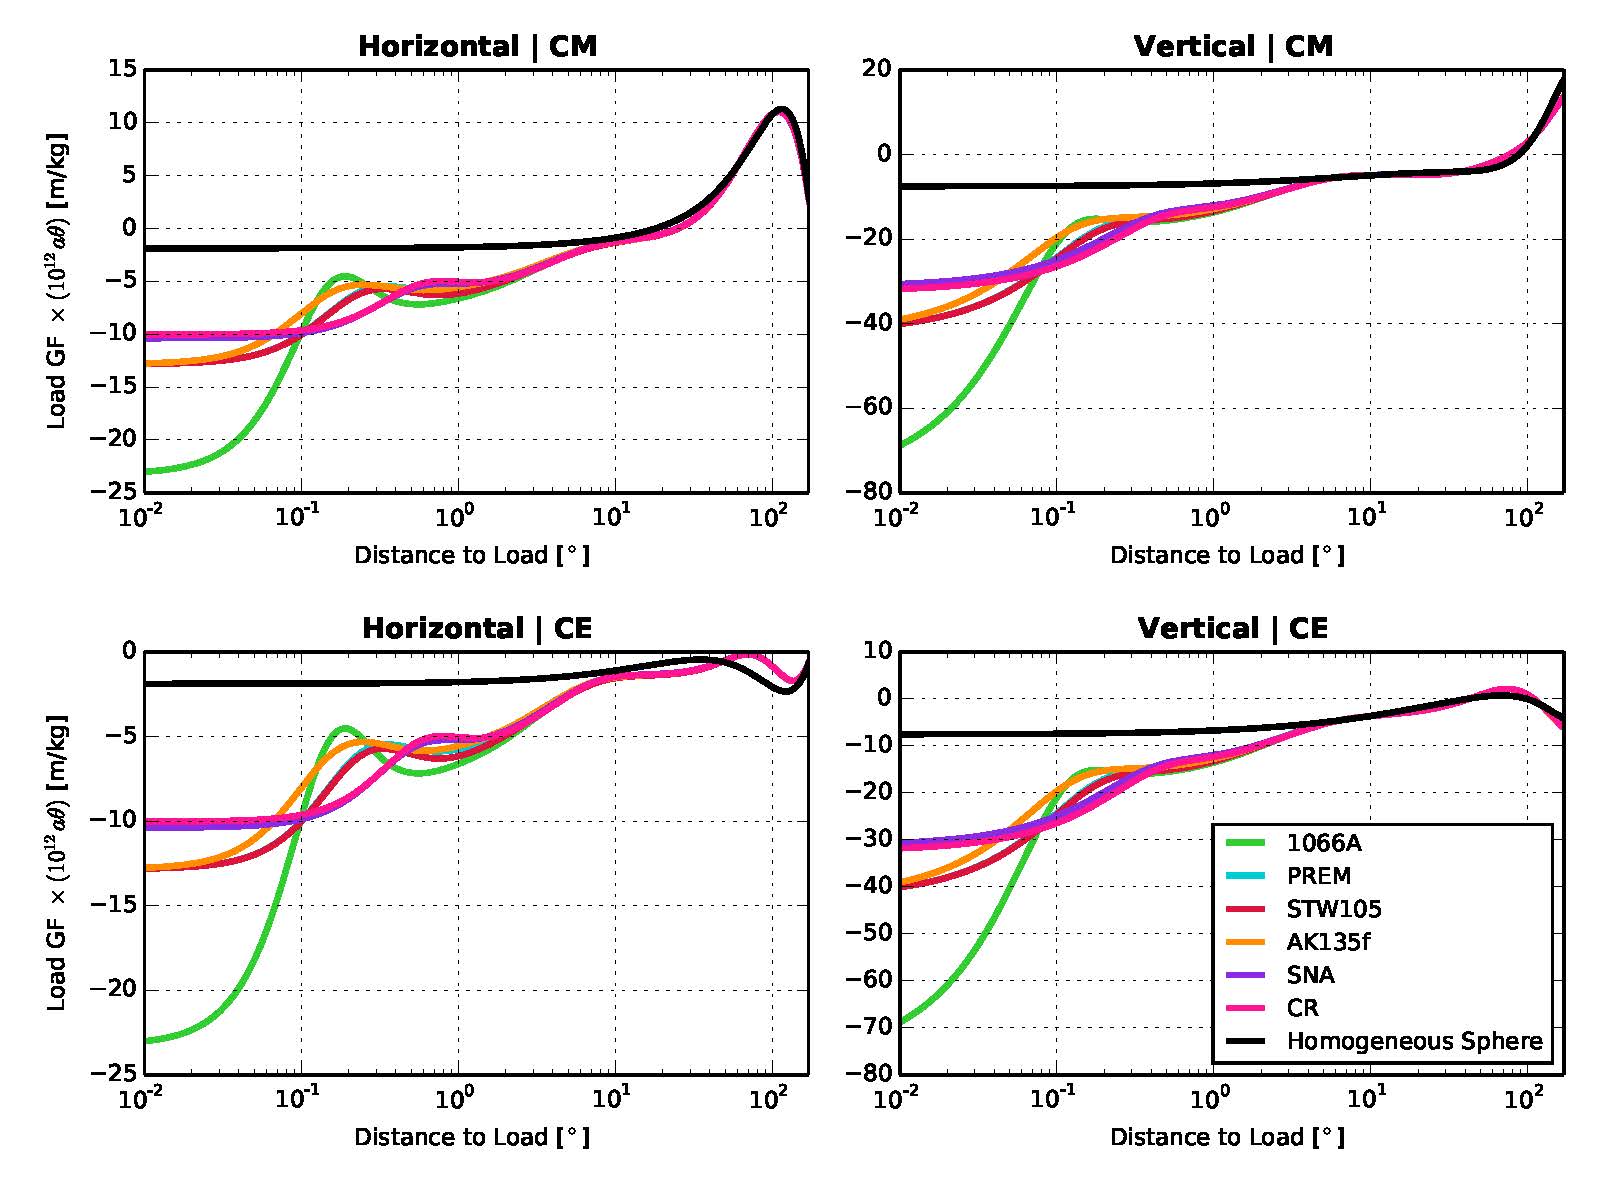
The shape of the Earth changes, or deforms, when subjected to external forces. The amount of deformation depends on the material properties of Earth's interior. Since modern GPS observations can reveal precisely how the shape of the Earth is changing through time, we can use the GPS observations in combination with computational models to constrain the material properties of Earth's interior. The figure above shows displacement load Green's functions that characterize how the Earth deforms when loaded by a mass of 1 kg at a point. The x-axis shows distance from the point load, and the y-axis shows the amount of displacement in meters per the 1 kg of load. Horizontal displacements are shown in the left panels; vertical displacements are shown in the right panels. CM (top panels) represents a center-of-mass reference frame; CE (bottom panels) represents a solid-Earth-centered reference frame. The colored lines depict displacement load Green's functions generated for a variety of standard Earth models. The Green's functions were computed in-house using our software suite LoadDef. If you are interested in using LoadDef for your academic research or teaching, please see our "Software" page for more information and contact us directly.
Intraplate Earthquakes in Montana
Introduction
Nearly 10% of global earthquakes rupture within the interior regions of tectonic plates, far from the sharply defined and markedly deforming tectonic-plate margins. Intraplate earthquakes reflect a sudden release of accumulated strain energy far from a plate boundary, and reveal important information about the sources and transfer of stress within the continents.
The closest tectonic-plate boundary to Montana lies just off the coast of Washington State, approximately 500 miles away, at the Cascadia subduction zone. Yet, western Montana and the extended Rocky Mountain region are actively deforming and generate thousands of earthquakes every year. If Montana and the Rocky Mountains are so far away from a tectonic-plate boundary, what mechanisms are driving and facilitating the abundant and ongoing earthquakes? At the University of Montana Department of Geosciences, we are working to help answer this question.
On 6 July 2017, Montana experienced its largest earthquake in over half a century. The magnitude 5.8 event struck near the small town of Lincoln, and could be felt all the way into Canada and neighboring states. The large earthquake has generated thousands of aftershocks that are likely to persist for several years. At the University of Montana, we are studying the aftershocks from the Lincoln earthquake to investigate the stress conditions that generated the main shock, to evaluate crustal structure and material properties within western Montana, and to more broadly explore the physical mechanisms that concentrate and release stress within intraplate settings.
Mission and Goals
One of the fundamental questions in solid-Earth geophysics pertains to how strain accumulates within continental interiors and, by extension, what forces drive seismic activity at large distances from tectonic-plate boundaries. Seismic and geodetic observations, computational models, and laboratory experiments suggest that the answer depends on a combination of many complex and coupled physical processes and properties relevant to the solid Earth, including tectonic stress transfer, mantle dynamics, lithospheric structure and rheology, gravitational potential energy, and heat flow. The relative importance of each factor can vary by region, since driving forces and Earth structure are laterally heterogeneous.
At the University of Montana, we aim to evaluate the distribution, concentration, and evolution of stress within the interior of the western US by performing targeted assessments of the abundant, deep, and powerful intraplate seismicity currently occurring naturally within western Montana and the extended Rocky Mountain region. Our overarching objectives are two-fold:
- To improve constraints on the dynamics of intraplate deformation and earthquake localization within a narrow seismic belt, called the Intermountain Seismic Belt, that stretches through western Montana, and
- To advance our understanding of how strain accumulates and dissipates within continental interiors.
University of Montana Seismic Network
We are in the process of building a seismic network for western Montana. In summer 2017, we deployed three broadband seismic stations tightly around the Lincoln aftershock sequence to supplement coverage from existing regional and national networks. In August 2018, we will be deploying seven additional broadband seismic stations around Lincoln and the nearby Swan Valley, which has hosted deep and persistent swarms of earthquakes for several years. The ten University of Montana stations will complement the Montana Regional Seismic Network (Montana Bureau of Mines and Geology), supplementing coverage of the earthquake focal sphere, particularly along the eastern front of the Rocky Mountains. The University of Montana seismic stations are designed for direct-bury applications, and may be ported to different locations over time with relative ease.
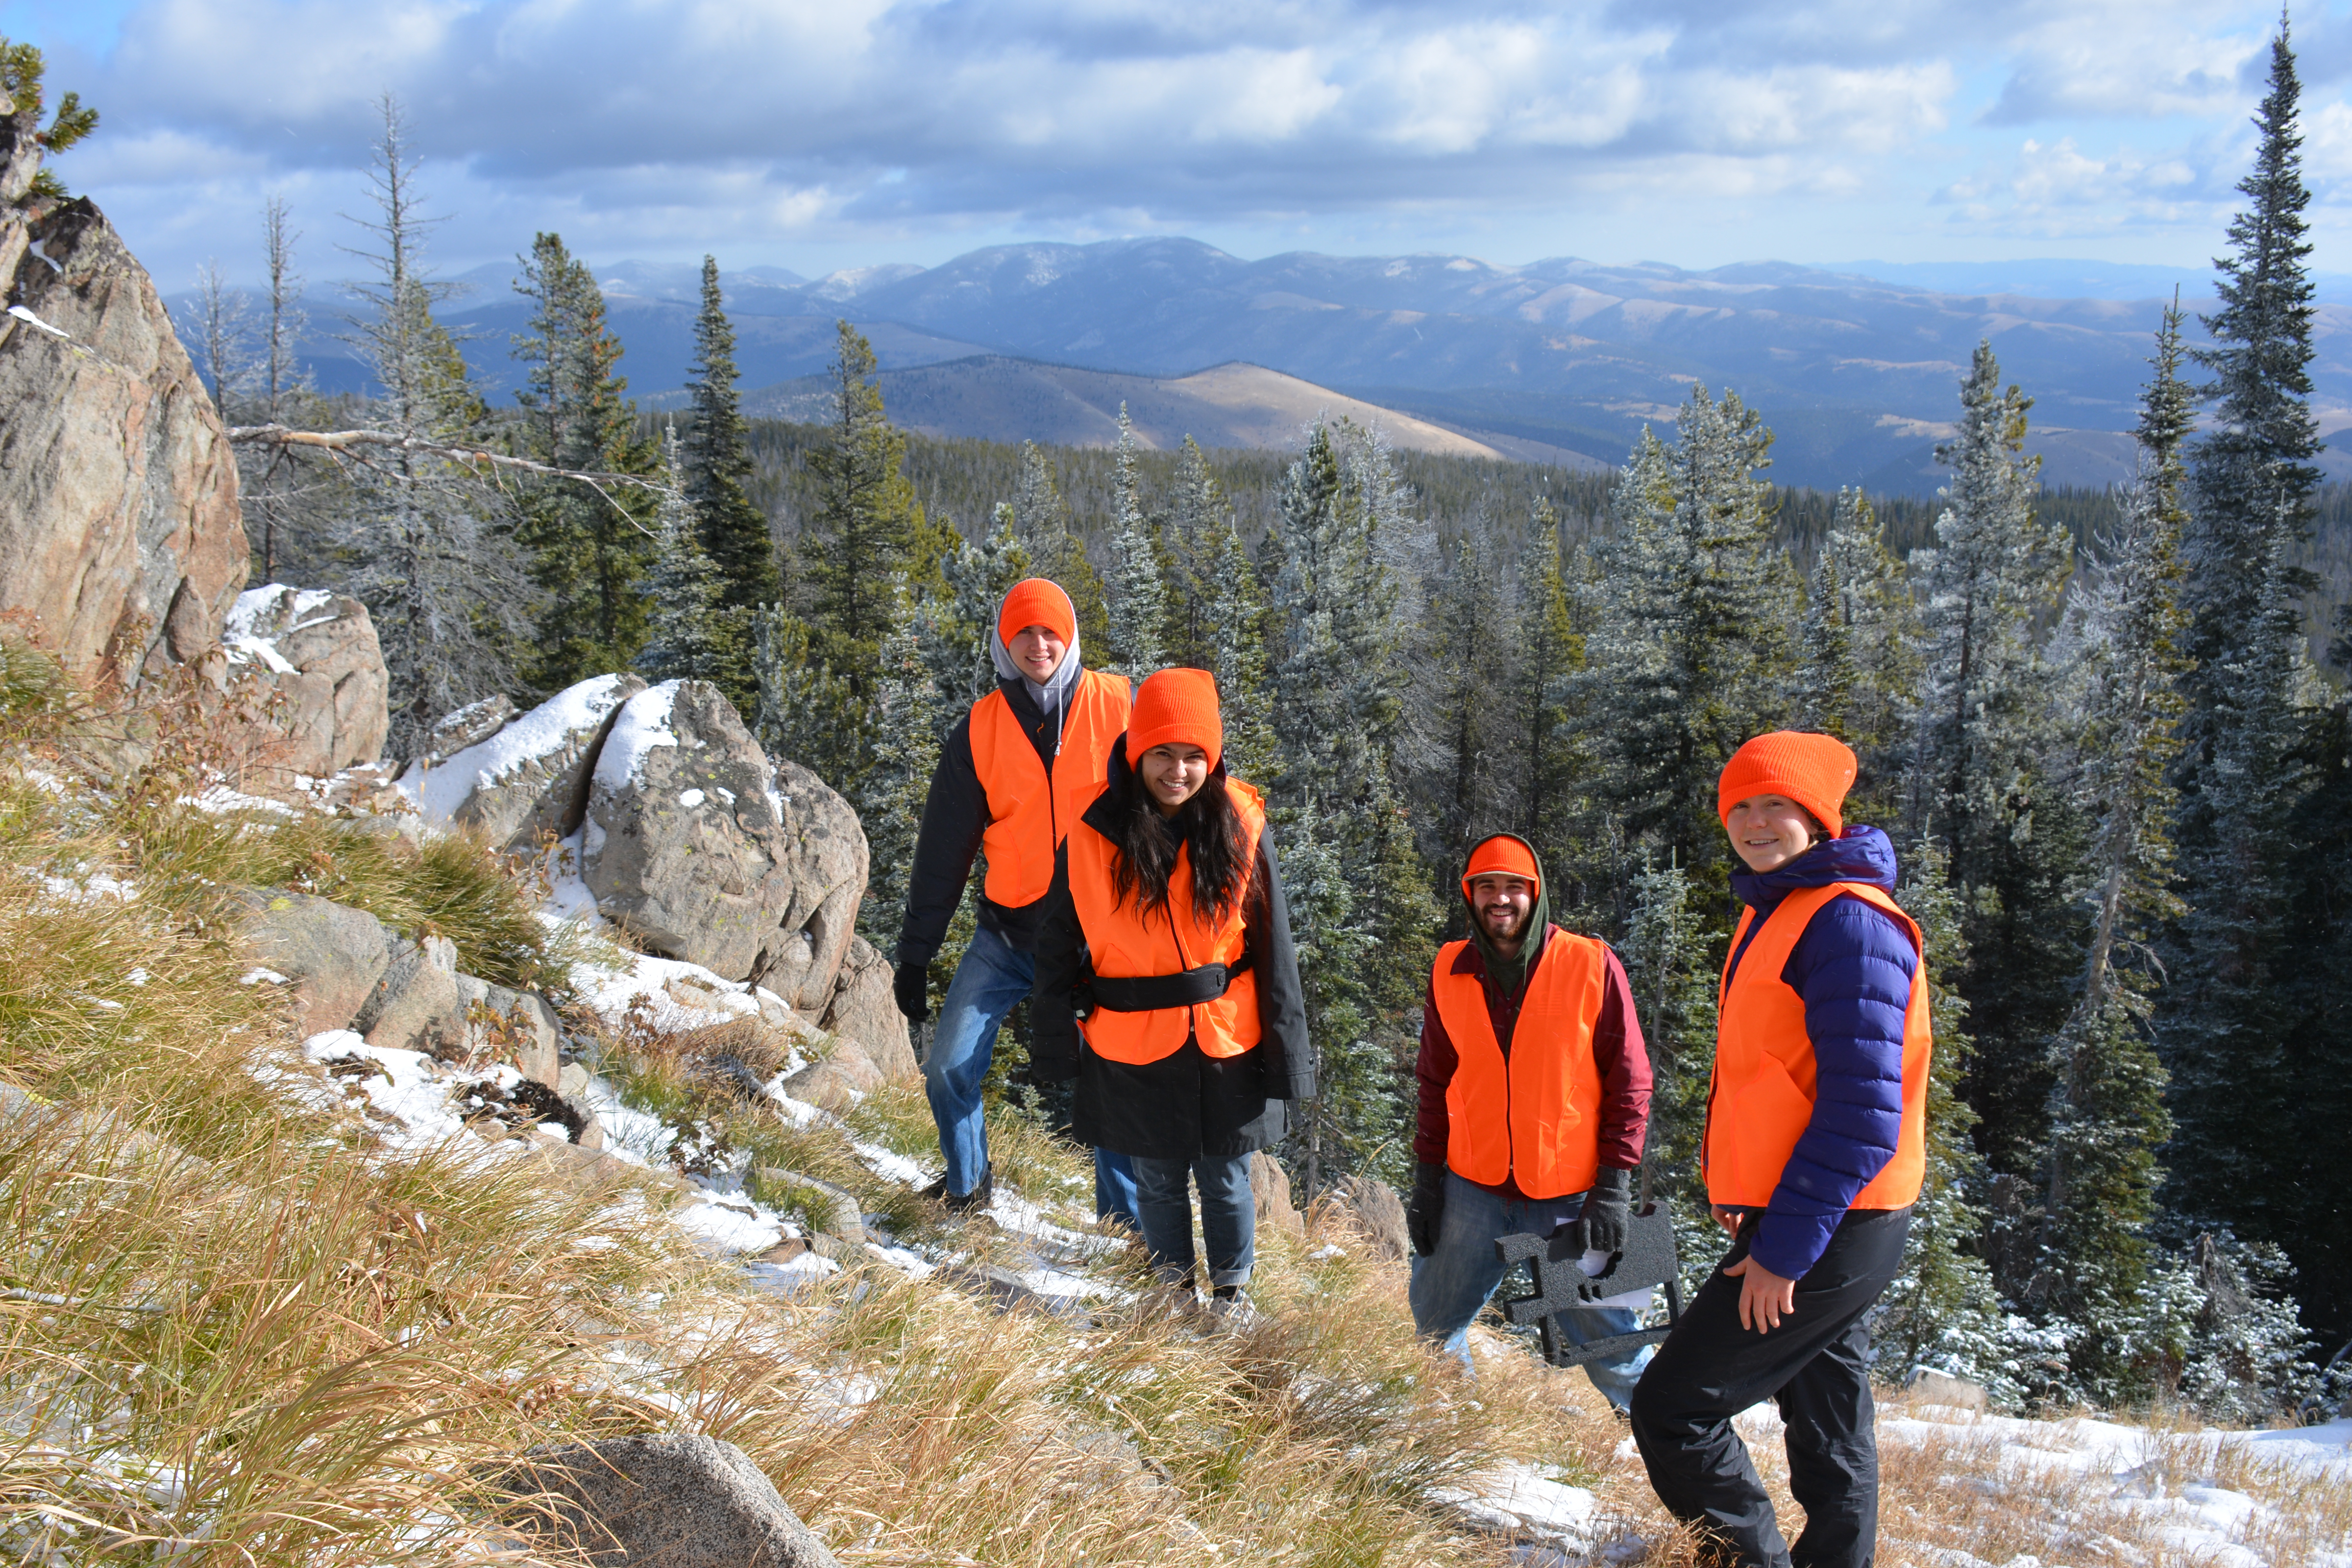
University of Montana students visit a broadband seismic at Granite Butte near Lincoln, Montana, in October 2017. The broadband seismic station is part of the new University of Montana Seismic Network, and has recorded thousands of aftershocks from the M5.8 Lincoln earthquake in July 2017.
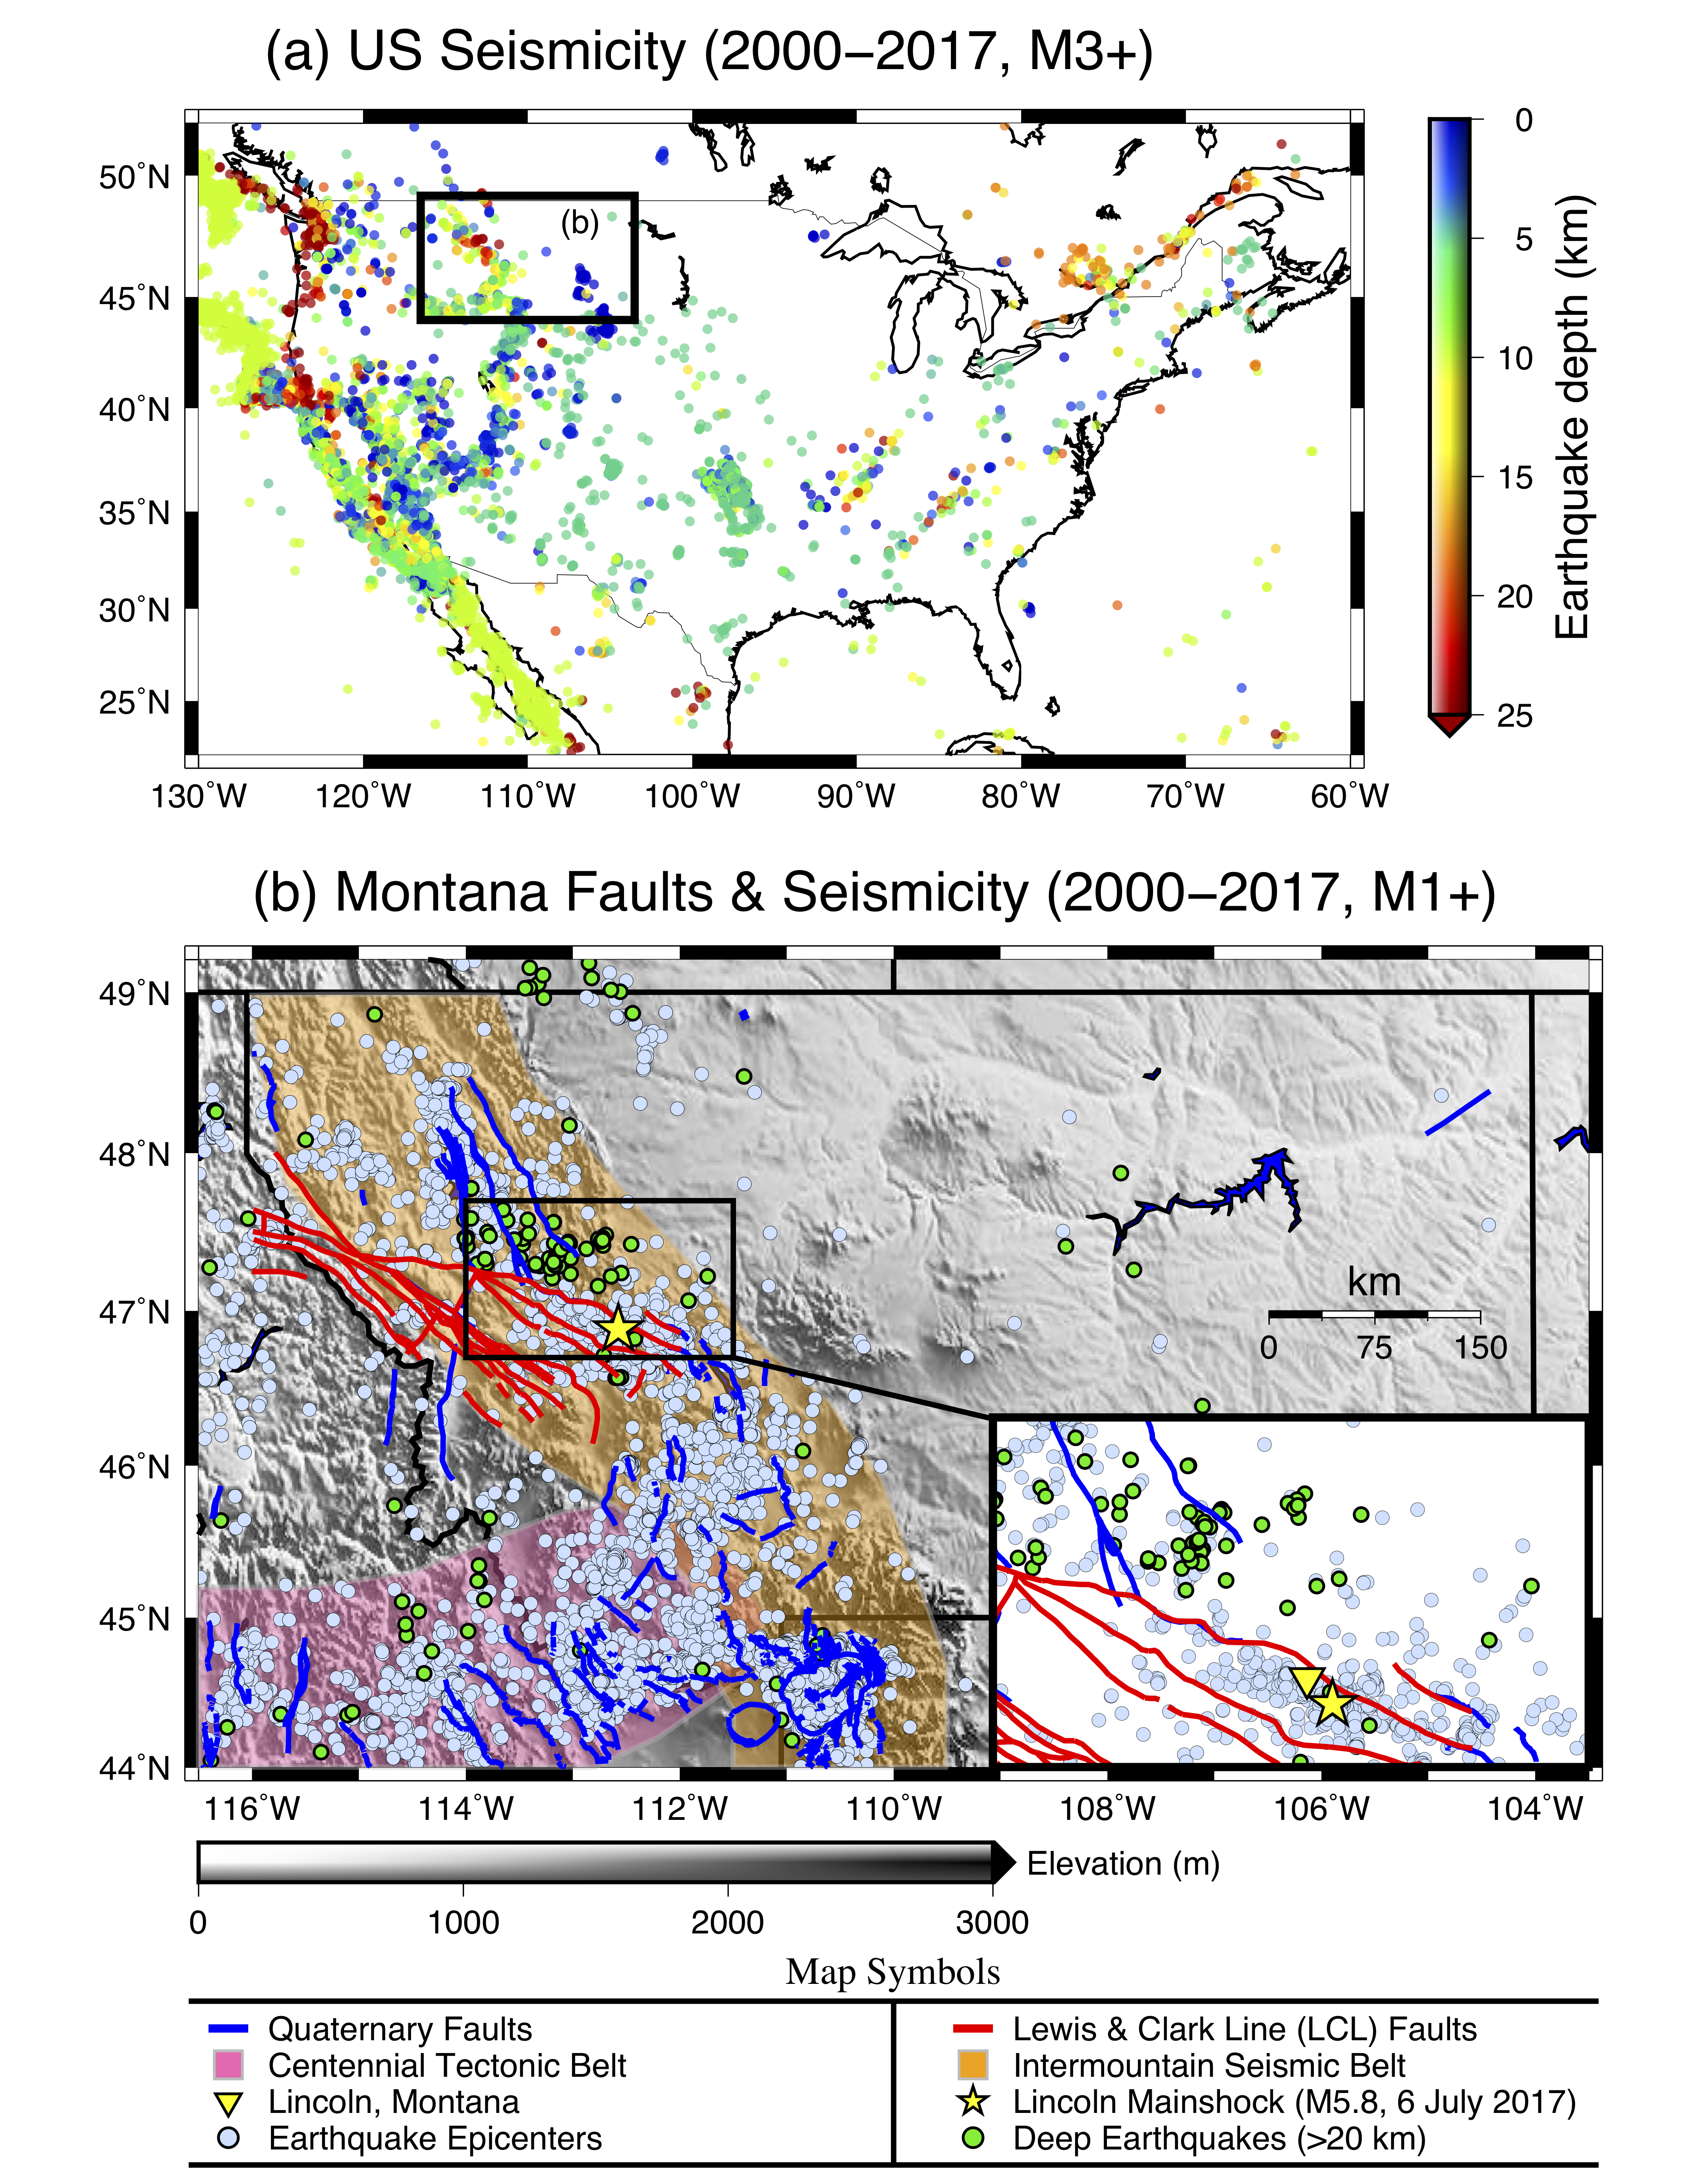
(a) Earthquakes that occurred within the contiguous United States and bordering regions from 2000-2017 with magnitudes of 3.0 or greater (USGS catalog). The colorbar depicts earthquake depths. The black box outlines the US state of Montana and bordering regions, featured in Panel b. (b) Earthquakes that occurred within and around the state of Montana from 2000-2017 with magnitudes of 1.0 or greater (gray circles). Deep events (> 20 km) are highlighted in green. Quaternary faults (blue lines) are from the USGS Quaternary Fault and Fold Database. Lewis and Clark Line faults (red lines) are from Wallace et al. (1990). The epicenter of the 2017 M5.8 Lincoln mainshock is denoted by a yellow star. Two distinct seismic belts are shown as shaded regions: the Intermountain Seismic Belt (orange) and the Centennial Tectonic Belt (pink).