Specialty Maps
Specialty maps are topic-specific and are produced to explore specific topics and share information. These include maps to inform emergency preparedness activities and better understand the impacts of COVID on rural people with disabilities.
Explore the maps in the accordion drop-downs below. Select each map image for a larger, downloadable version.
Funding
-
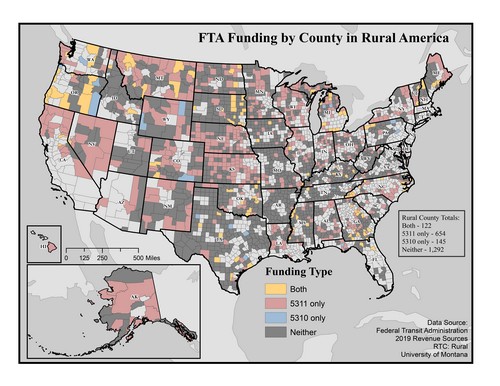
This map of the United States shows which rural counties receive FTA funding, as well as which type of FTA funding they receive.
Of the 2,213 counties
represented, 654 receive only 5311 funding, while
145 receive only 5310 funding. A total of 122
counties receive both 5311 and 5310 funding.
The remaining 1,292 do not receive either type of FTA funding. These 1,292 counties include approximately 3.6 million people with disabilities.The map shows that 5311 funding is spread widely among rural counties across the country,
with less distribution in some states, especially in the South and Appalachian regions. Many
rural counties in these states do not receive any FTA funding at all, with a smaller number receiving both 5311 and 5310 in states like Texas, Oklahoma, and Georgia. Rural counties that receive FTA funding in Alaska and Hawaii receive exclusively 5311 funding.Click on the map for a larger version.
Map produced February 2021 based on Federal Transit Administration 2019 Revenue Sources data.
For more information, see:
February 2021 | Andrew Myers & Ari LissauUniversity of Montana Rural Institute | PDF; text-only Word doc; text-only EPUB
Health-related
-
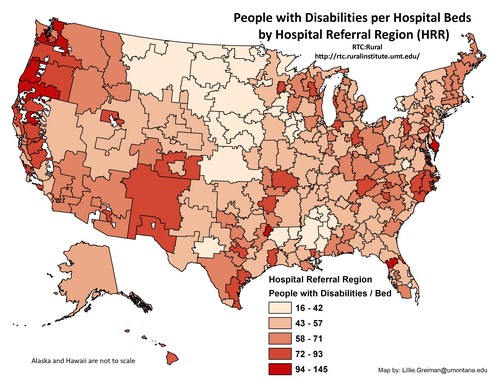 This map outlines hospital referral regions across the United States. Each region is highlighted in shades of red to designate the rate of people with disabilities per hospital bed. Darker shades indicate fewer beds.
In general, there are fewer beds available per person in more populated regions such as along the Pacific coast and urban regions in the east. There are also lower rates of bed availability in sparsely populated regions thought the west, such as Nevada, Idaho, Utah, and New Mexico.
Regions which include states such as North Dakota, South Dakota, Nebraska, and Kansas appear to have more beds available, while other areas, such as Appalachia and the Southern U.S. are highly variable. Map by: Lillie.Greiman@mso.umt.edu.
Click on the map for a larger version.
-
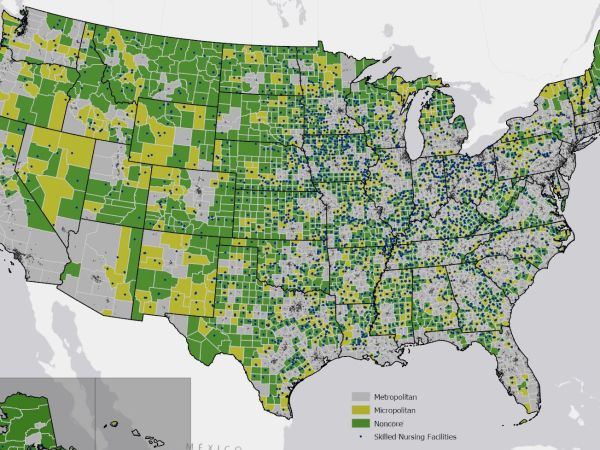
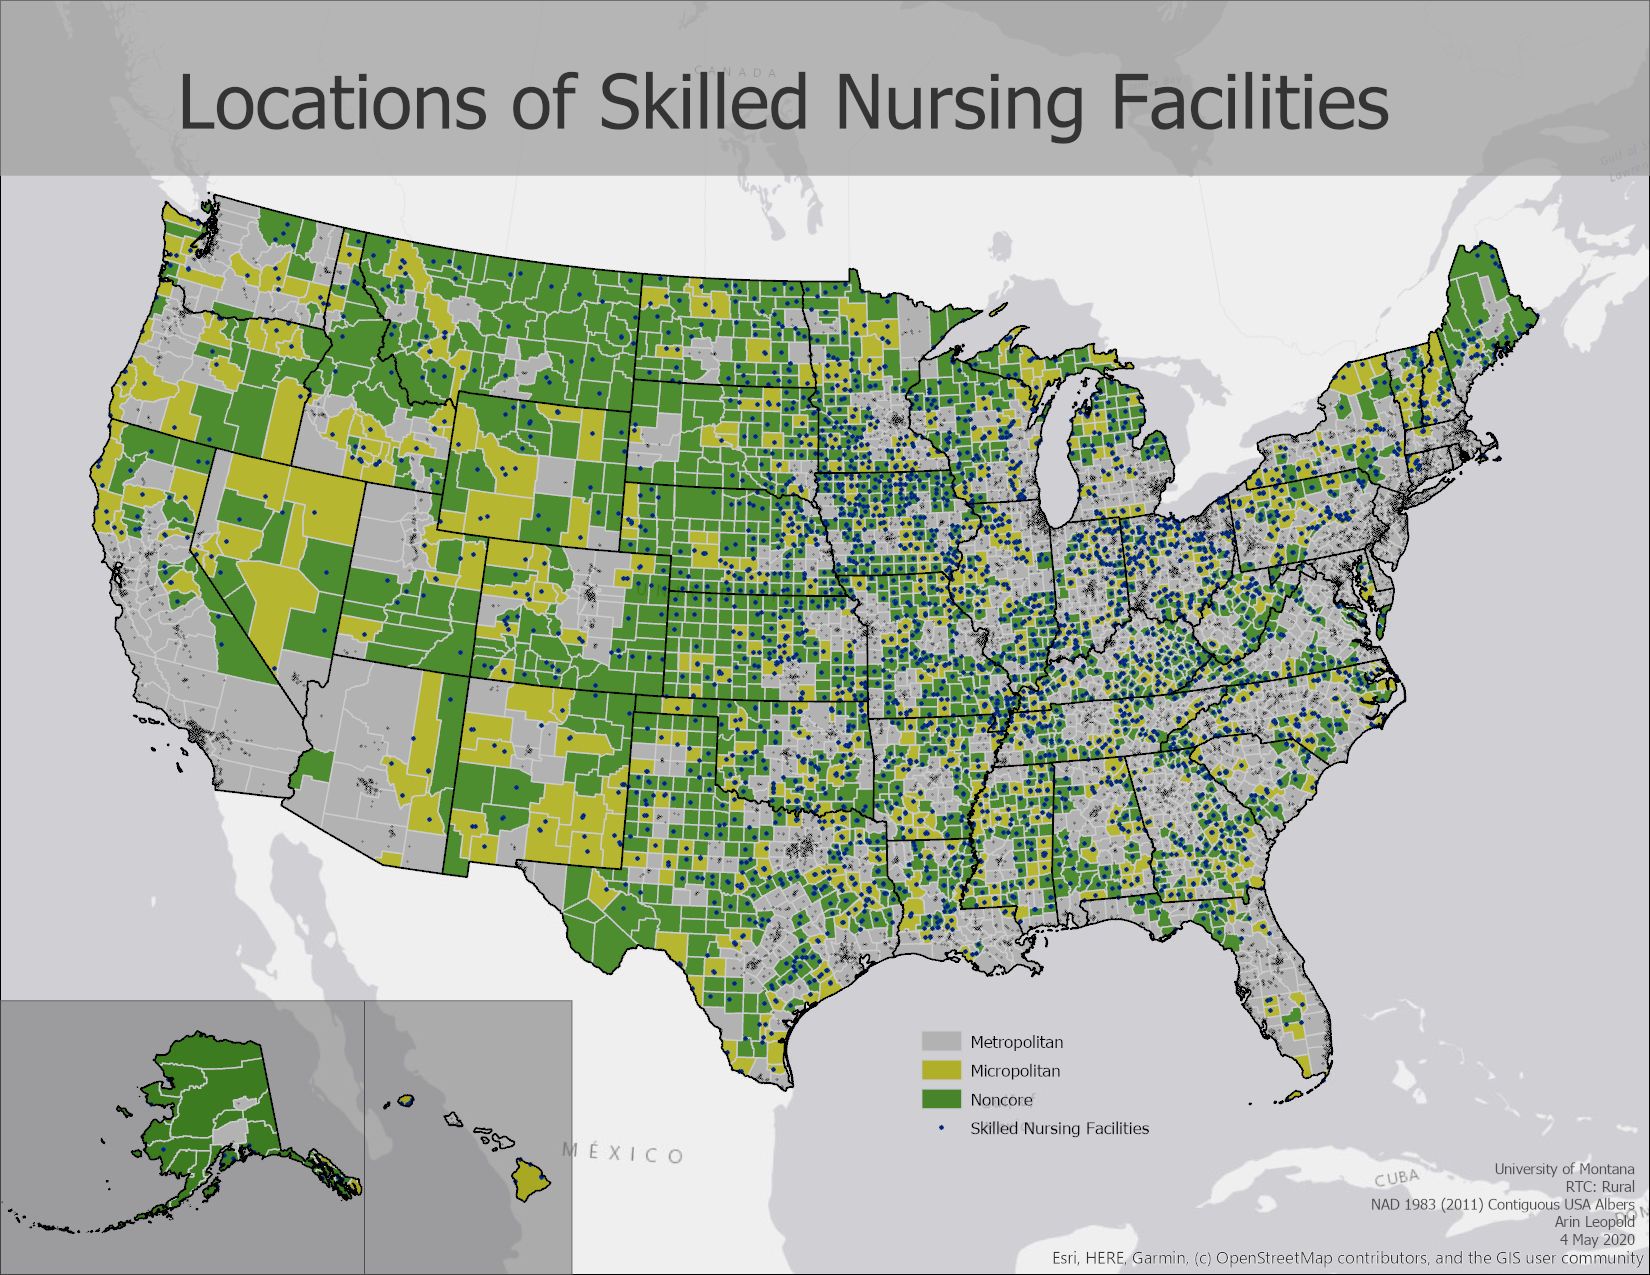
 This map of the United States shows the dispersion of skilled nursing facilities across all U.S. counties. Counties are designated as metropolitan, micropolitan, and noncore.
Nearly a third of skilled nursing facilities are located in rural counties, whereas rural includes micropolitan and noncore counties, using the Office of Management and Budget classification definition.
Map produced May 2020 using CMS Provider of Services data from HRSA. https://data.hrsa.gov/data/about
-
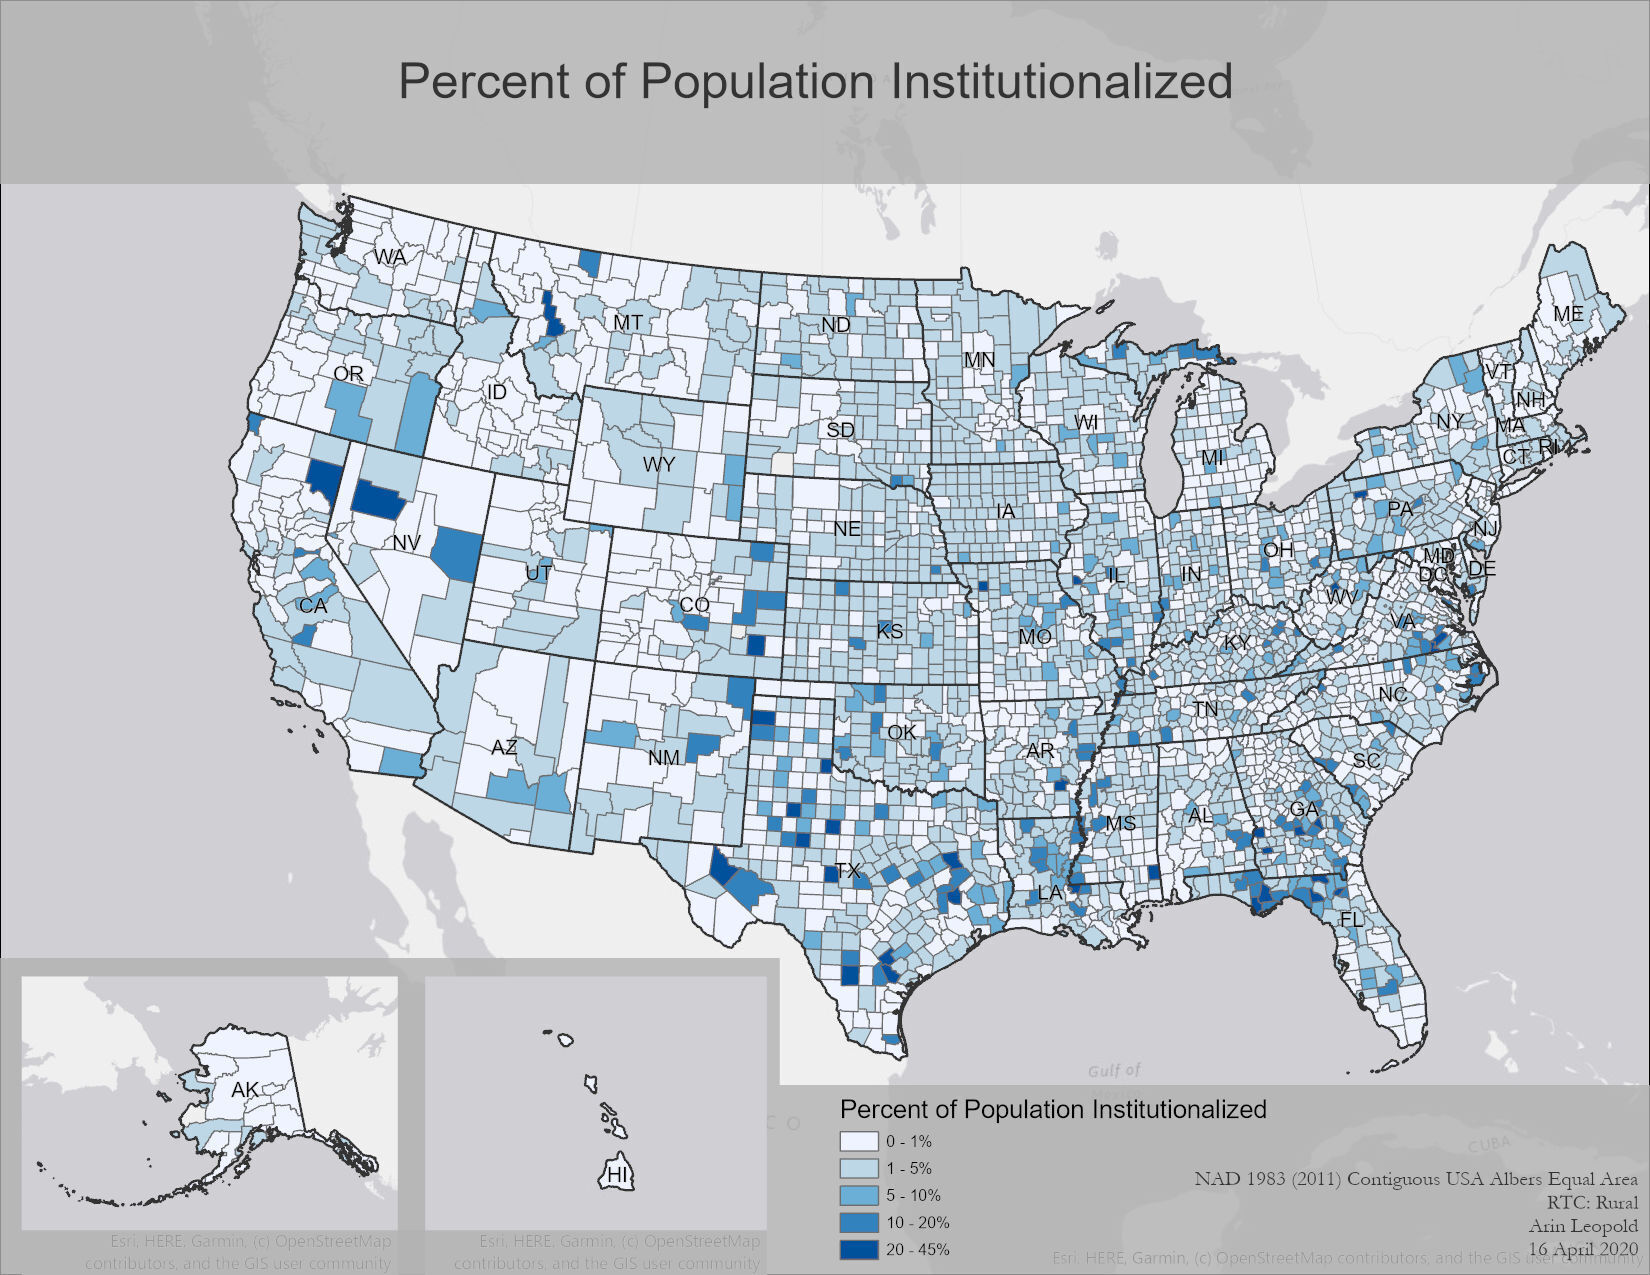
 In the United States, the overall rate of disability is 13.1% (see the Annual Disability Statistics Compendium). When looking at rates for those in institutional settings, the rates are much higher: rates in correctional facilities (prisons and jails) are 25.2%, and rates in nursing homes are 96.3% (ACS 2018 table S2602).
 Institutional settings are not spread equally across the U.S.: they tend to be concentrated in rural areas. This map shows the percent of the population that is institutionalized by county for the entire United States.
Rates are broken into five levels: 0-1%, 1-5%, 5-10%,10-20%, and 20-45% . Rates tend to be highest in rural counties.
Map produced April 2020 based on U.S. Census Group Quarters data.
Click on the map for a larger version.
-
This map outlines hospital referral regions across the United States. Each region is highlighted in shades of red to designate the rate of people with disabilities per hospital bed. Darker shades indicate fewer beds.
In general, there are fewer beds available per person in more populated regions such as along the Pacific coast and urban regions in the east. There are also lower rates of bed availability in sparsely populated regions thought the west, such as Nevada, Idaho, Utah, and New Mexico. Regions which include states such as North Dakota, South Dakota, Nebraska, and Kansas appear to have more beds available, while other areas, such as Appalachia and the Southern U.S. are highly variable.
Map by: Lillie.Greiman@mso.umt.edu

People with Disabilities in the Paths of Hurricanes
-
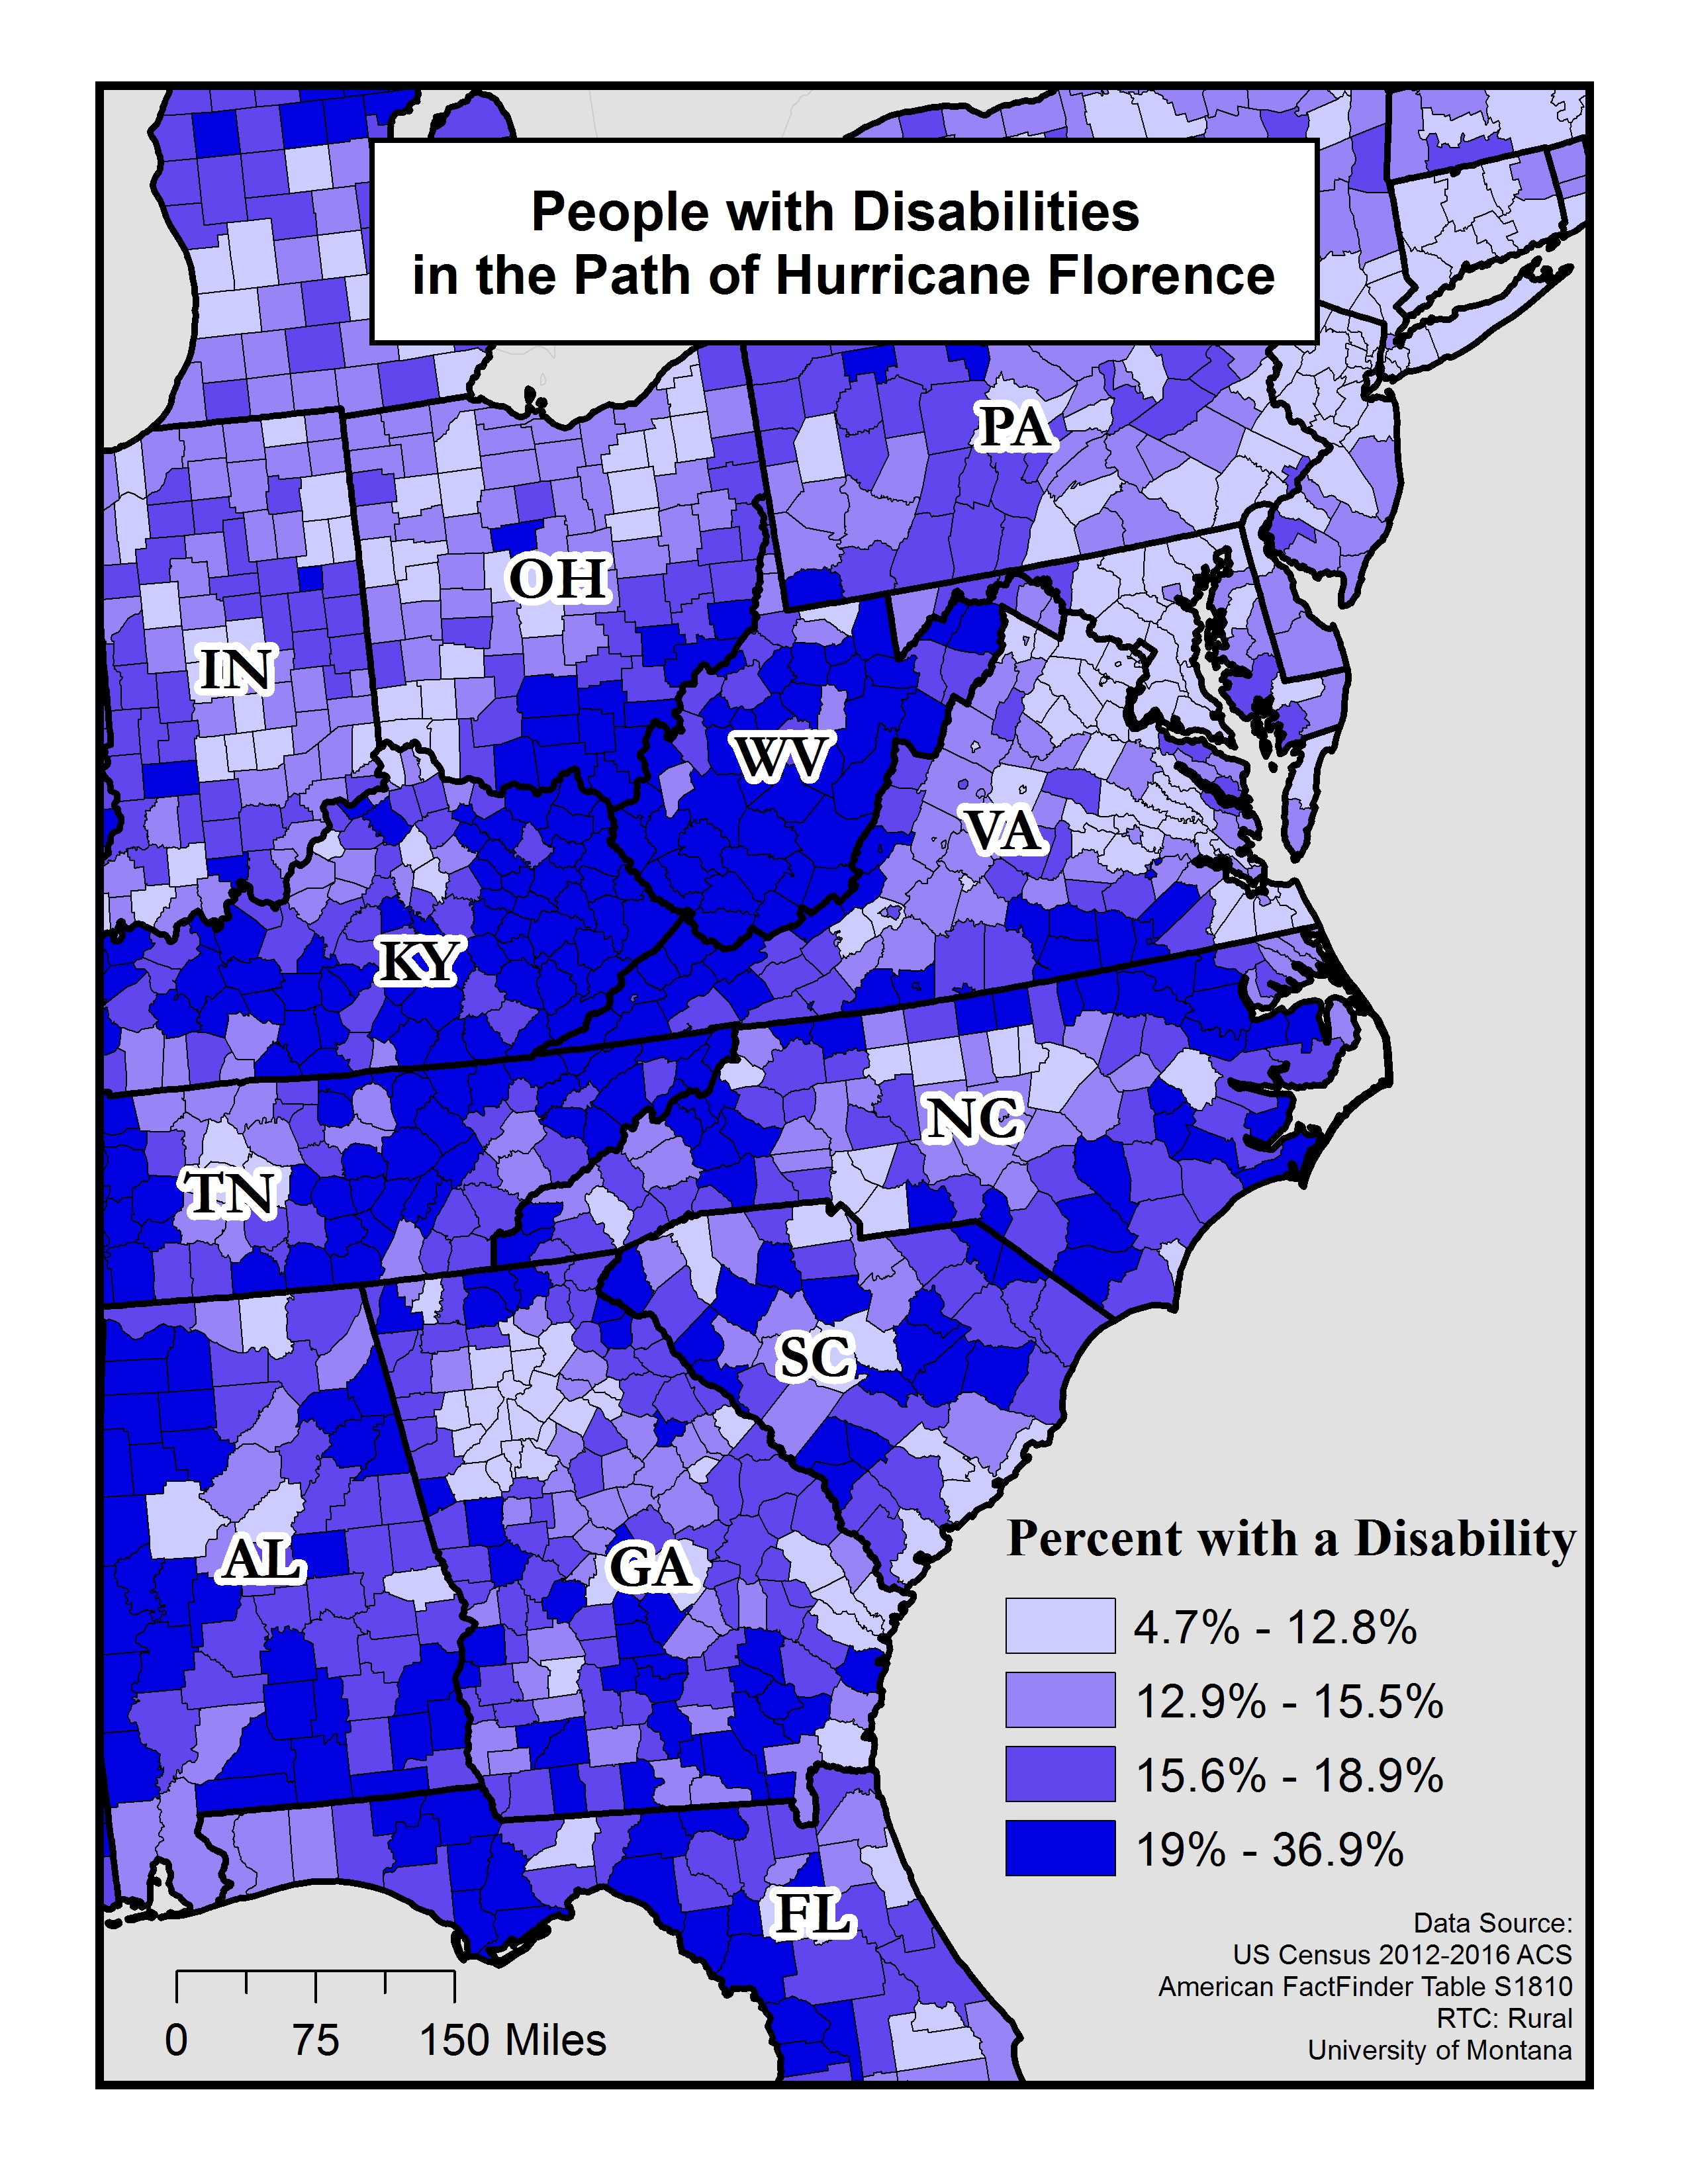
Percent of People with Disabilities in the Path of Hurricane Florence
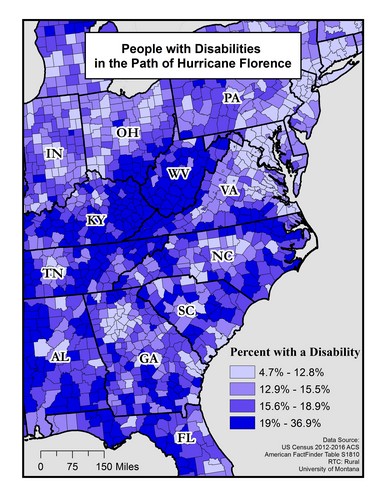 This map shows the percent of people, by county, estimated by the ACS to have disabilities in the Southeastern region of the United States. Disability rates are broken into four levels: 4.7-12.8%, 12.9-15.5%, 15.6-18.9%, and 19%-36.9%. Darker purple indicates a higher rate. The map shows counties just inland from the coast in North Carolina, South Carolina, and Virginia as having high rates of disability (19% -36.9%).
Click on the map for a larger version.
Data source: US Census 2012-2016 ACS American FactFinder Table S1810
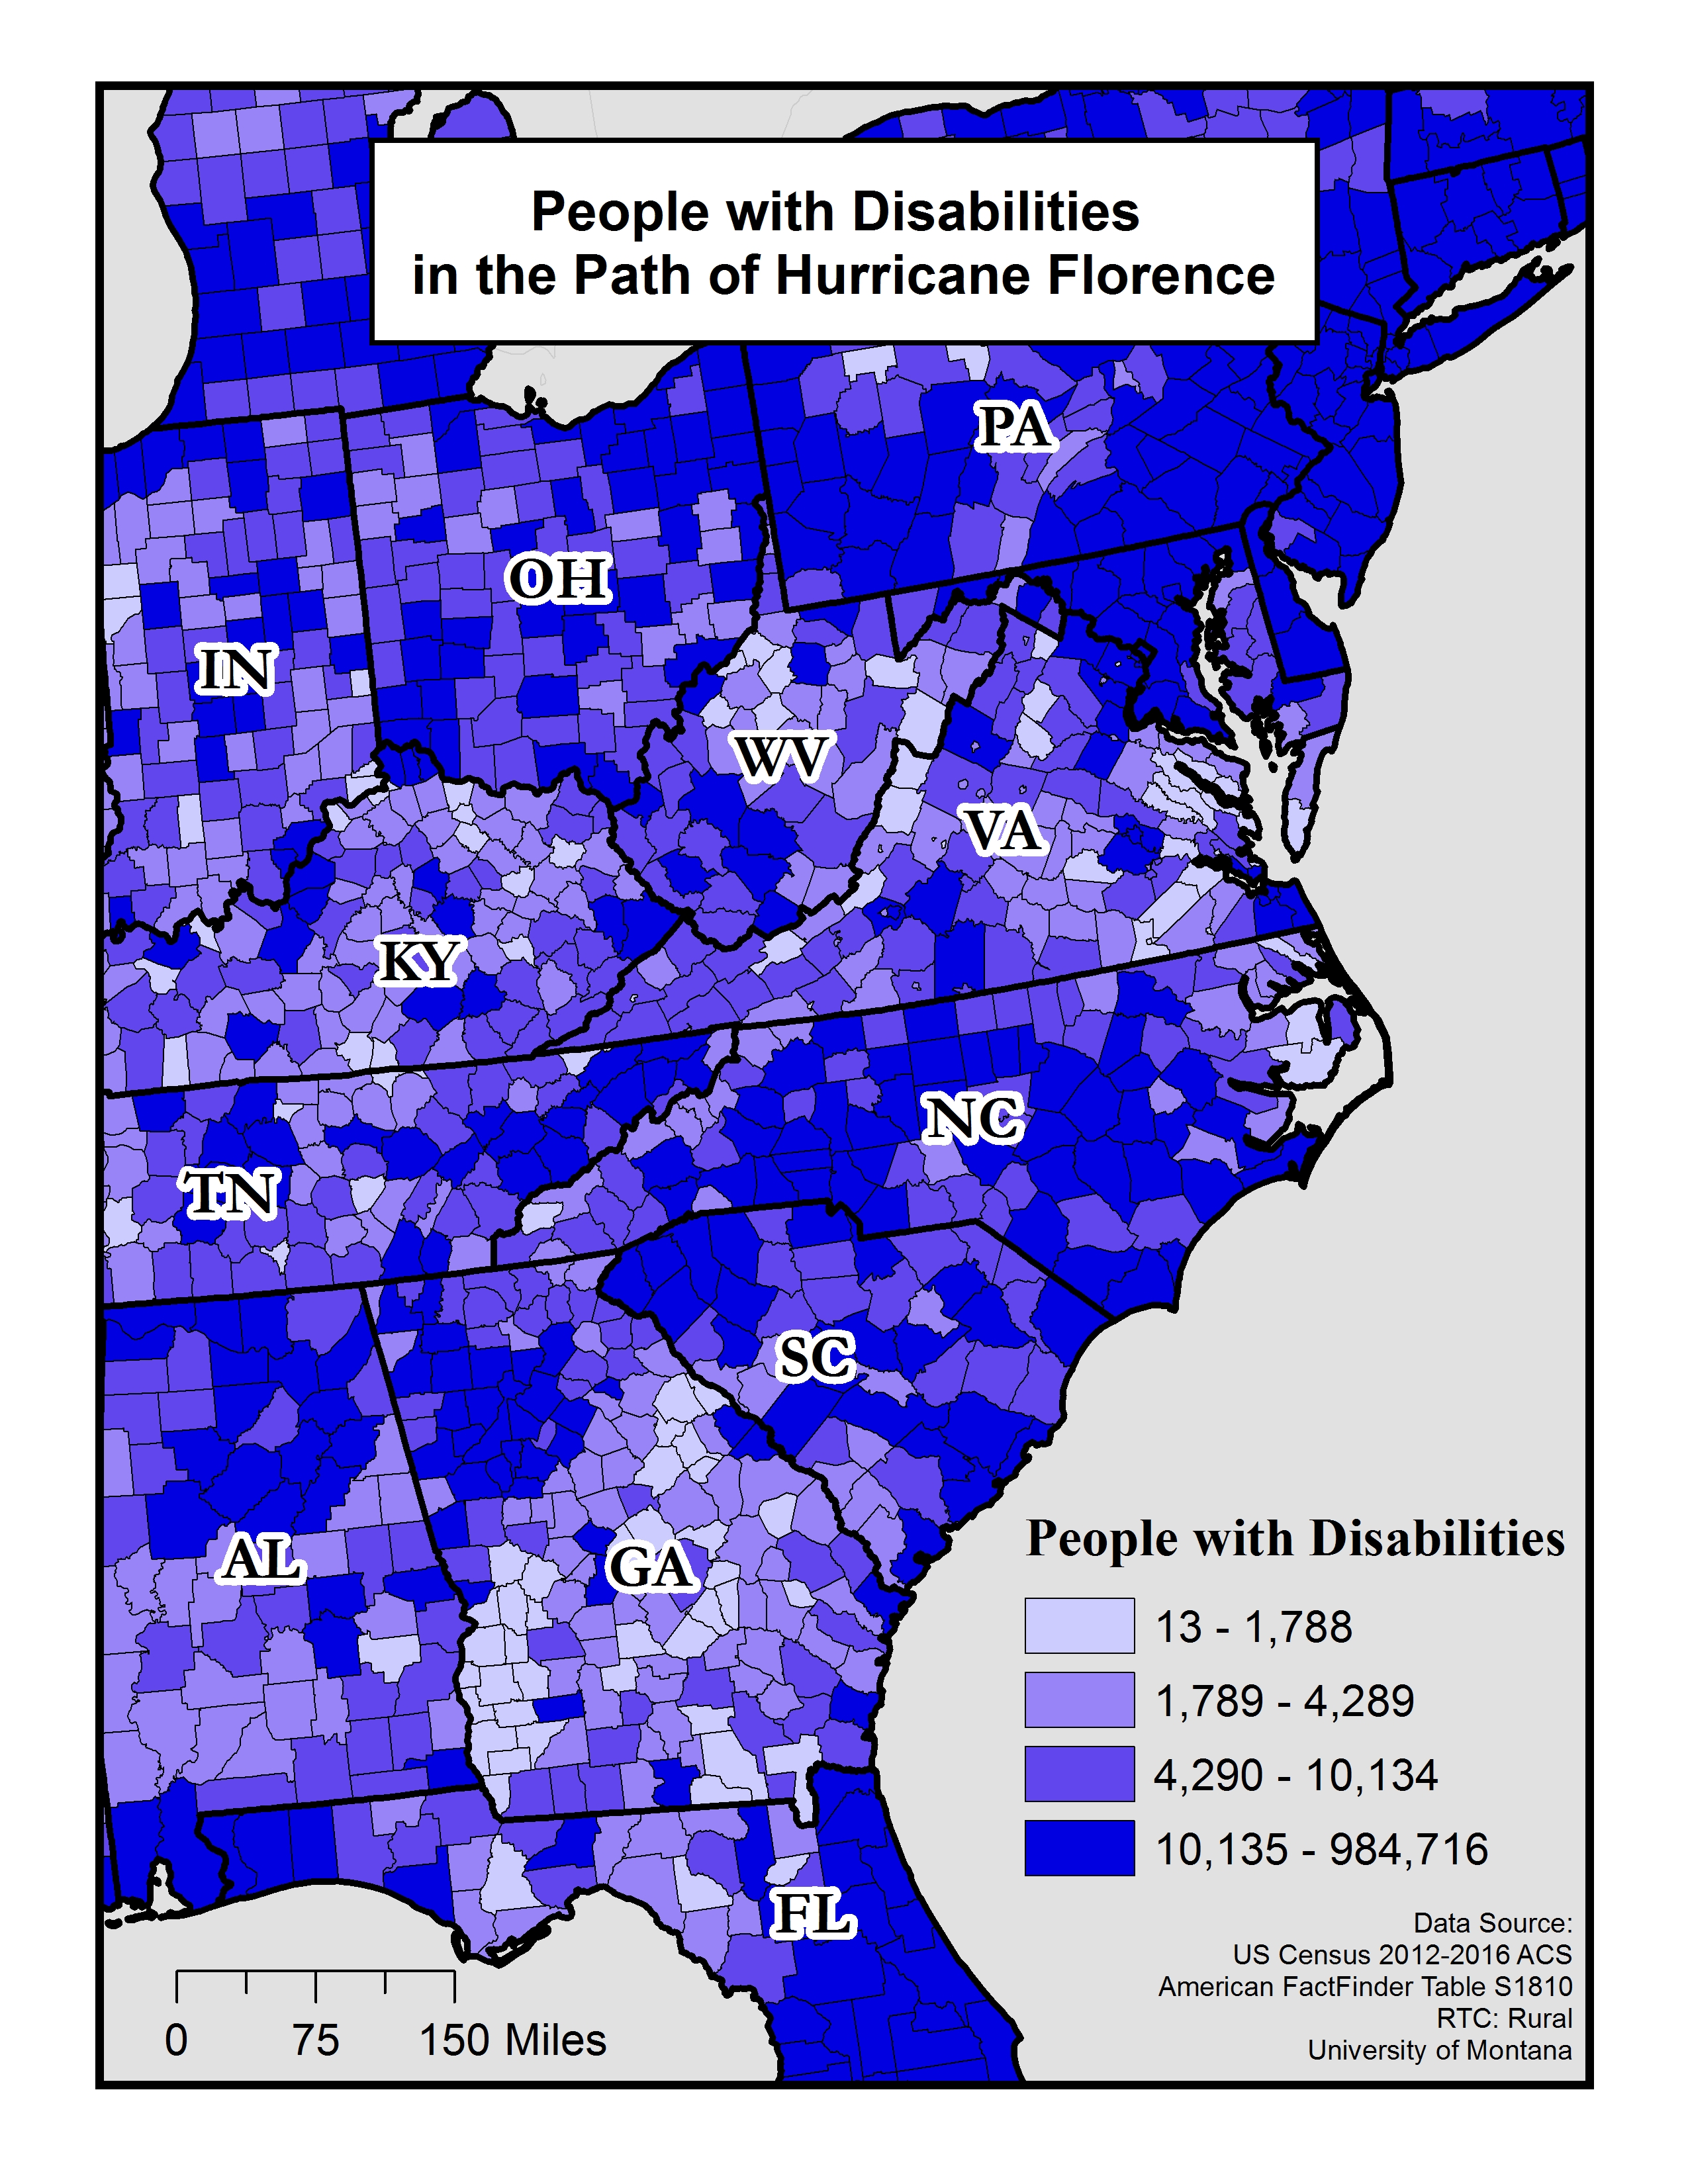
Number of People with Disabilities in the Path of Hurricane Florence
 This map shows the number of people, by county, estimated by the ACS to have disabilities living in the Southeastern region of the United States. Population is broken into four levels: 13 – 1,788 individuals, 1,789 – 4, 289 individuals, 4,290 – 10,134 individuals, and 10,135 – 984,716 individuals. Darker purple indicates a higher population. The map shows counties with large populations of people with disabilities (10,000 and more) throughout North and South Carolina, and the northern coast of Florida.
Click on the map for a larger version.
Data source: US Census 2012-2016 ACS American FactFinder Table S1810
-
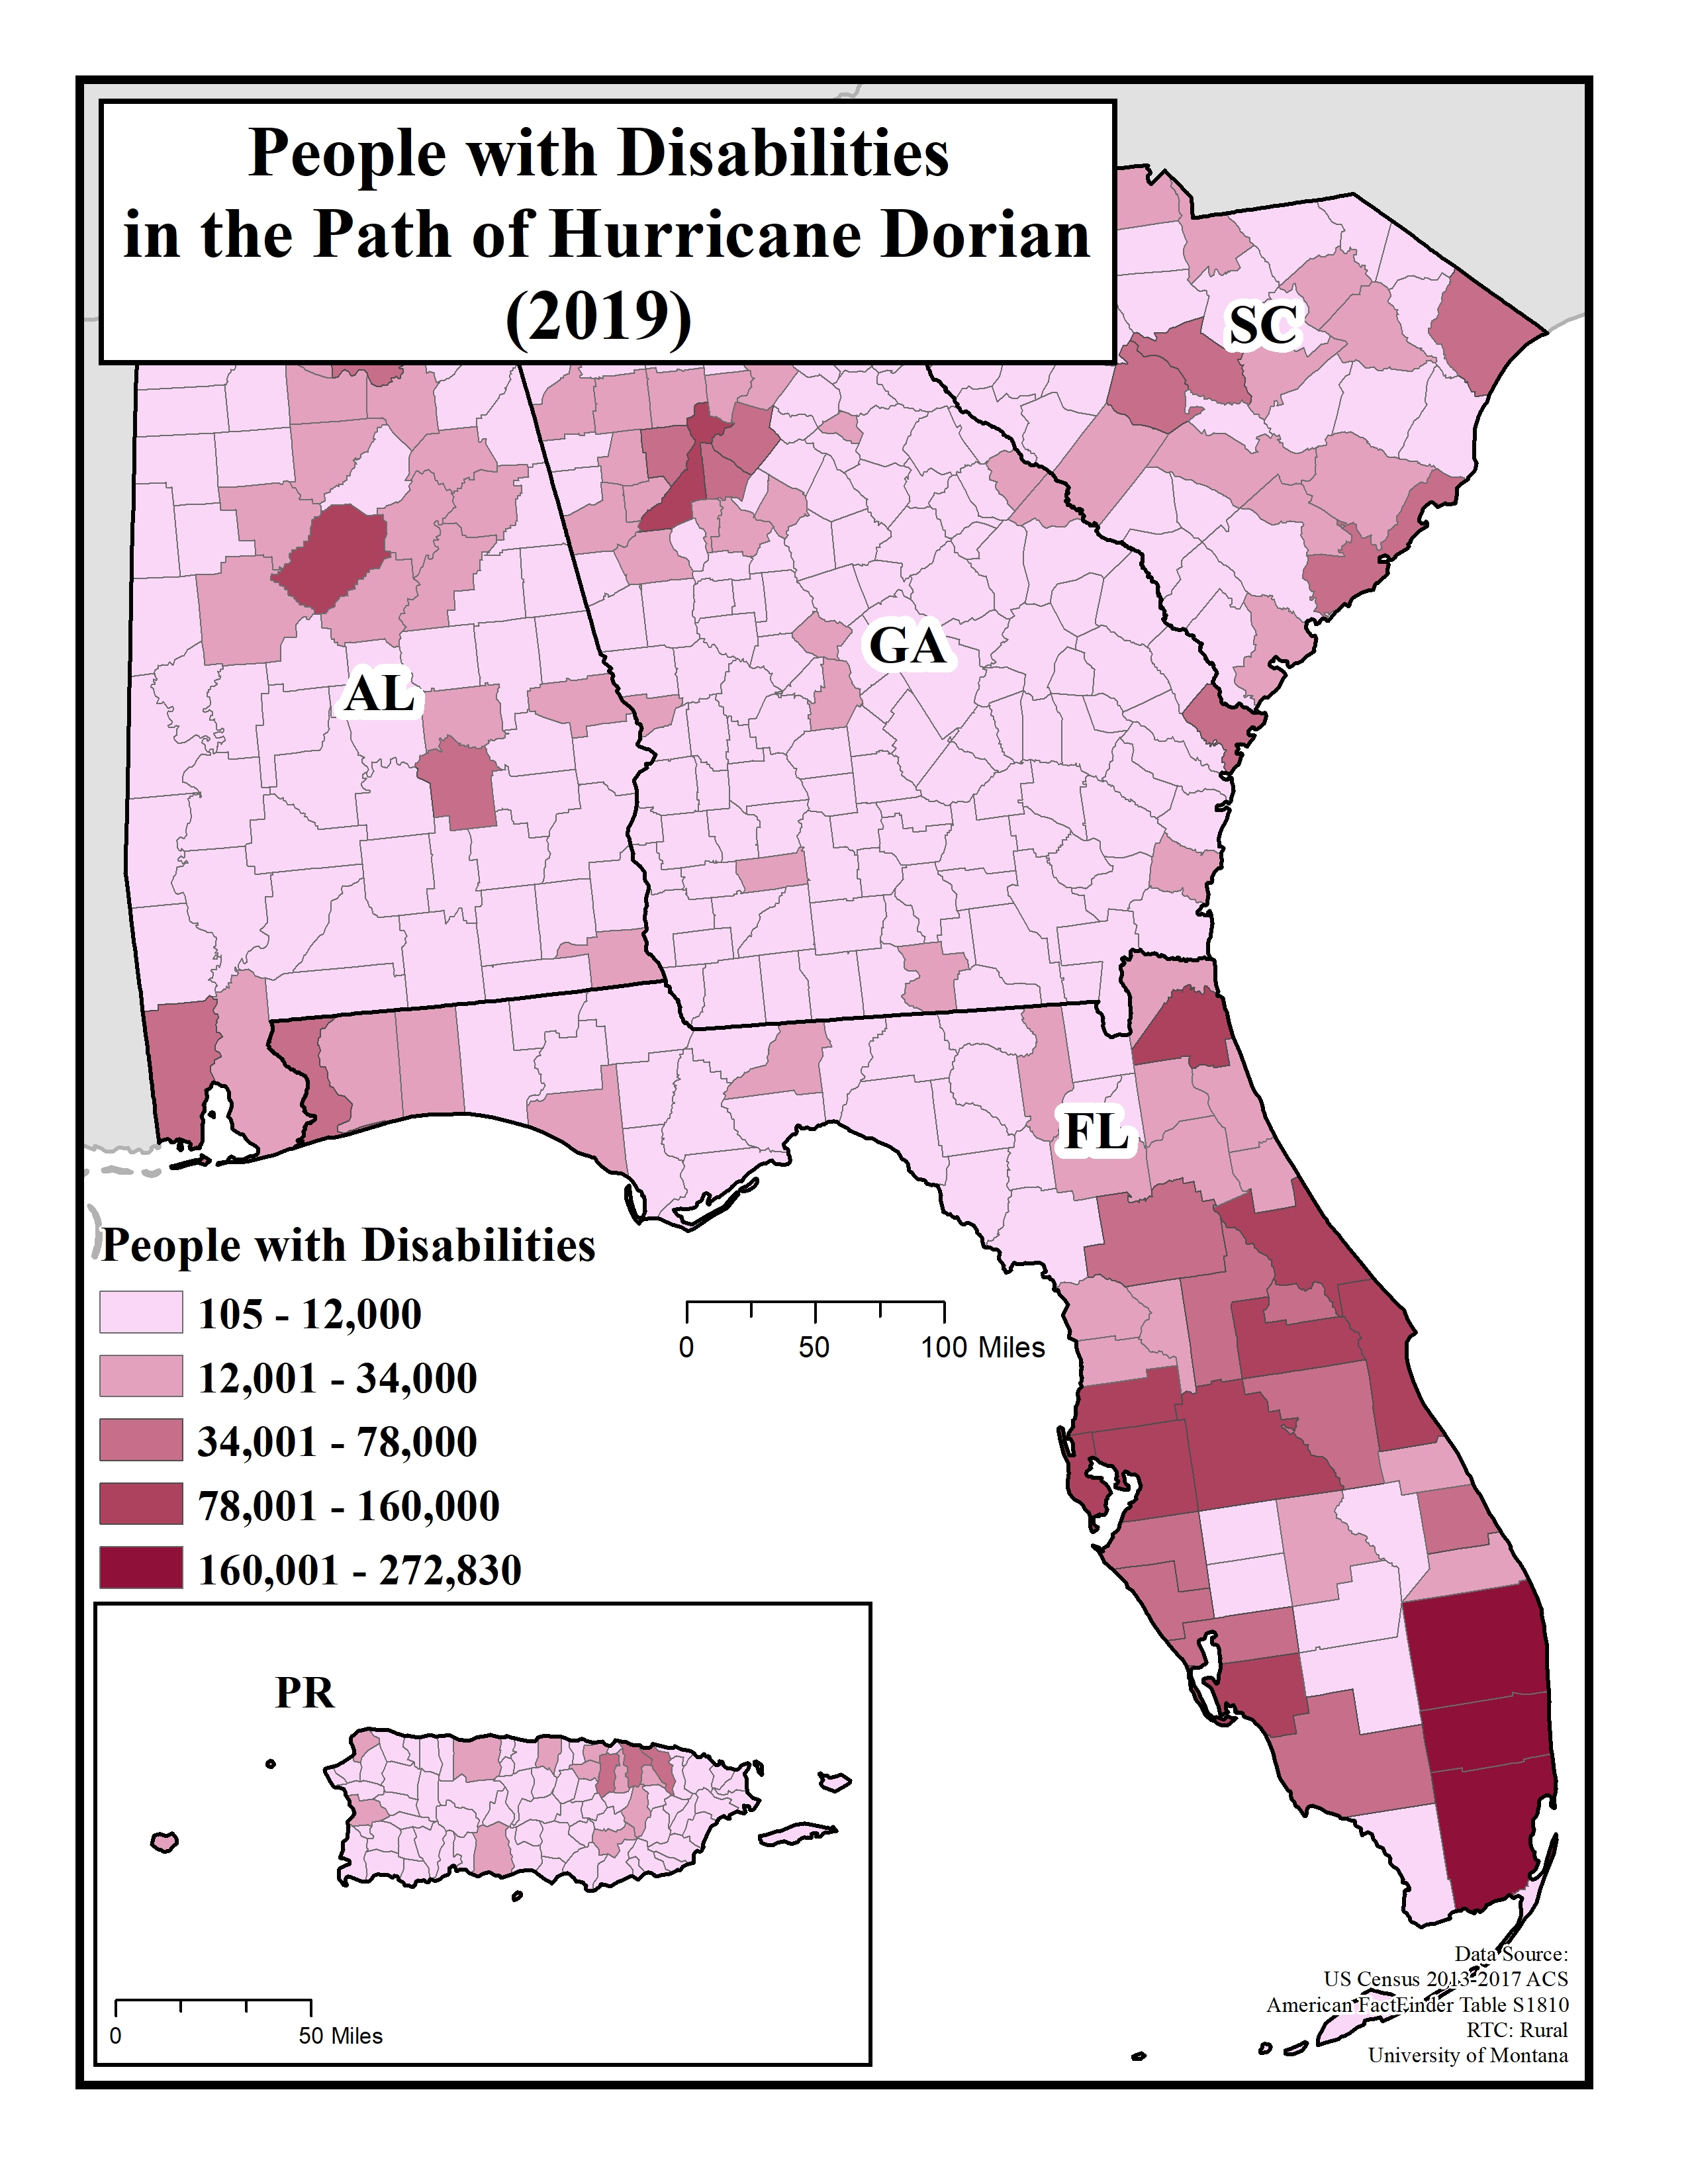
People with Disabilities in the Path of Hurricane Dorian
 The map above shows the number of people, by county, estimated by the American Community Survey to have disabilities living in Florida, Georgia, Alabama and Puerto Rico. Population is broken into five levels: 105-12,000 individuals, 12,001-34,000 individuals, 34,001-78,000 individuals, 78,001-160,000 individuals and 160,001-272,830 individuals. Darker maroon indicates a higher population. The map shows counties with large populations of people with disabilities (78,000 and more) throughout southern Florida where Dorian is expect to make landfall and cause the most significant damage.
While the counties with the highest number of people with disabilities are on the southeastern coast, there are also many people with disabilities who live in the more rural counties of central Florida who will also be affected by Hurricane Dorian.
Click on the map for a larger version.
Data source: US Census 2013-1017 ACS American FactFinder table S1810
-
Number of people with disabilities in the path of Hurricane Laura
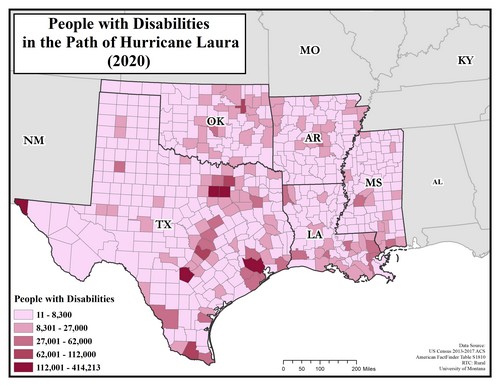 This map shows the number of people, by county, estimated by the American Community Survey to have disabilities living in Texas, Oklahoma, Arkansas, Louisiana, and Mississippi. Population is broken into five levels: 11 to 8,300 individuals, 8,301 to 27,000 individuals, 27,001 to 62,000 individuals, 62,001 to 112,000 individuals and 112,001 to 414,213 individuals. Darker maroon indicates a higher population. The areas with the highest numbers of people with disabilities are the major urban areas in each state, which includes many people along the Gulf Coast. In Louisiana and Mississippi, most of the counties along the Gulf have 8,301 to 62,000 people with disabilities. Along the Texas coast, Houston, Corpus Christi, McAllen, and Brownsville are all in counties with higher numbers, of 62,001 to 414,213 people with disabilities.
 Click on the map for a larger version.
Data source: US Census 2013-1017 ACS American FactFinder table S1810
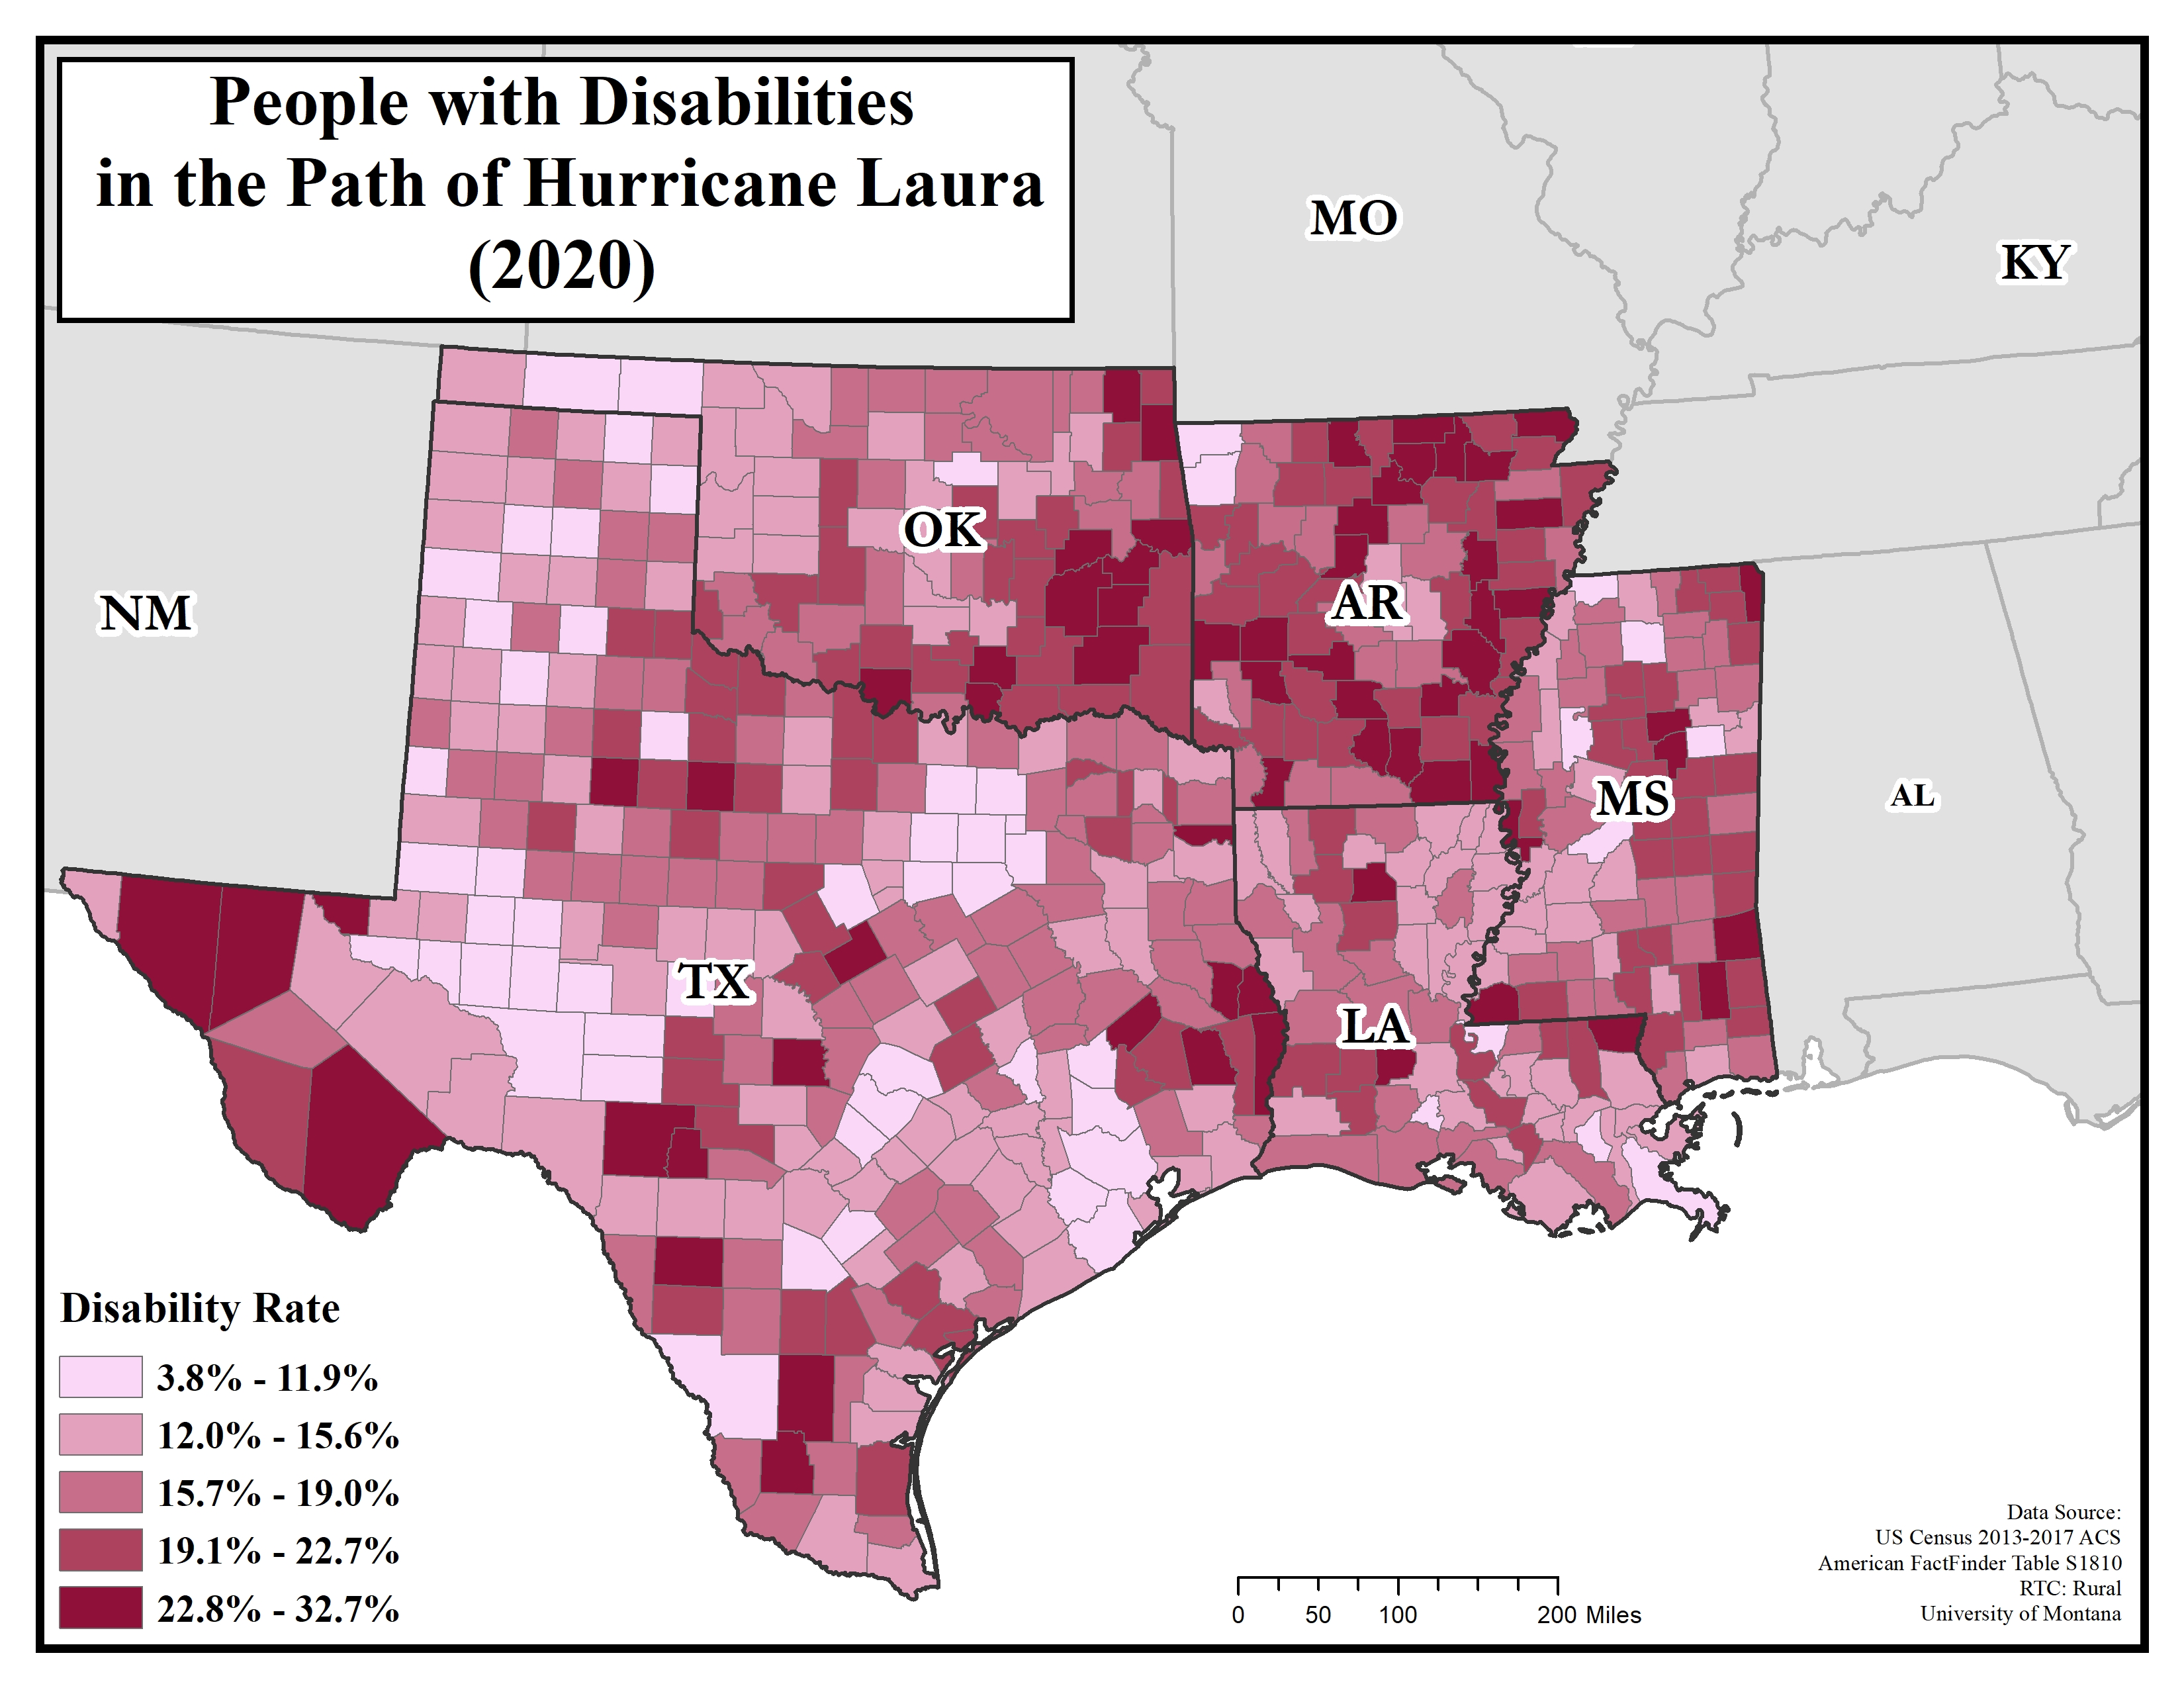
Rates of people with disabilities in the path of Hurricane Laura
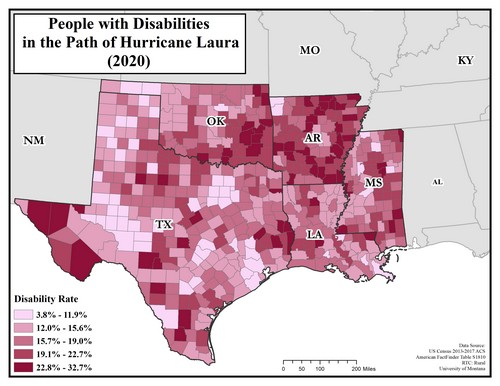 The map above shows the percent of people, by county, estimated by the ACS to have disabilities in the states of Texas, Oklahoma, Arkansas, Louisiana, and Mississippi. Disability rates are broken into five levels: 3.8 to 11.9%, 12.0 to 15.6%, 15.7 to 19.0%, 19.1 to 22.7%, and 22.8 to 32.7%. There tend to be higher rates of disability in rural areas, especially in Arkansas and Mississippi. The majority of counties in Arkansas have rates of 19.1 to 22.7% or 22.8 to 32.7%. Many counties with high rates are just inland of the coast.
Click on the map for a larger version.
Data source: US Census 2013-1017 ACS American FactFinder table S1810