Rapidly Identifying Quads Where Mapping is Outdated
Project lead: Linda Vance
Analyst: Joe Fortier
Since its inception in 2006. the Montana Natural Heritage Program’s wetland mapping project has documented over 3.2 million acres of wetland and riparian habitats across the state. However, our landscape is dynamic. Land use and land cover changes, driven by both natural and anthropogenic processes, occur constantly in Montana, and as a result, any static representation of the environment will naturally become out-of-date over time.
We developed a process to map these changes that leverages the 30+ year historical record of Landsat satellite imagery and the cloud computing capabilities of Google Earth Engine to create something that is rapid, repeatable, and able to be applied statewide over multiple timescales. By comparing maps of significant landscape change with the wetland and riparian mapping products, we were able to not only identify where our current maps have become outdated, but also to explain what processes are responsible for changing these habitats and show where current land-cover change might be threatening wetlands in the future by proximity.
The number one driver of landscape change affecting wetland and riparian habitats since they were mapped appears to be the 2011 flooding, which shifted the course of major rivers across the state and dramatically reshaped their adjacent riparian zones. River channels and adjacent vegetation along the Bitterroot, Yellowstone, Missouri, and Flathead Rivers account for the bulk of the outdated polygons in the current wetland and riparian map layer; these were some of the earliest mapped (between 2006 and 2010) and pre-date the 2011 floods.
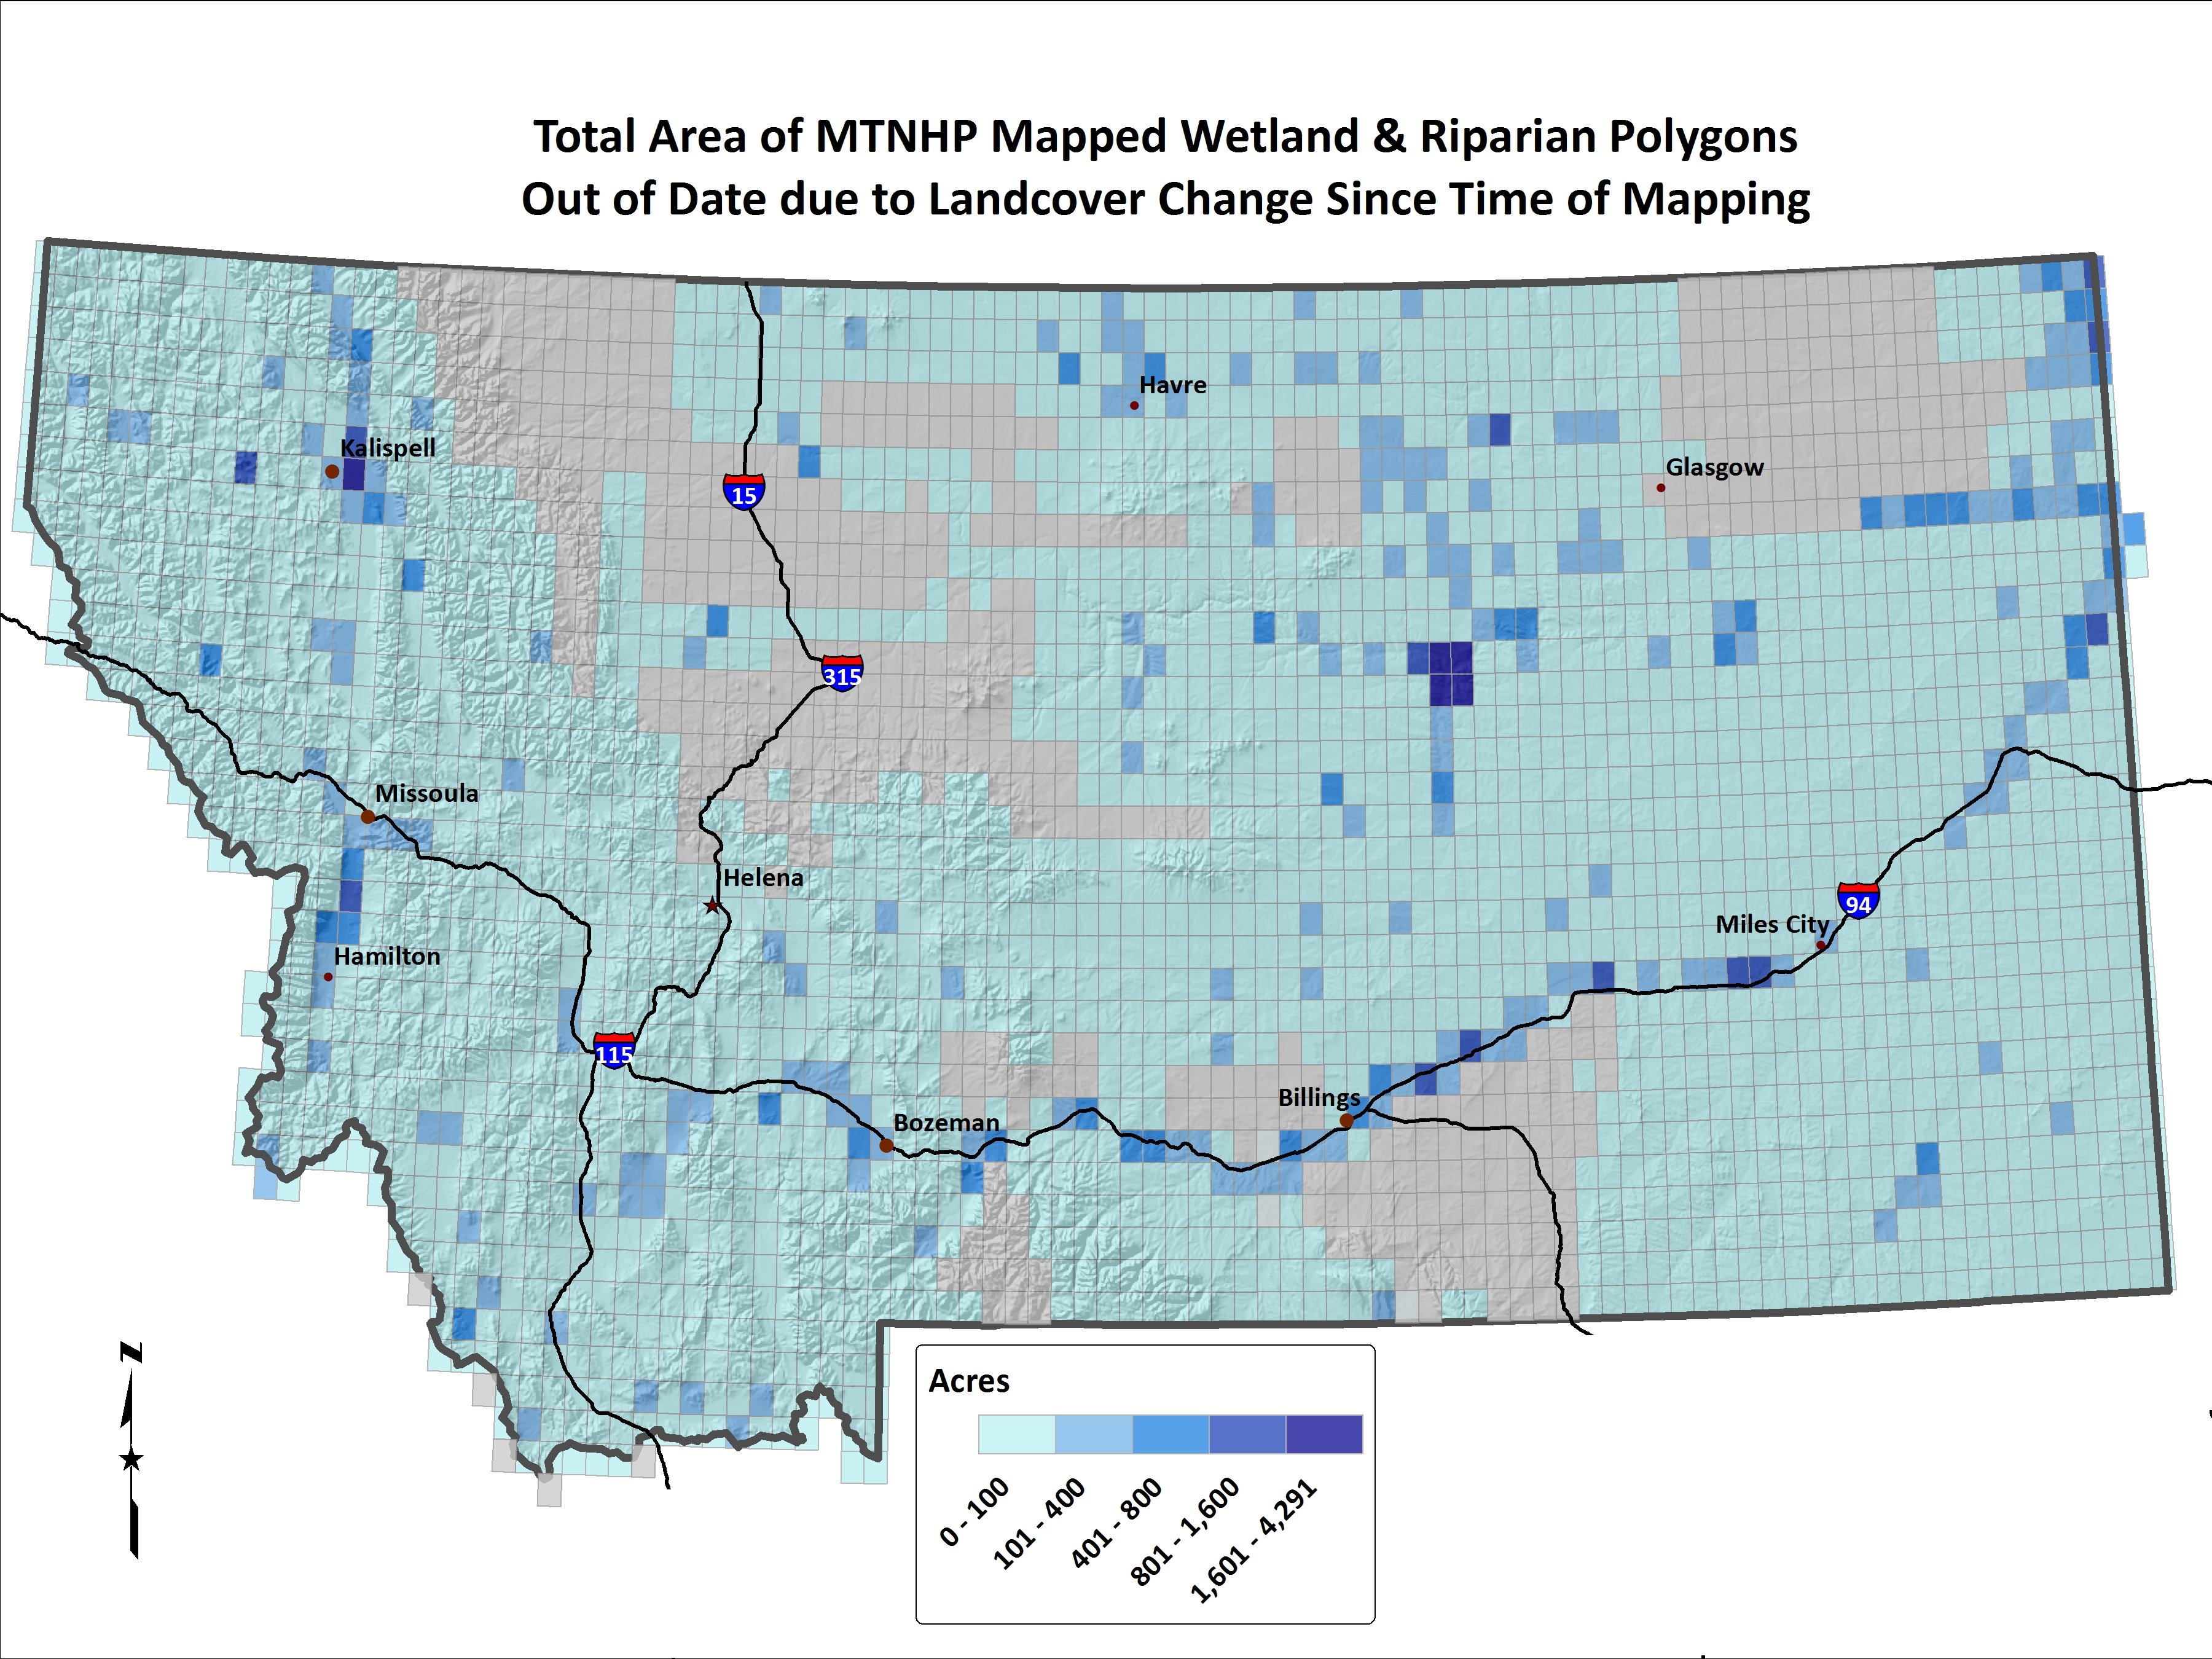
Map showing total area of outdated wetland/riparian polygons by 7.5 minute quad in Montana.
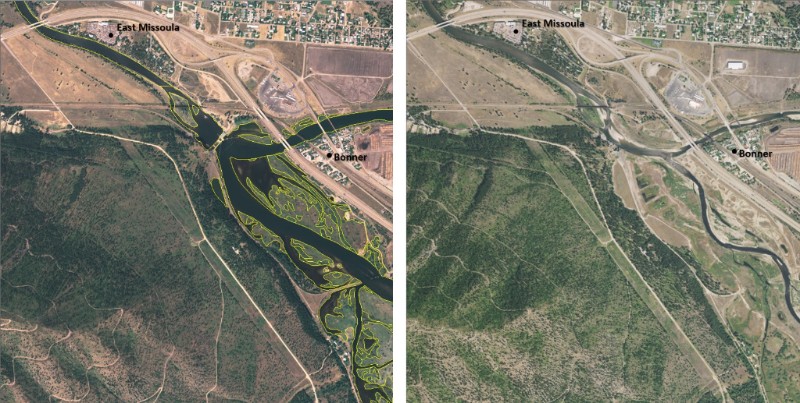
Image on left shows the confluence of the Blackfoot and Clark Fork rivers at the Milltown Dam reservoir in 2005, with the wetland and riparian mapping product overlaid in yellow. The Milltown Dam was in operation from 1908-2007. Image on right shows the same area in 2015, where the wetland and riparian mapping layer is no longer representative of the landscape, but has yet to be updated.