The maps on this page explore the American Community Survey 5-year data (Table S1810) on disability by county.
The ACS does not directly measure disability. Instead, it uses a set of disability indicator questions related to difficulty and functional impairment to identify individuals who may experience a disability. If a respondent can answer “yes” to any disability question they are classified as having a disability.
Disability Rates: Arizona
-
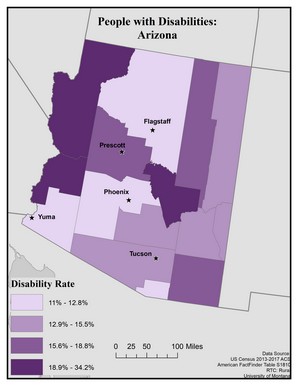
This map of the state of Arizona shows general rates of disability by county. Disability rates are broken into four levels: 11 to 12.8%, 12.9 to 15.5%, 15.6 to 18.8%, and 18.9 to 34.2%.
Of the 15 counties in Arizona, 3 of them (Mohave, La Paz, and Gila) have the highest (18.9 to 34.2%) disability rates. Yavapai, Navajo, and Cochise have disability rates of 15.6 to 18.8%. Pima, Pinal, Graham, Greenlee, and Apache have disability rates of 12.9 to 15.55. Yuma, Maricopa, Santa Cruz, and Cocoino have the lowest rates of disability, at 11 to 12.8%. According to 2015 OMB county designations, most of the counties in Arizona are considered urban. However, overall most of the rural counties tend to have higher disability rates than urban ones.
Map produced July 2019 based on 2013-2017 American Community Survey data.
- Click on the map for a larger, downloadable version.
- To browse or download the data used to make this map, use our Disability Data Lookup Tool.
-

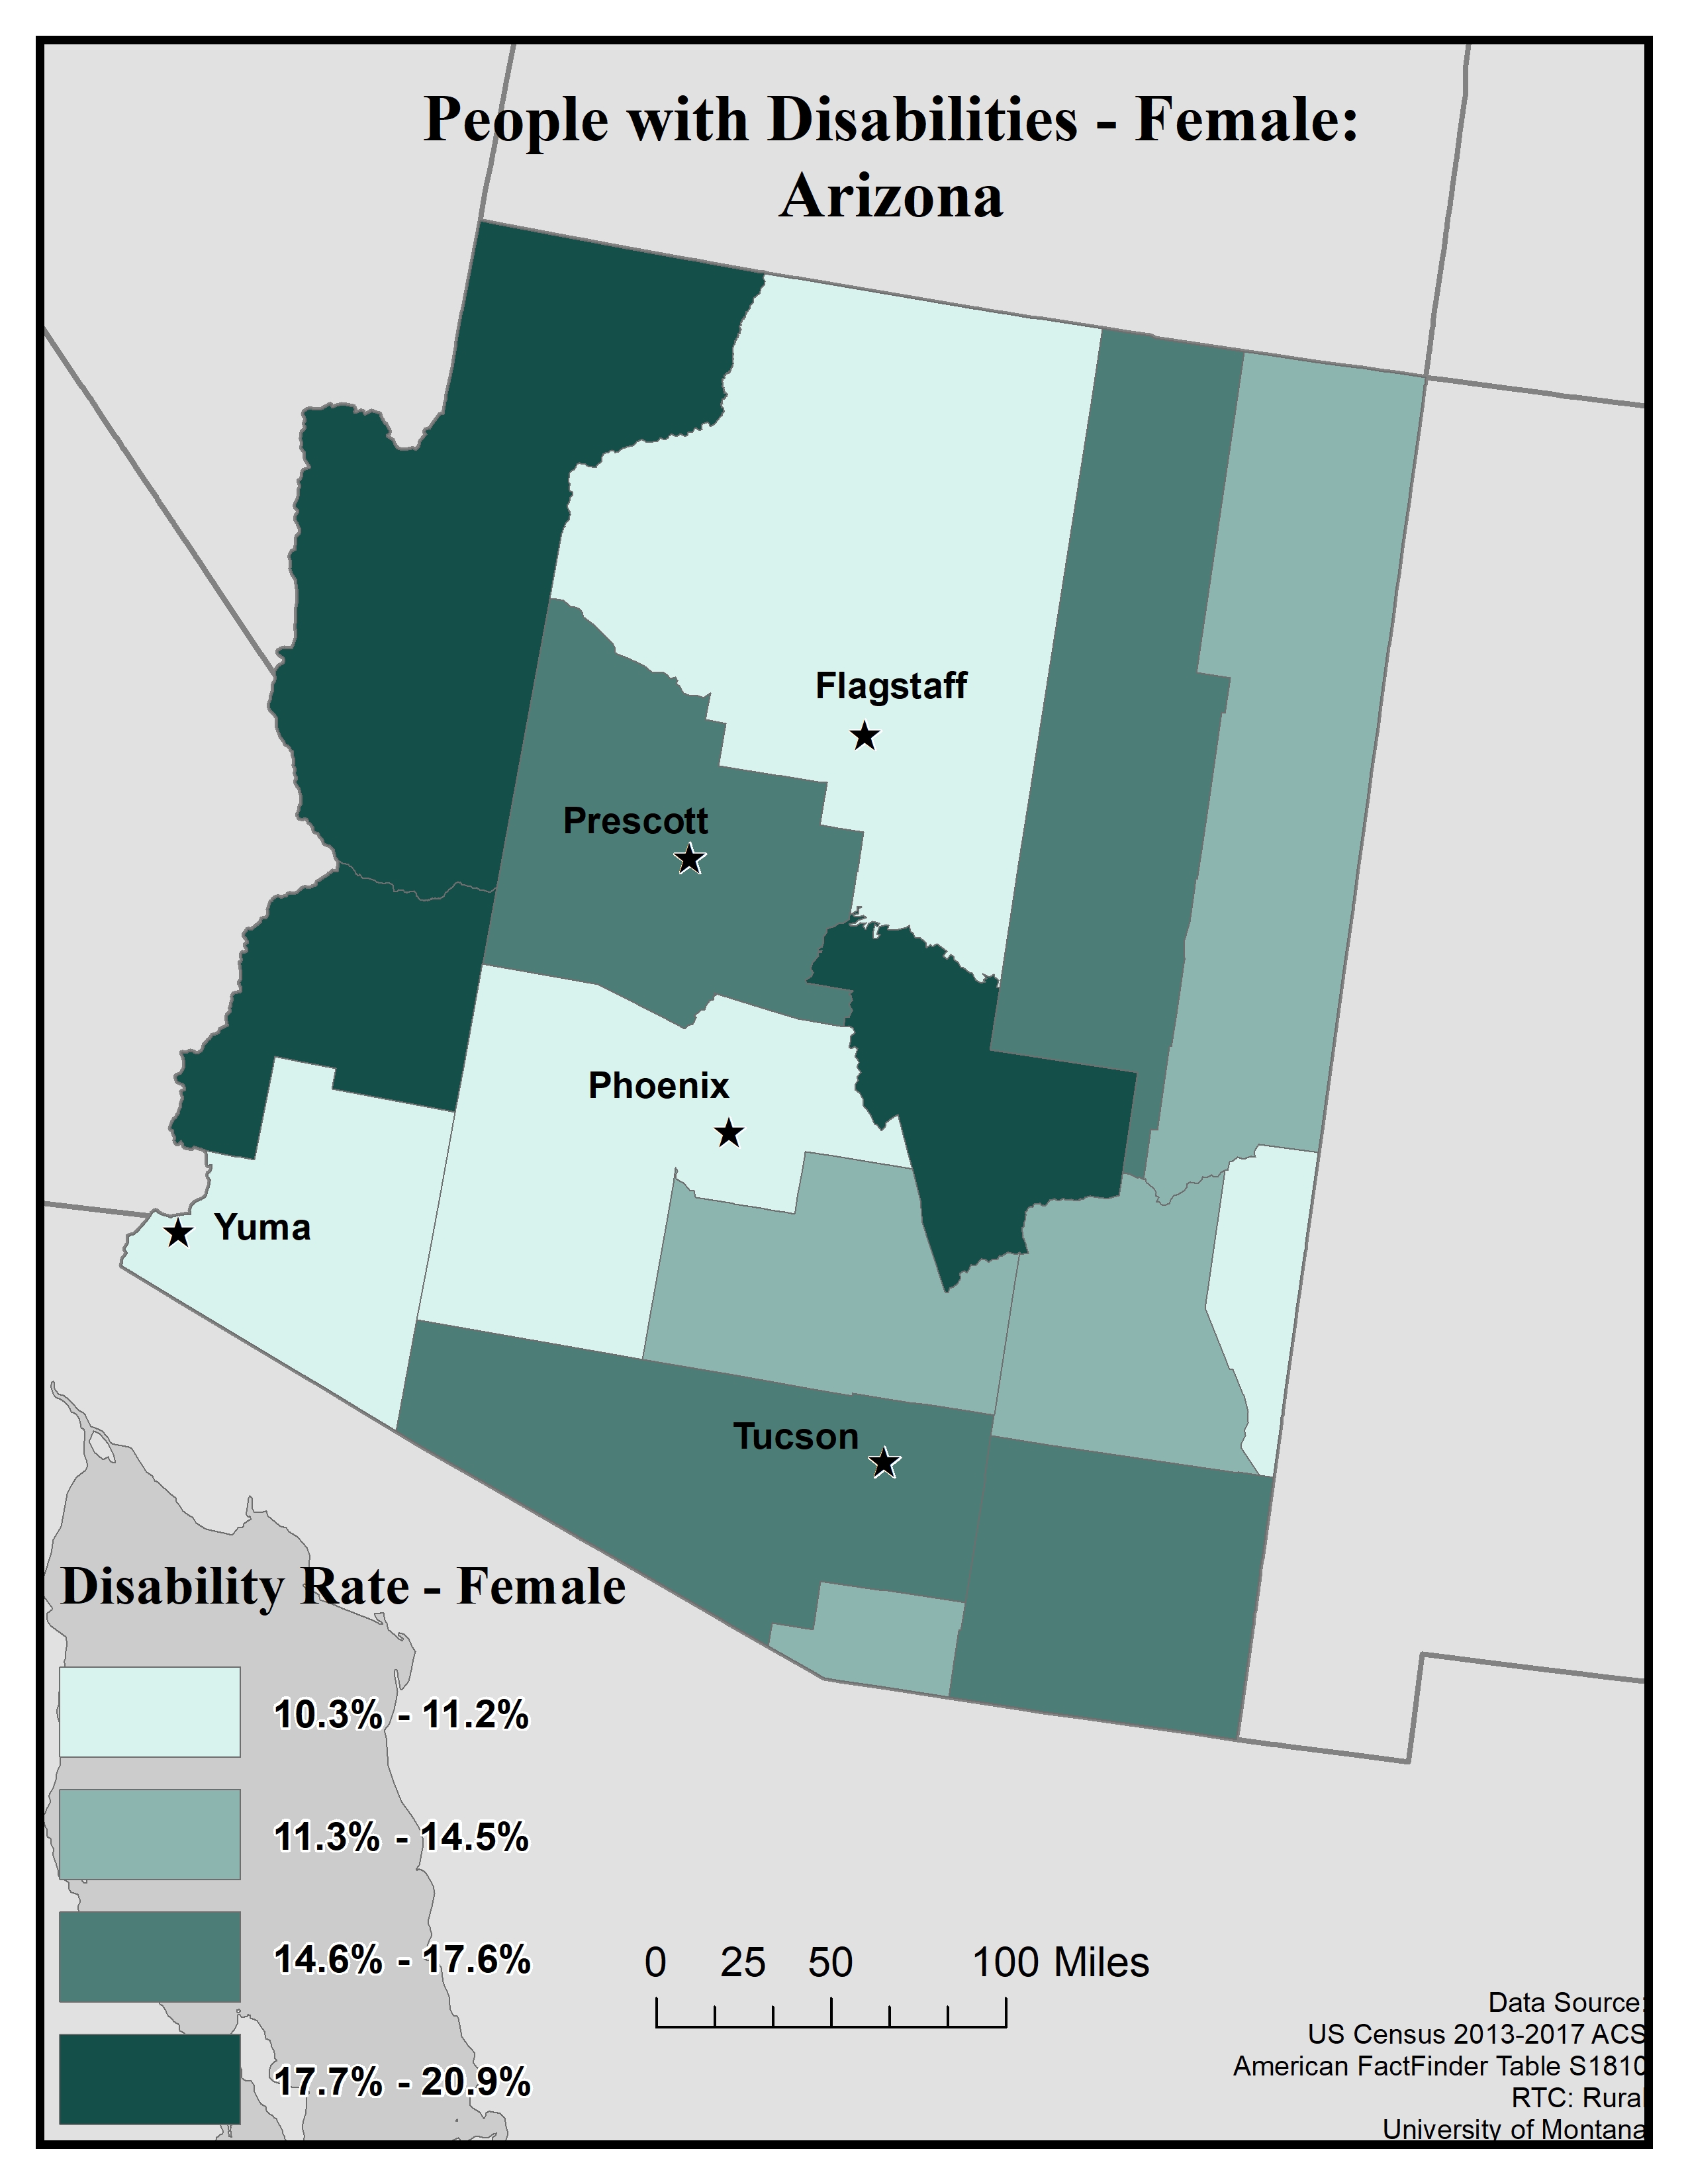
This map of the state of Arizona shows disability rates among females by county. Rates are broken into four categories: 10.3 to 11.2%, 11.3 to 14.5%, 14.6 to 17.6%, and 17.7 to 20.9%.
Mohave, La Paz, and Gila have the highest rates (17.7 to 20.9%). Yavapai, Navajo, Pima, and Cochise have second-highest rates (14.6 to 17.6%). Santa Cruz, Graham, Pinal, and Apache have rates of 11.3 to 14.5%. Yuma, Maricopa, Coconino, and Greenlee have the lowest rates, 10,3 to 11.2%.
Map produced July 2019 based on 2013-2017 American Community Survey data.
- Click on the map for a larger, downloadable version.
- To browse or download the data used to make this map, use our Disability Data Lookup Tool.
- For information on how biological sex is used and defined in the ACS, see “American Community Survey and Puerto Rico Community Survey 2017 Subject Definitions” page 125.
-
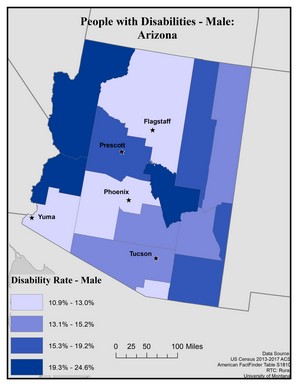 This map of the state of Arizona shows disability rates among males by county. Rates are broken into four categories: 10.9 to 13.0%, 13.1 to 15.2%, 15.3 to 19.2%, and 19.3 to 24.6%.
Mohave, La Paz, and Gila have the highest rates (19.3 to 24.6%). Yavapai, Navajo, Greenlee, and Cochise have the second-highest rates of 15.3 to 19.2%. Pima, Pinal, Graham, and Apache have rates of 13.1 to 15.2%. Santa Cruz, Yuma, Maricopa, and Coconino have the lowest rates, 10.9 to 13.0%.
Map produced July 2019 based on 2013-2017 American Community Survey data.
- Click on the map for a larger, downloadable version.
- To browse or download the data used to make this map, use our Disability Data Lookup Tool.
- For information on how biological sex is used and defined in the ACS, see “American Community Survey and Puerto Rico Community Survey 2017 Subject Definitions” page 125.
-
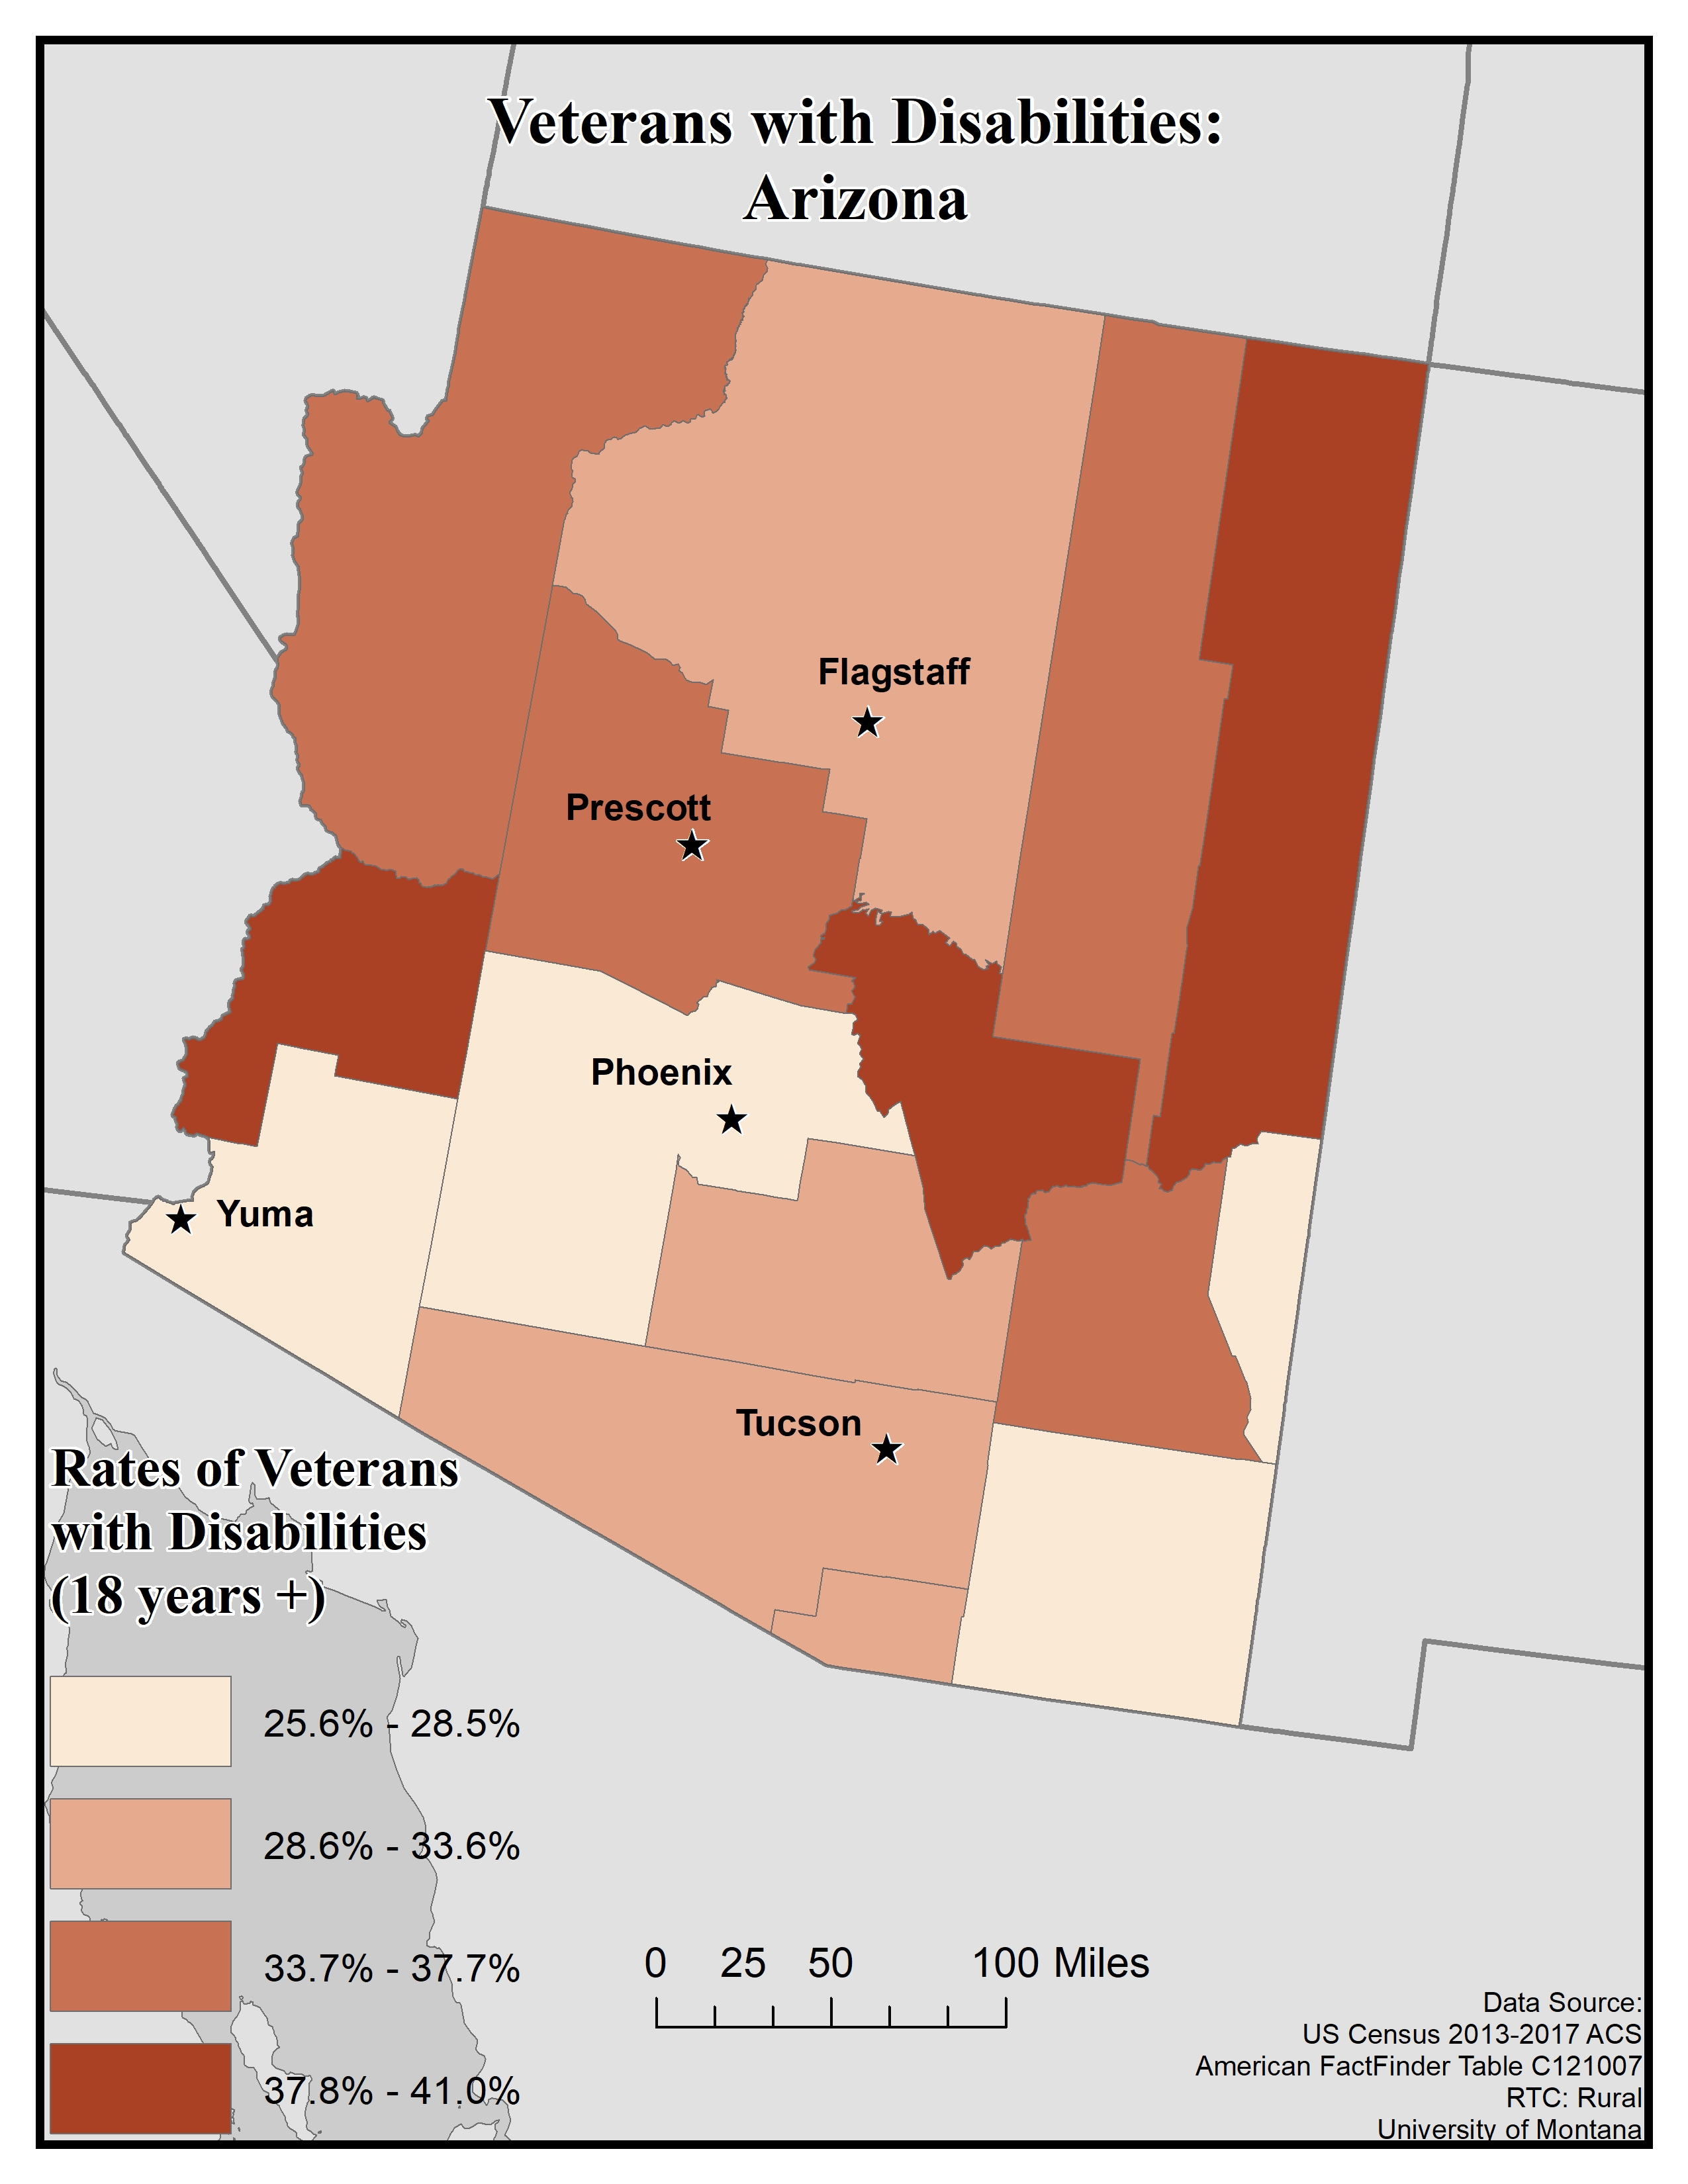
 This map of the state of Arizona shows rates of disability among veterans aged 18 and older by county. Rates are broken into four categories:
The five largest urban areas (Yuma, Phoenix, Prescott, Flagstaff, and Tucson) are labeled to show if there are any differences in urban vs rural areas. Overall, rates of disability among veterans re higher in rural counties than urban ones, though rates are varied across the state. There seem to be more veterans with disabilities in the northern half of the state than the southern half. Phoenix and Yuma are in counties with the lowest rates, of 25.6 to 28.5%. Tucson and Flagstaff are in counties with the second-lowest rates, of 28.6 to 33.6%, and Prescott is in a county with the second-highest rate, of 33.7 to 37.7%.
Map produced November 2019 based on 2013-2017 American Community Survey data.
- Click on the map for a larger, downloadable version.
- To browse or download the data used to make this map, use our Disability Data Lookup Tool.
-
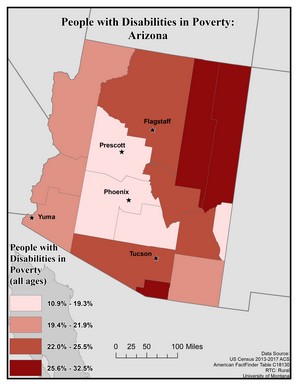
This map of the state of Arizona shows poverty rates among people with disabilities by county. The data includes people of all ages. Poverty rates are broken into four levels: 10.9 to 19.3%, 19.4 to 21.9%, 22.0 to 25.5%, and 25.6 to 32.5%.
The counties with the highest rates of people with disabilities in poverty (25.6 to 32.5%) are: Santa Cruz, Apache, and Navajo. In Coconino, Gila, Graham, and Pima, rates are 22.0 to 25.5%. In Cochise, Yuma, La Paz, and Mohave, rates are 19.4 to 21.9%. In Yavapai, Maricopa, Pinal, and Greenlee, rates are the lowest, at 10.9 to 21.9%.
Poverty rates for people with disabilities tend to be higher in rural counties than in urban ones.
Map produced July 2019 based on 2013-2017 American Community Survey data.
- Click on the map for a larger, downloadable version.
- To browse or download the data used to make this map, use our Disability Data Lookup Tool.


Employment: Arizona
-
This map explores American Community Survey (ACS) 5-year data (Table C18120) employment estimates by disability type.
The ACS asks a set of disability indicator questions to determine disability. If a respondent can answer “yes” to any disability question they are classified as having a disability. The data below are for ages 18-64.
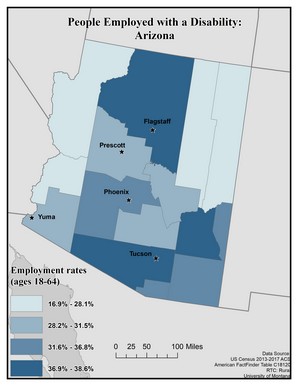
This map of Arizona shows employment rates among people with disabilities. The data includes people ages 18 to 64. Rates are broken into four categories ranging from 16.9 to 38.6%.
The highest rates, from 36.9 to 38.6%, are found in Pima, Graham, and Coconino. Maricopa, Santa Cruz, Cochise, and Greenlee have rates of 31.6 to 36.8%. Yuma, Pinal, Gila, and Yavapai have rates of 28.2 to 31.5%.
The lowest employment rates, of 16.9 to 28.1%, are found in Mohave, La Paz, Navajo, and Apache. These include the more rural counties in the state.
Map produced July 2019 based on 2013-2017 American Community Survey data.
- Click on the map for a larger, downloadable version.
- To browse or download the data used to make this map, use our Disability Data Lookup Tool.
-
This map explores American Community Survey (ACS) 5-year data (Table C18120) employment estimates by disability type.
The ACS asks a set of disability indicator questions to determine disability. If a respondent can answer “yes” to any disability question they are classified as having a disability. The data below are for ages 18-64.
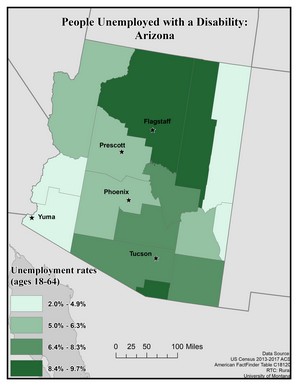
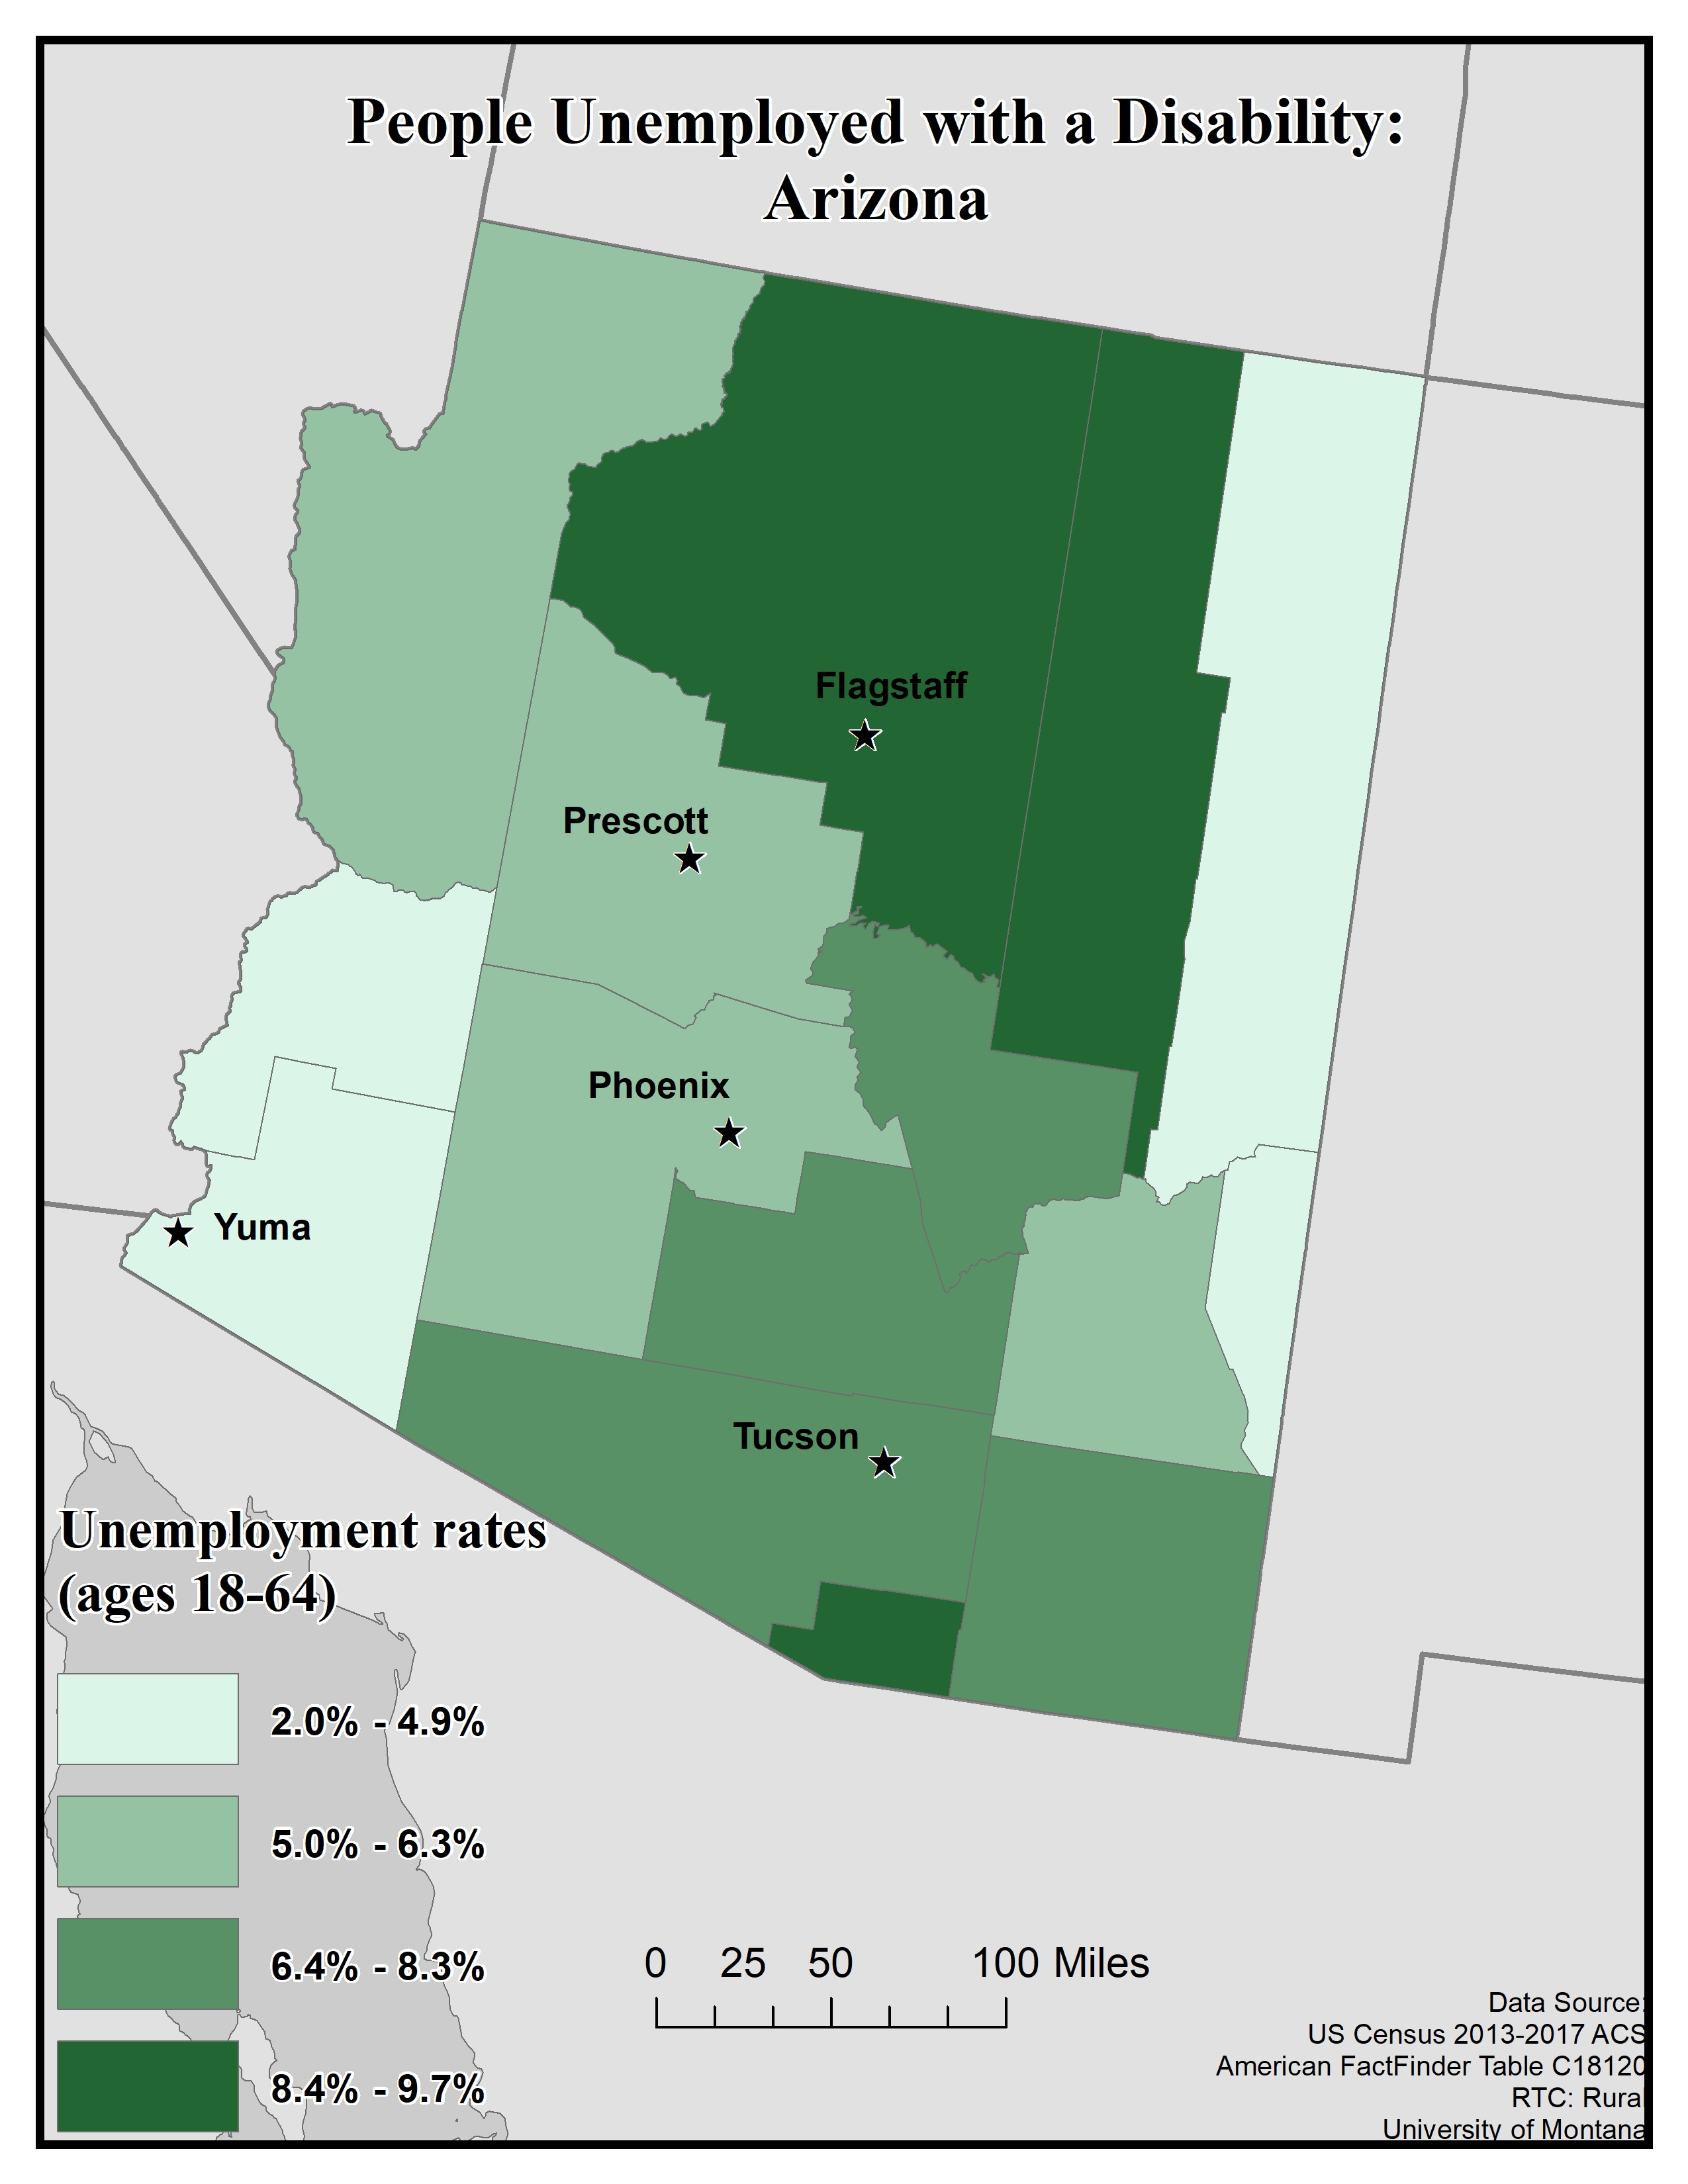
This map of Arizona shows unemployment rates among people with disabilities. The data includes people ages 18 to 64. Rates are broken into four categories ranging from 2.0 to 9.7%.
The highest rates, from 8.4 to 9.7%, are found in Santa Cruz and Coconino. The second-highest rates, of 6.4 to 8.3%, are found in Pima, Cochise, Pinal, and Gila. Rates of 5.0 to 6.3% are found in Graham, Maricopa, Yavapai, and Mohave. The lowest rates, from 2.0 to 4.9%, are found in La Paz, Yuma, Apache, and Greenlee. Many of the counties with the lowest unemployment rates are rural counties: Unemployment rates for people with disabilities in Arizona tend to be higher in metropolitan counties.
Note: It is important to consider unemployment rates in addition to out of the labor force rates. This map only shows people with disabilities who are in the labor force.
Map produced July 2019 based on 2013-2017 American Community Survey data.
- Click on the map for a larger, downloadable version.
- To browse or download the data used to make this map, use our Disability Data Lookup Tool.
-
This map explores American Community Survey (ACS) 5-year data (Table C18120) employment estimates by disability type.
The ACS asks a set of disability indicator questions to determine disability. If a respondent can answer “yes” to any disability question they are classified as having a disability. The data below are for ages 18-64.
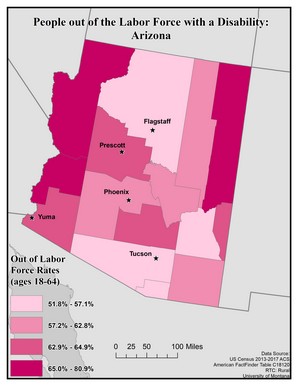
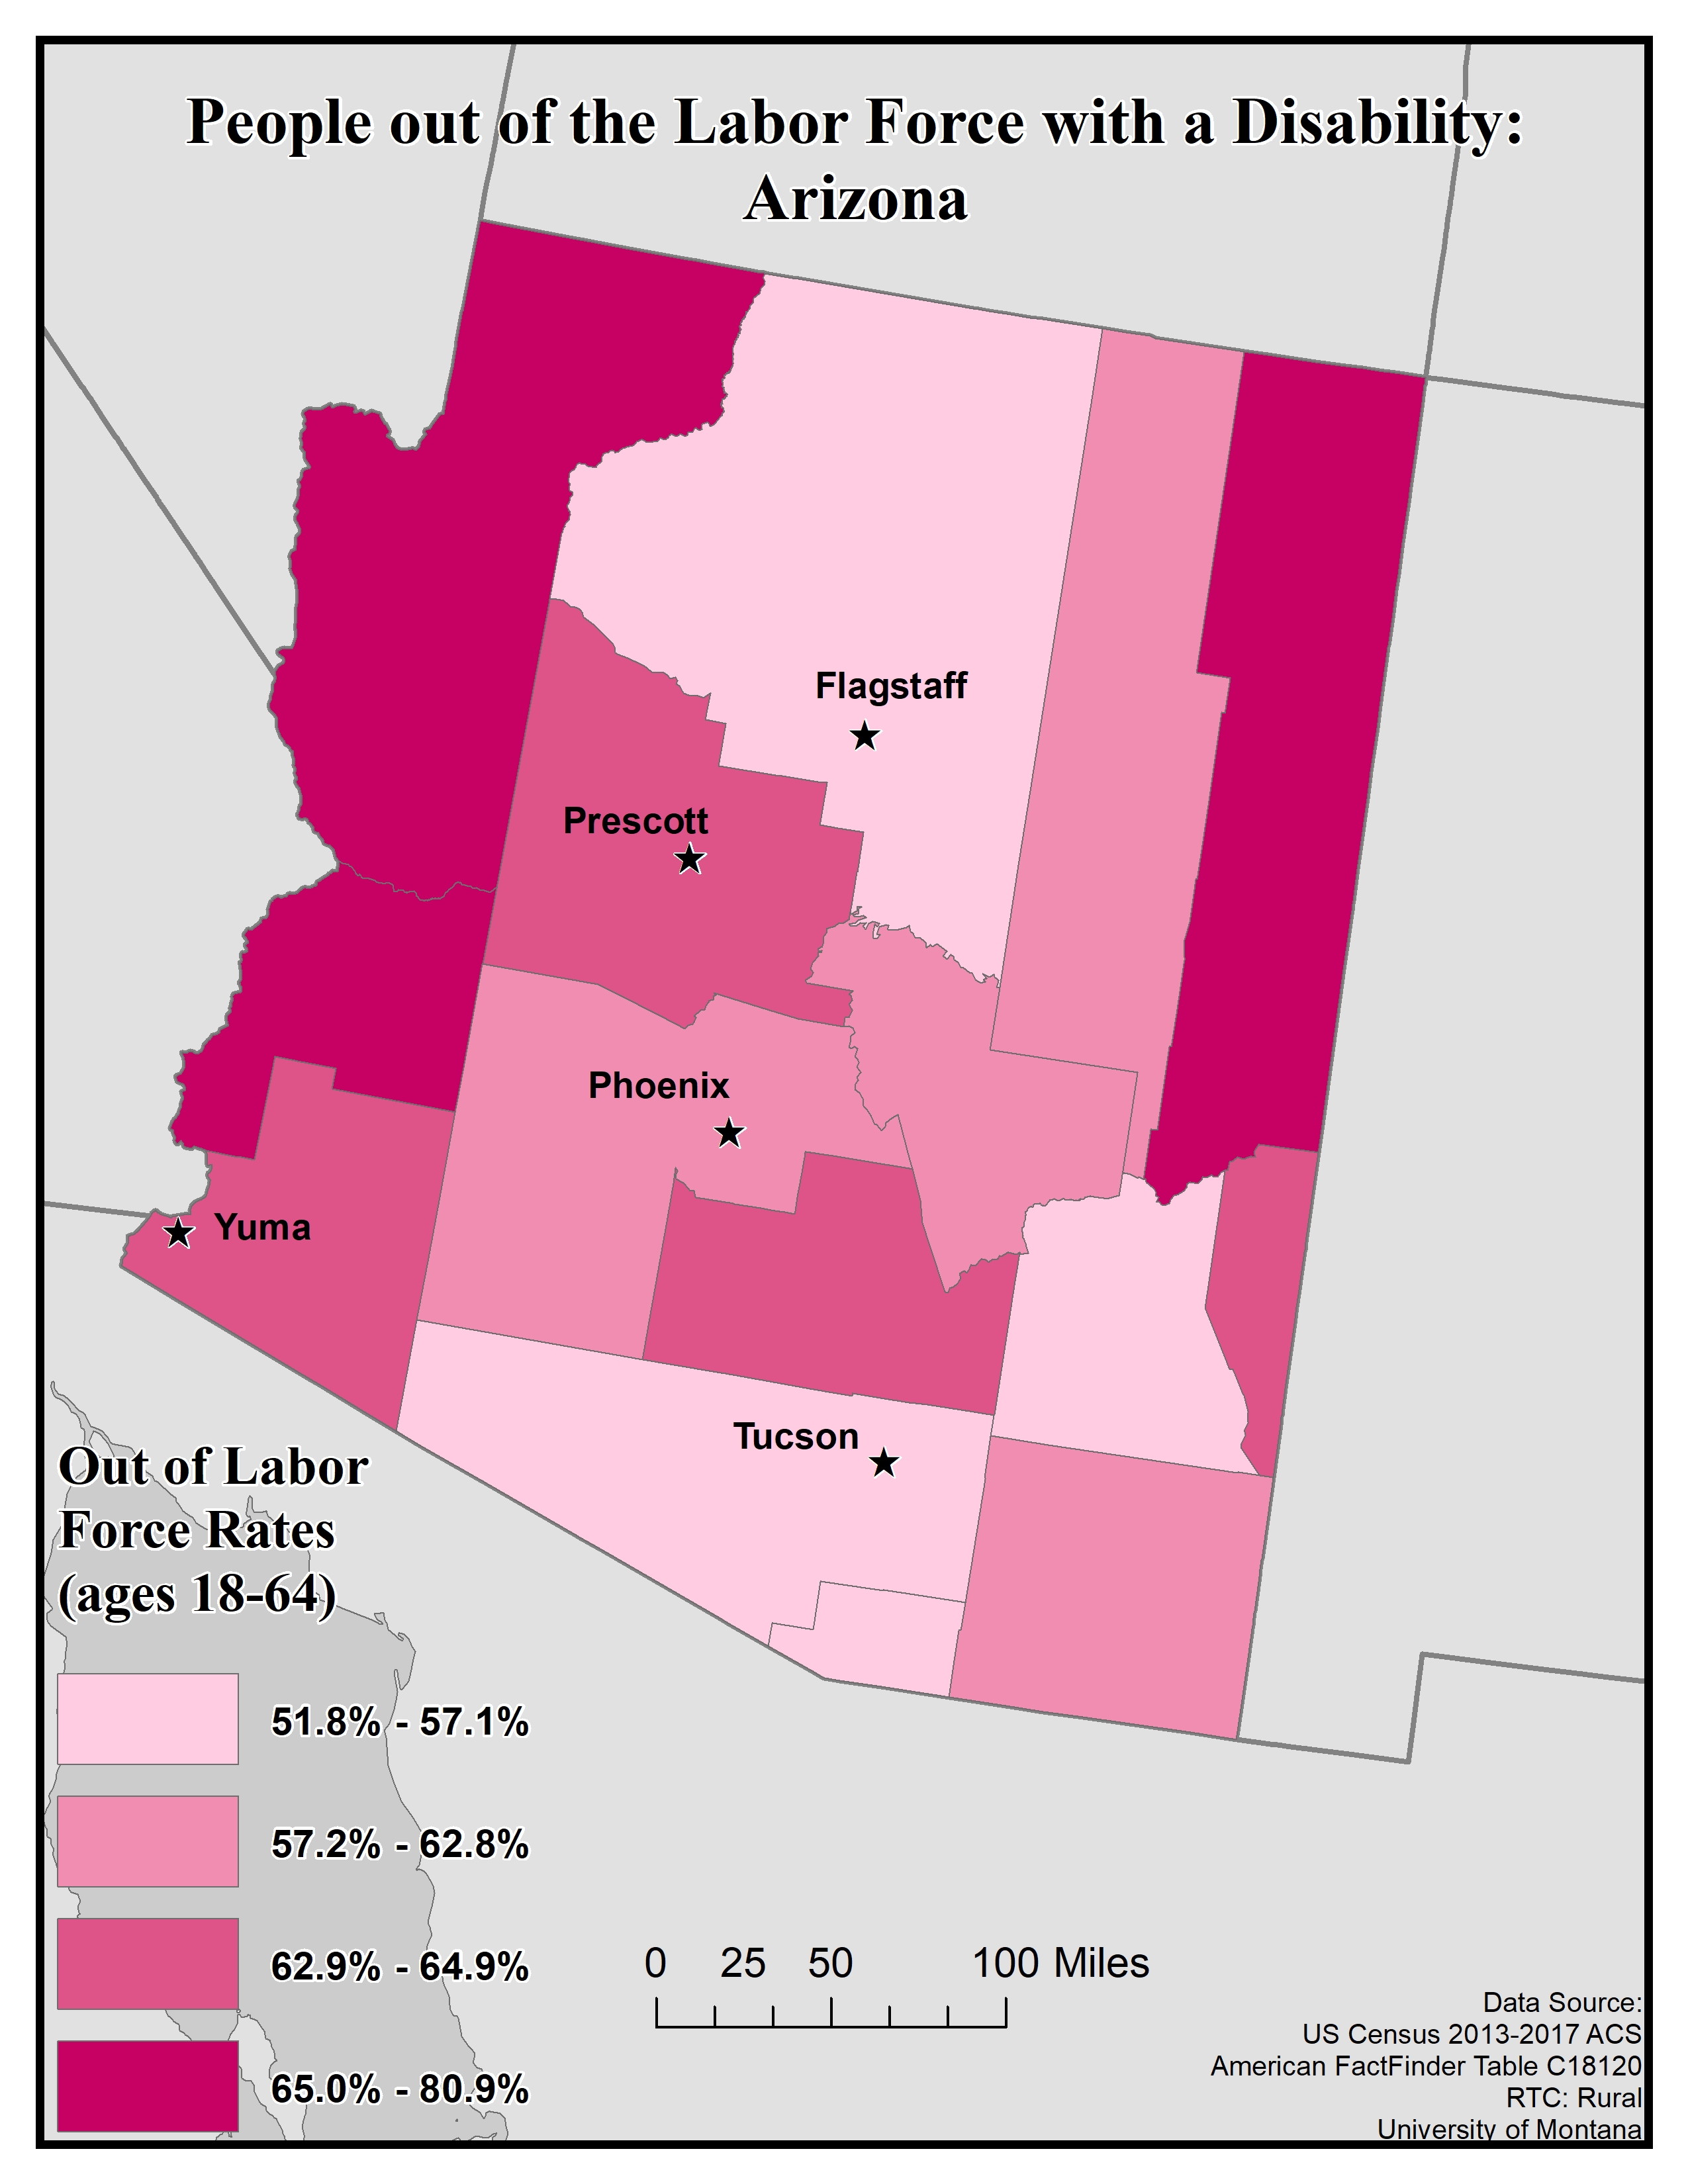
This map of Arizona shows rates of people with disabilities who are out of the labor force, by county. The data includes people ages 18 to 64. Rates are broken into four categories ranging from 51.8 to 80.9%.
The highest rates, of 65.0 to 80.9%, are found in Mohave, La Paz, and Apache.
Rates of 62.9 to 64.9% are found in Yuma, Pinal, Yavapai, and Greenlee. Rates of 57.2 to 62.8% are found in Cochise, Maricopa, Gila, and Navajo.
The lowest rates, of 51.8 to 57.1%, are found in Coconino, Graham, Pima, and Santa Cruz. Rates tend to be higher in more rural areas.
Map produced July 2019 based on 2013-2017 American Community Survey data.
- Click on the map for a larger, downloadable version.
- To browse or download the data used to make this map, use our Disability Data Lookup Tool.

Disability Rates by Functional Limitation: Arizona
-
This map explores the American Community Survey (ACS) 5-year data (Table S1810) on disability estimates by county.
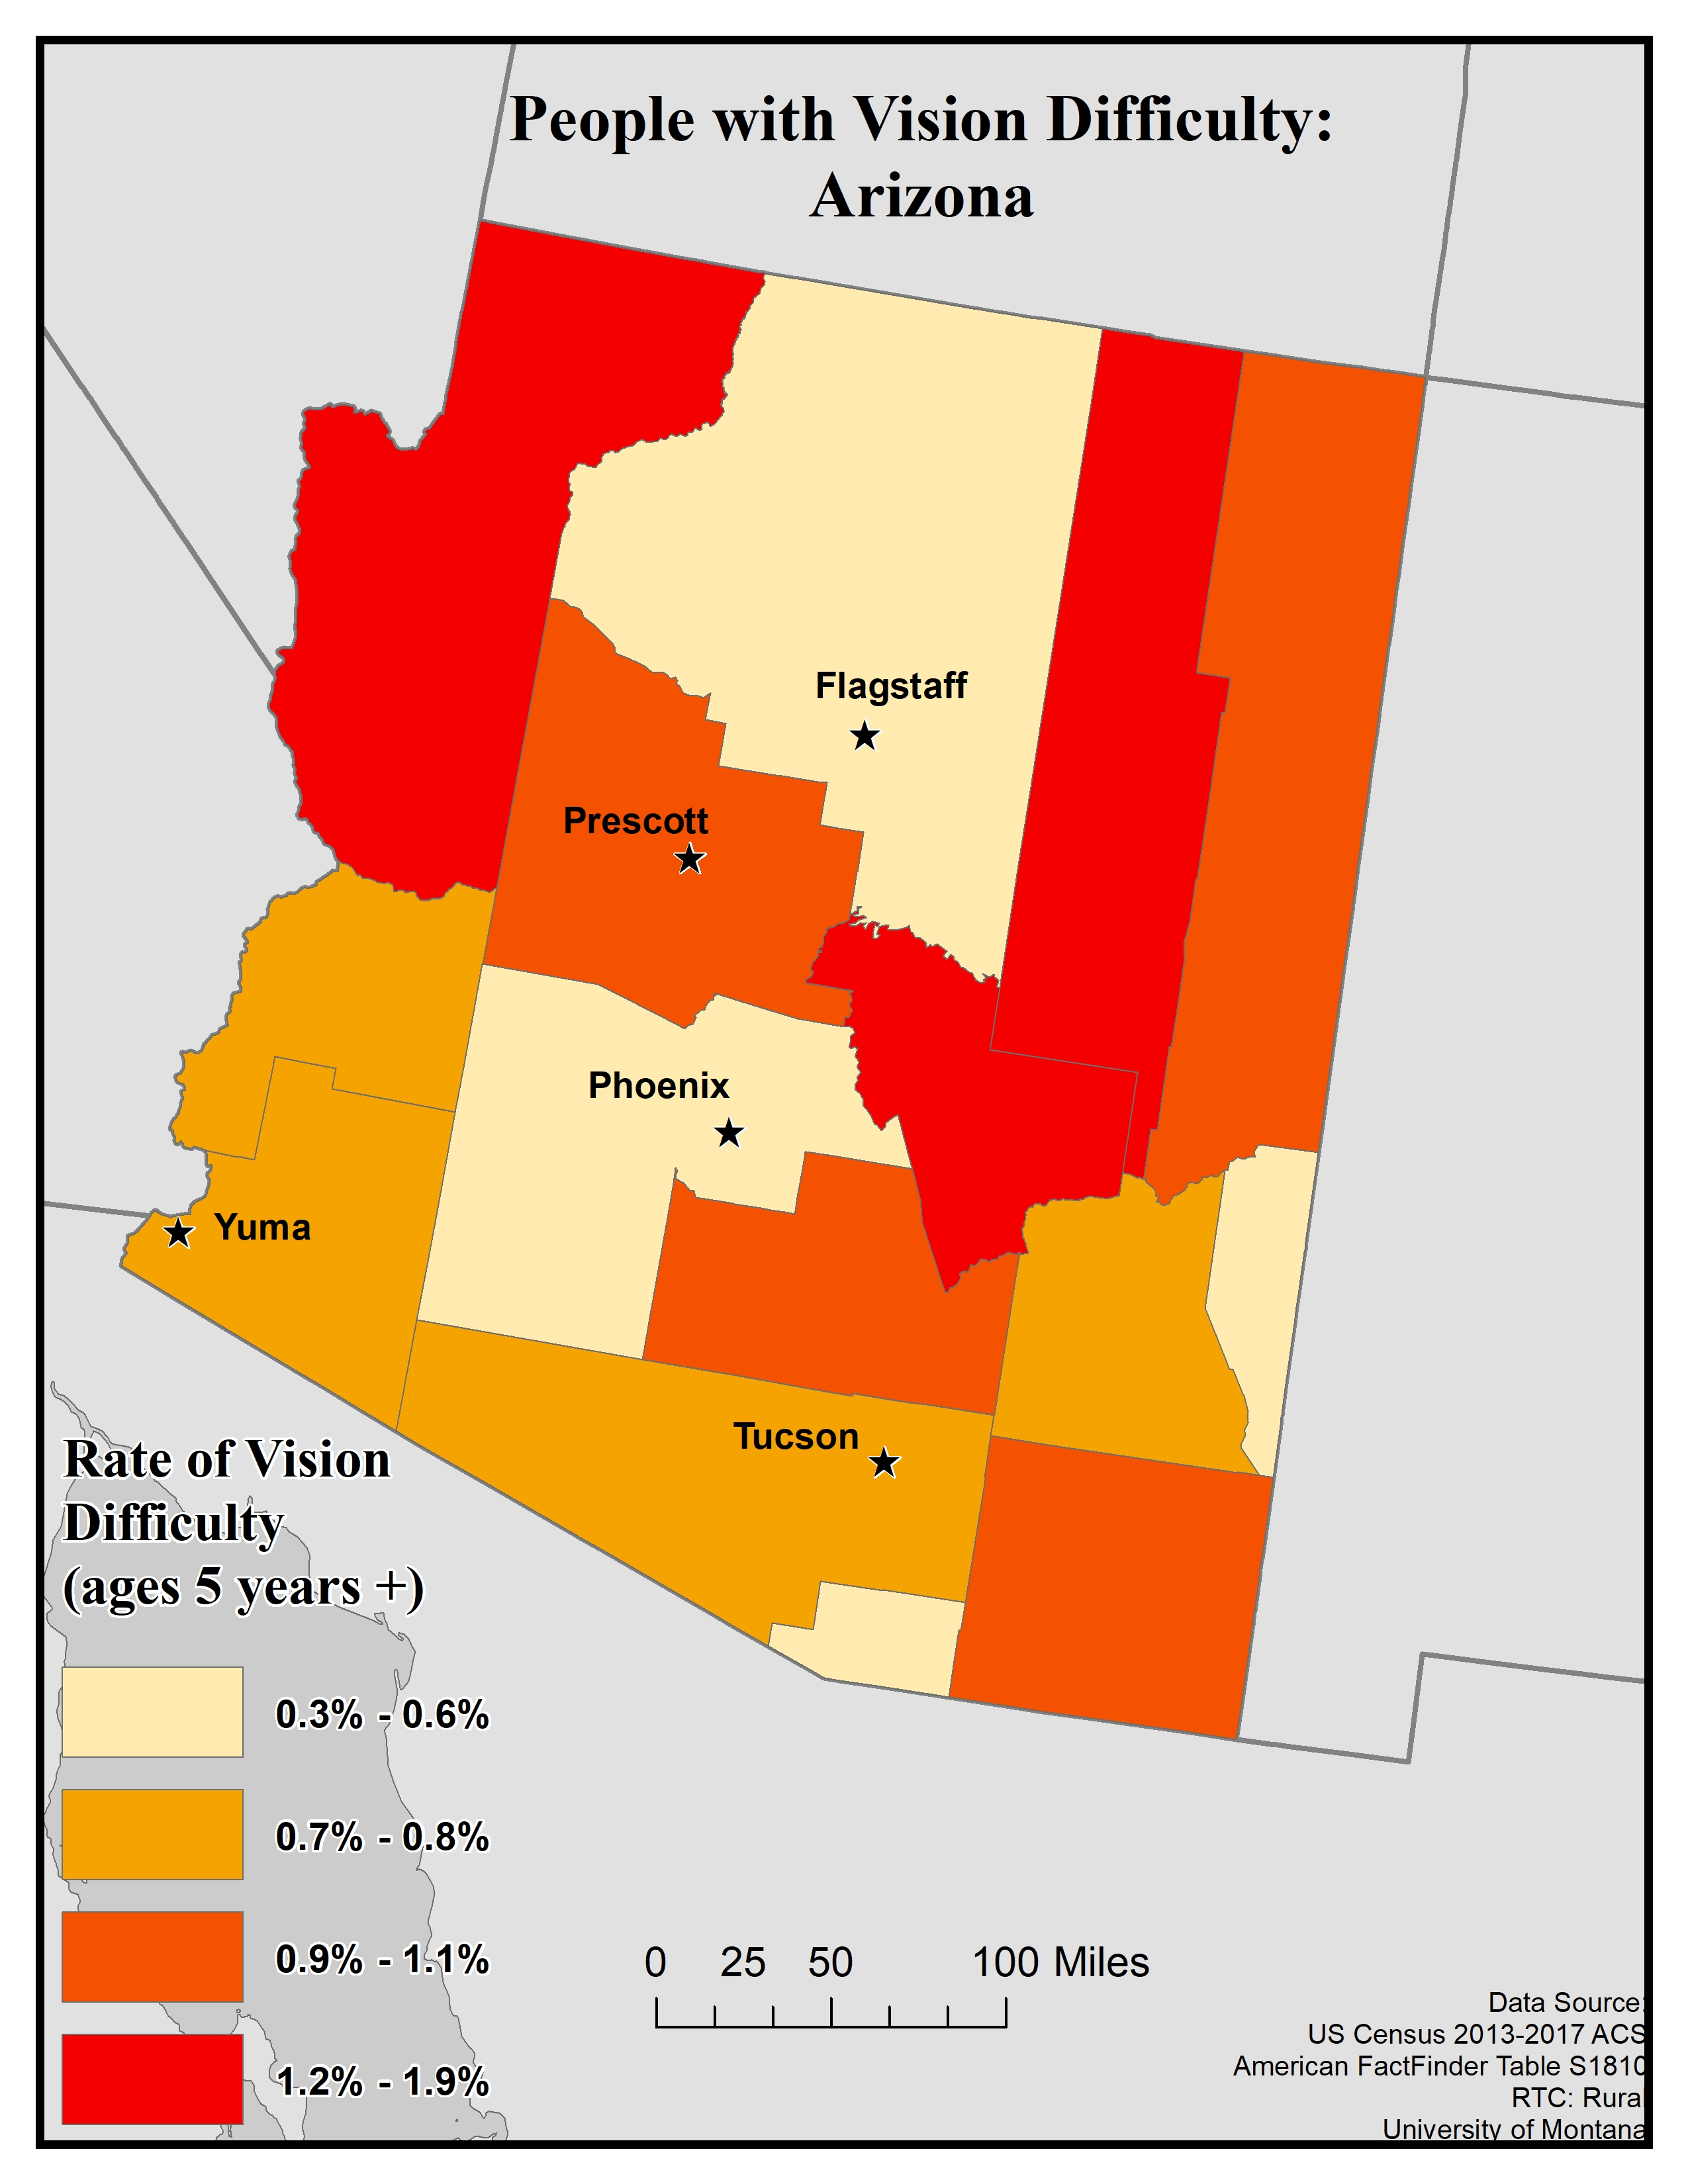
For vision difficulty the ACS asks if a respondent is blind or has serious difficulty seeing, even when wearing glasses. If they answer “yes” they are classified as having a vision difficulty. This data is for all ages.

This map of the state of Arizona shows rates of vision difficulty for ages 5 years and older by county. Rates are broken into four categories: 0.3 to 0.6%, 0.7 to 0.8%, 0.9 to 1.1% and 1.2 to 1.9%.
Three of the 15 counties in Arizona have the highest rates, of 1.2 to 1.9%. These are: Mohave, Gila, and Navajo.
Cochise, Apache, and Yavapai have the second-highest rates, of 0.9 to 1.1%.
La Paz, Yuma, Pima, and Graham have rates of 0.7 to 0.8%, and Coconino, Maricopa, Santa Cruz, and Creenlee have the lowest rates, of 0.3 to 0.6%.
Map produced July 2019 based on 2013-2017 American Community Survey data.
- Click on the map for a larger, downloadable version.
- To browse or download the data used to make this map, use our Disability Data Lookup Tool.
-
This map explores the American Community Survey (ACS) 5-year data (Table S1810) on disability estimates by county.
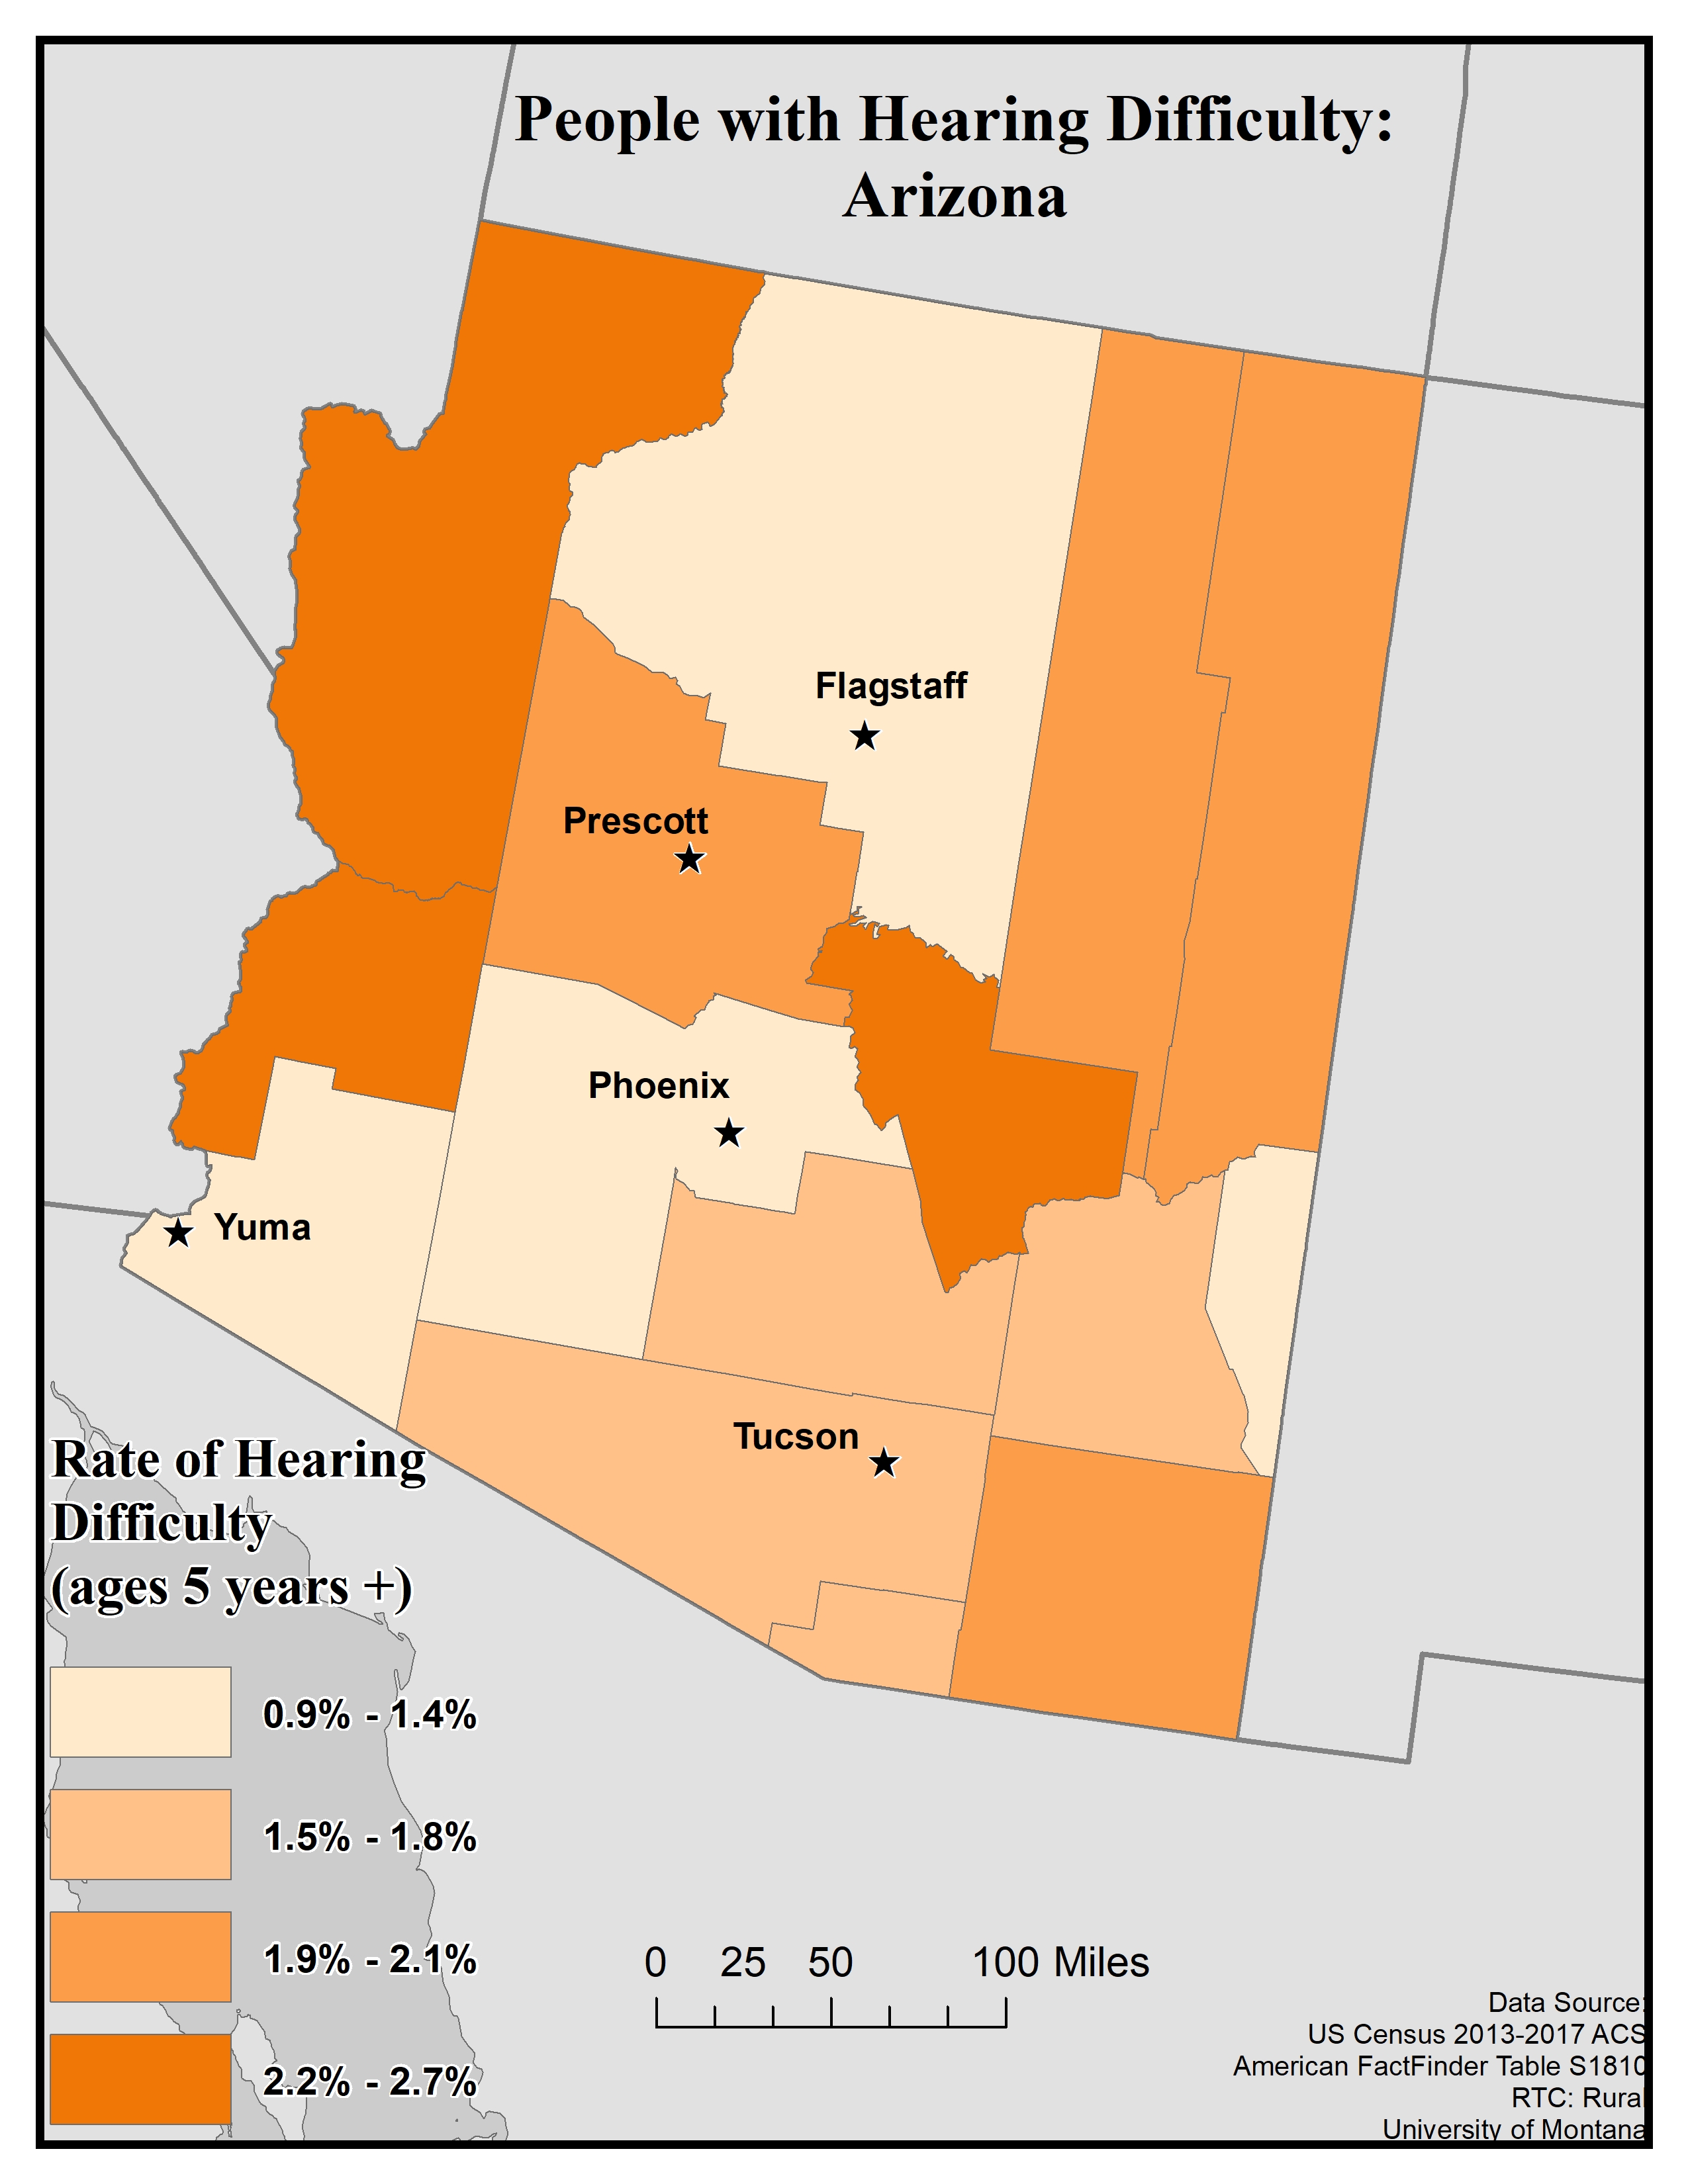
For hearing difficulty the ACS asks if a respondent is deaf or has serious difficulty hearing. If they answer “yes” they are classified as having a hearing difficulty. This data is for all ages.
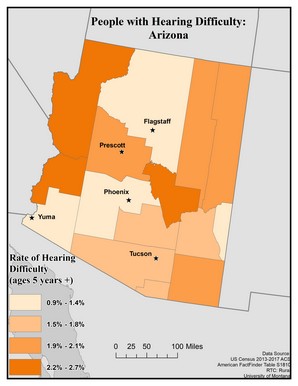
This map of the state of Arizona shows rates of hearing difficulty for ages 5 years and older by county. Rates are broken into four categories: 0.9 to 1.4%, 1.5 to 1.8%, 1.9 to 2.1%, and 2.2 to 2.7%.
Three of the 15 counties in Arizona have the highest rates, of 2.2 to 2.7%. These are: Mohave, La Paz, and Gila.
Yavapai, Cochise, Navajo, and Apache have the second-highest rates, of 1.9 to 2.1%.
Santa Cruz, Pima, Pinal, and Graham have rates of 1.5 to 1.8%.
Yuma, Maricopa, Coconino, and Greenlee have the lowest rates, of 0.9 to 1.4%.
Map produced July 2019 based on 2013-2017 American Community Survey data.
- Click on the map for a larger, downloadable version.
- To browse or download the data used to make this map, use our Disability Data Lookup Tool.
-
This map explores the American Community Survey (ACS) 5-year data (Table S1810) on disability estimates by county.
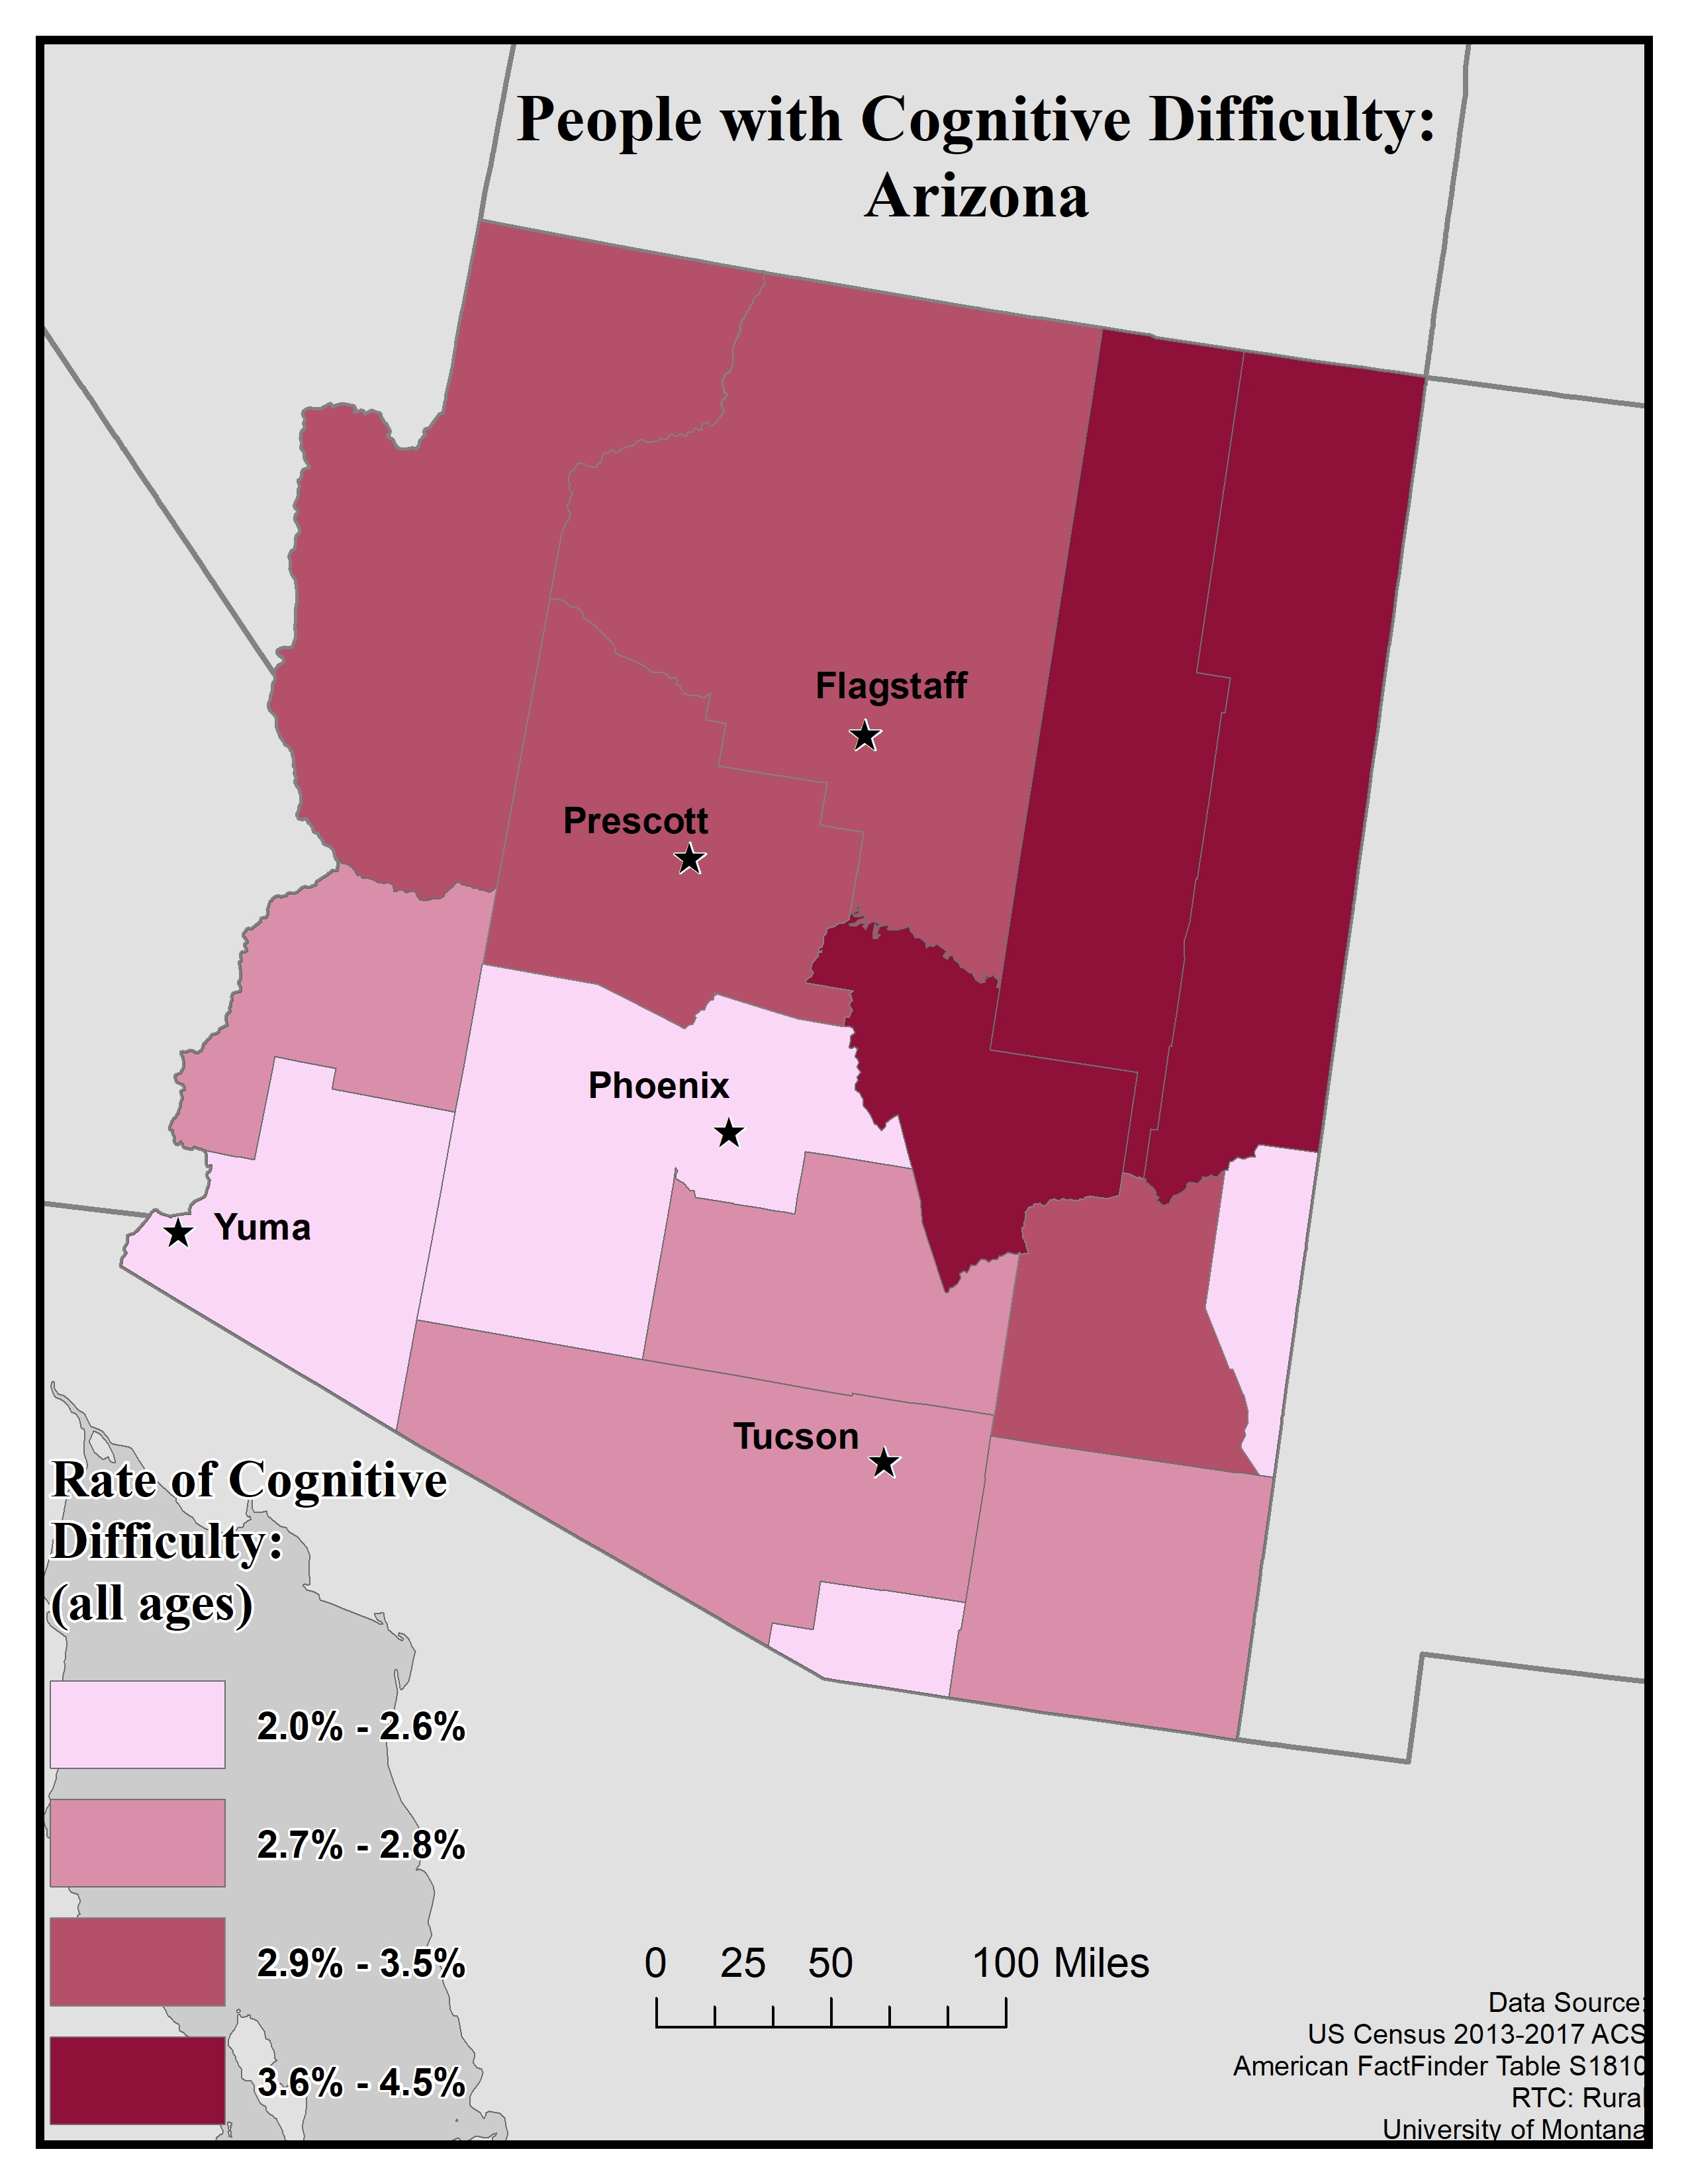
For cognitive difficulty the ACS asks because of a physical, mental, or emotional problem, does the respondent have difficulty remembering, concentrating, or making decisions. If they answer “yes” they are classified as having a cognitive difficulty. This data is for ages 5 and up.
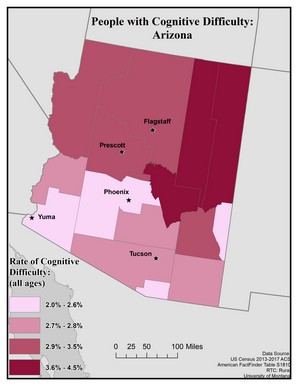
This map of the state of Arizona shows rates of cognitive difficulty for all ages by county. Rates are broken into four categories ranging from 2.0 to 4.5%.
The highest rates, of 3.6 to 4.5%, are in Apache, Navajo, and Gila. The second-highest rates, of 2.9 to 3.5%, are in Mohave, Yavapai, Coconino, and Graham. La Paz, Pima, Pinal, and Cochise have rates of 2.7 to 2.8%. The lowest rates, of 2.0 to 2.6%, are in Yuma, Maricopa, Santa Cruz, and Greenlee.
Rates tend to be higher in the northern half of the state than the southern half, and are higher in rural counties than urban ones.
Map produced July 2019 based on 2013-2017 American Community Survey data.
- Click on the map for a larger, downloadable version.
- To browse or download the data used to make this map, use our Disability Data Lookup Tool.
-
This map explores the American Community Survey (ACS) 5-year data (Table S1810) on disability estimates by county.
For ambulatory (i.e. mobility) difficulty the ACS asks if a respondent has serious difficulty walking or climbing stairs. If they answer “yes” they are classified as having a mobility difficulty. This data is for ages 5 and up.
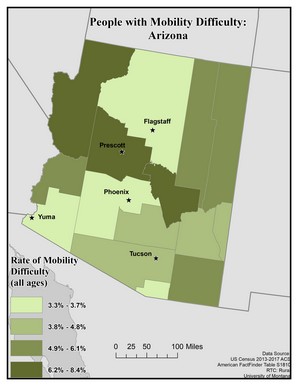 This map of the state of Arizona shows rates of mobility difficulty for all ages by county. Rates are broken into four categories ranging from 3.3 to 8.4%.
The highest rates, of 6.2 to 8.4%, are in Mohave, Yavapai, and Gila. The second-highest rates, of 4.9 to 6.1%, are in La Paz, Cochise, Navajo, and Apache. Pima, Pinal, Graham, and Greenlee have rates of 3.8 to 4.8%.
The lowest rates, of 3.3 to 3.7%, are in Coconino, Maricopa, Yuma, and Santa Cruz.
Map produced July 2019 based on 2013-2017 American Community Survey data.
- Click on the map for a larger, downloadable version.
- To browse or download the data used to make this map, use our Disability Data Lookup Tool.
-
This map explores the American Community Survey (ACS) 5-year data (Table S1810) on disability estimates by county.
For self-care difficulty the ACS asks if a respondent has difficulty bathing or dressing. If they answer “yes” they are classified as having a self-care difficulty. This data is for ages 5 and up.
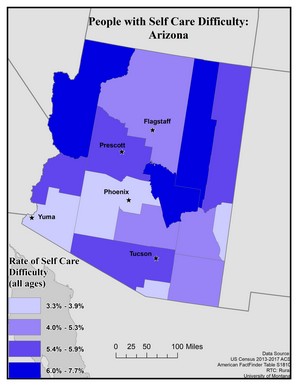
This map of the state of Arizona shows rates of self care difficulty for all ages by county. Rates are broken into four categories ranging from 3.3 to 7.7%.
The highest rates, of 6.0 to 7.7%, are in Mohave, Navajo, and Gila.
The second-highest rates, of 5.4 to 5.9%, are in La Paz, Yavapai, and Pima. Cochise, Graham, Pinal, and Cocoino have rates of 4.0 to 5.3%.
The lowest rates, of 3.3 to 3.9%, are in Yuma, Maricopa, Santa Cruz, and Greenlee.
Map produced July 2019 based on 2013-2017 American Community Survey data.
- Click on the map for a larger, downloadable version.
- To browse or download the data used to make this map, use our Disability Data Lookup Tool.
-
This map explores the American Community Survey (ACS) 5-year data (Table S1810) on disability estimates by county.
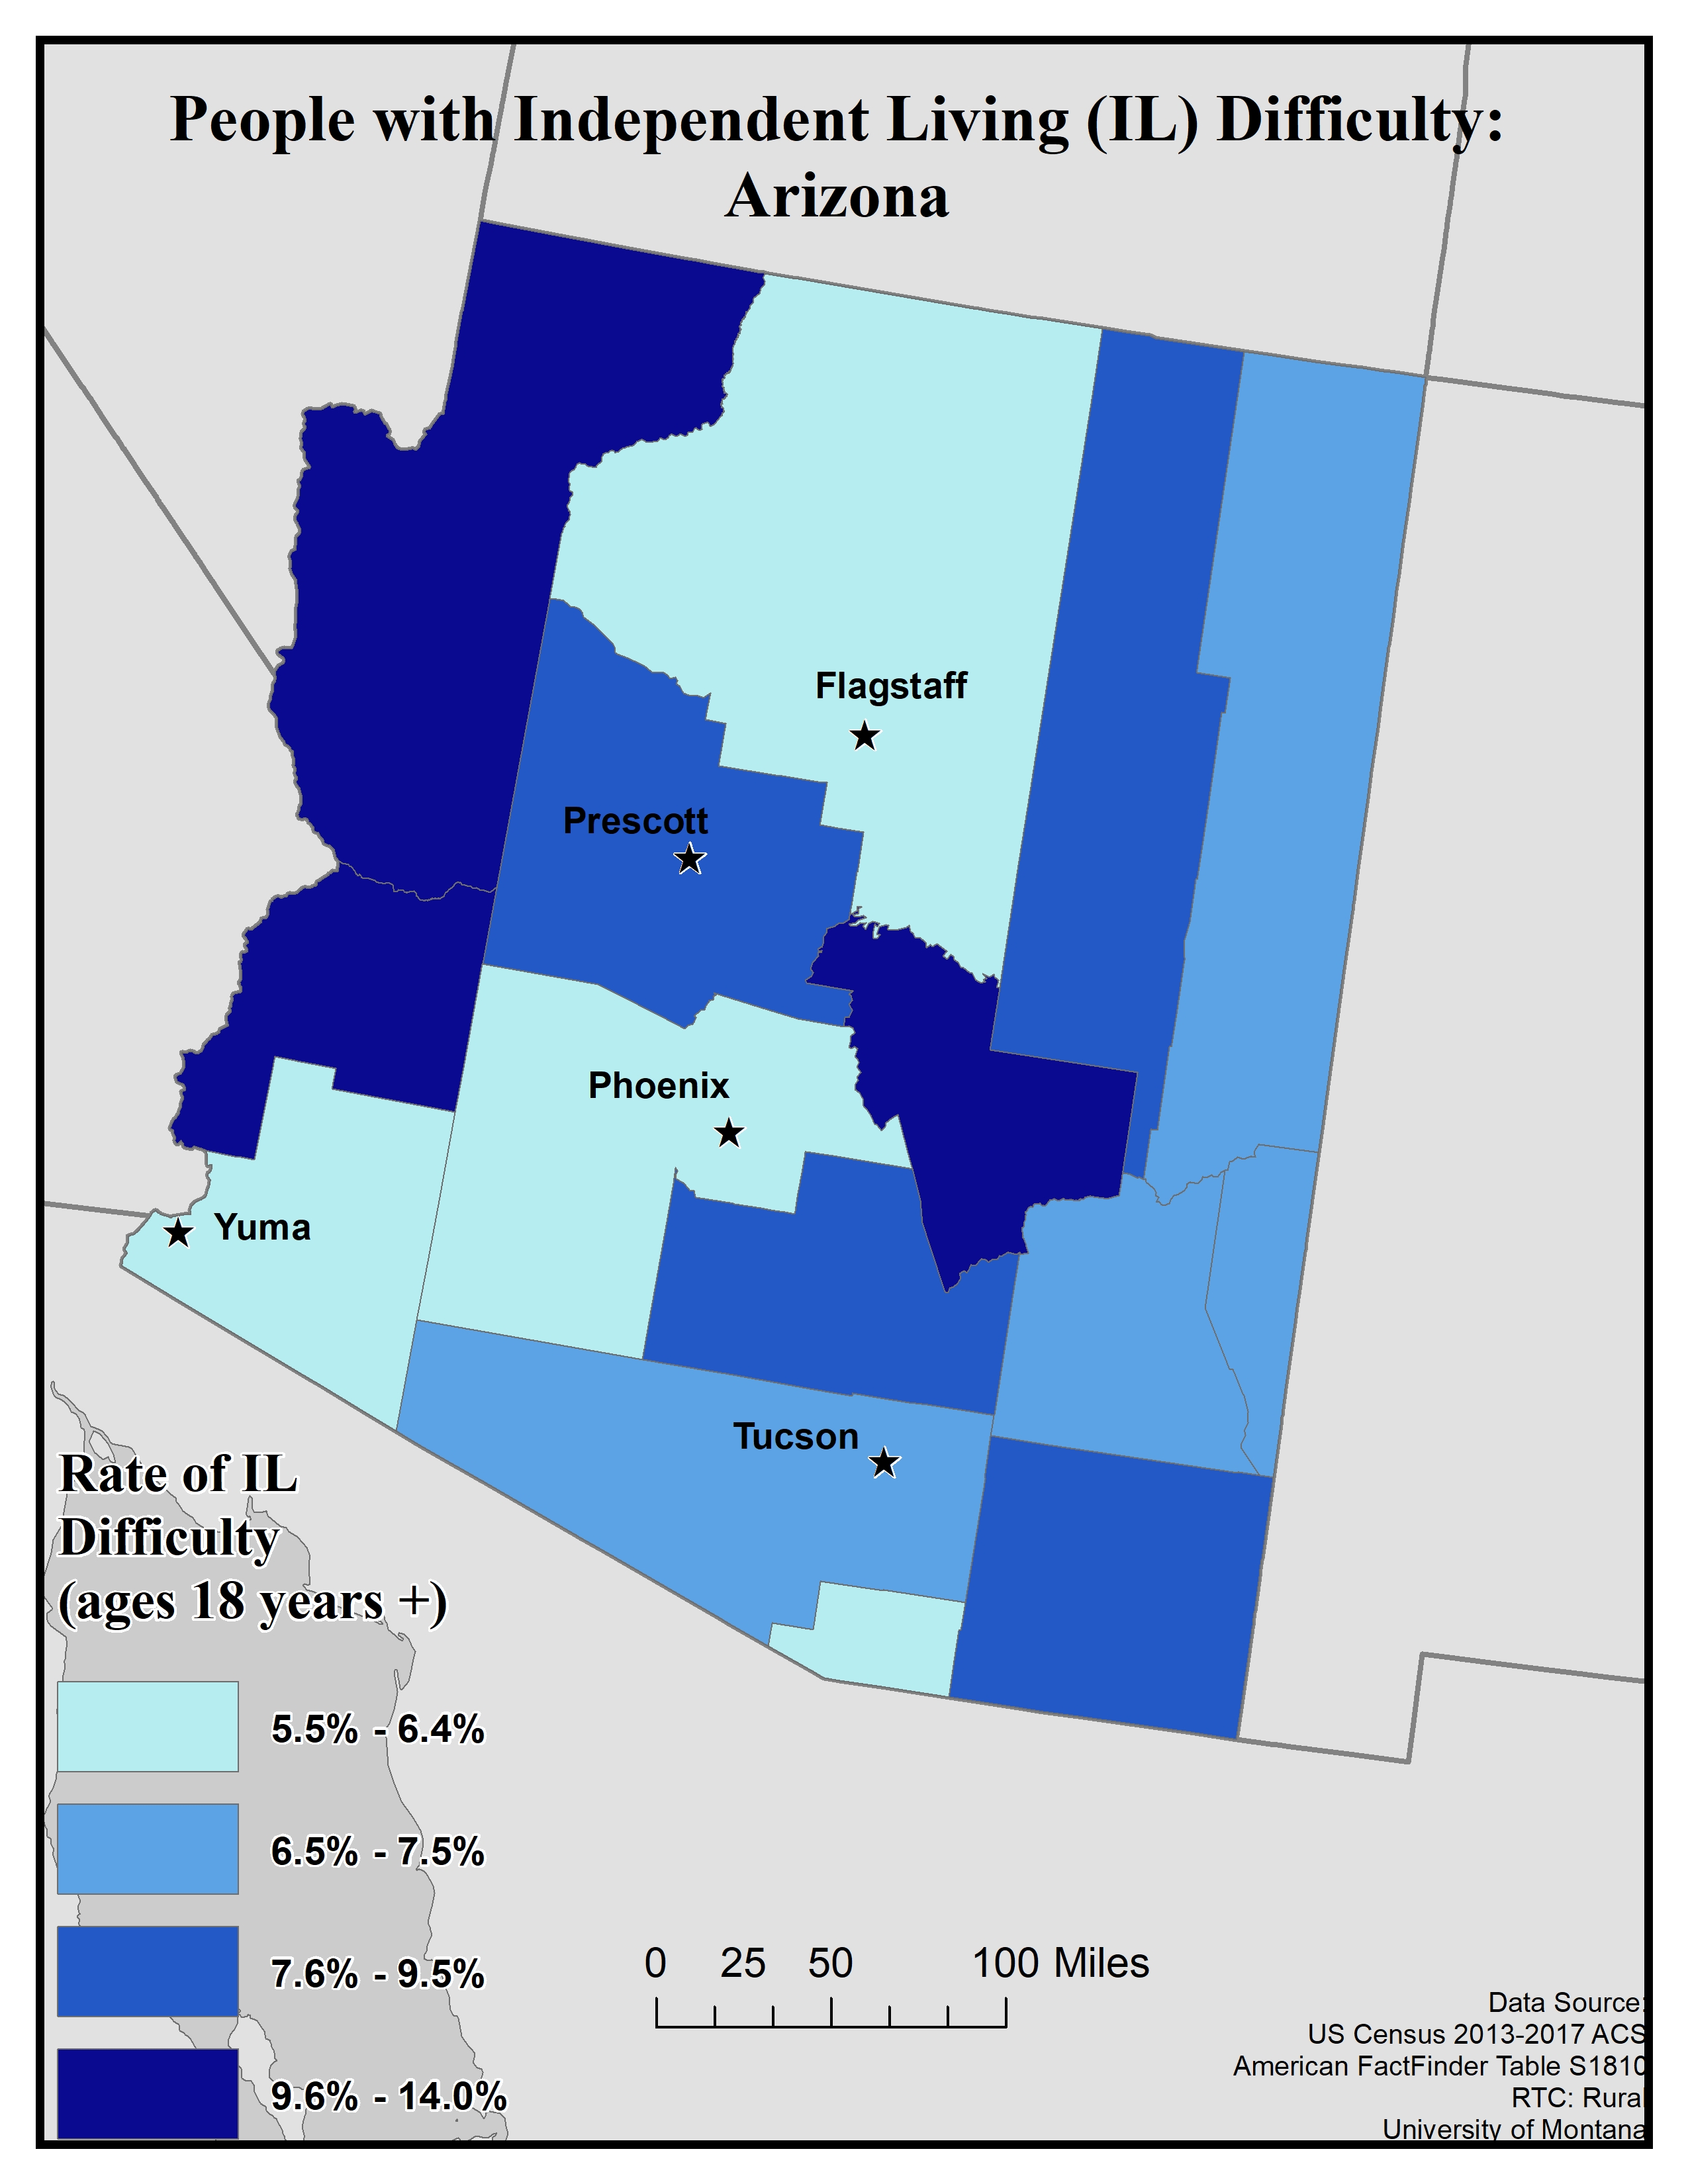
For independent living difficulty the ACS asks because of a physical, mental, or emotional problem, does the respondent have difficulty doing errands alone such as visiting a doctor’s office or shopping. If they answer “yes” they are classified as having an independent living difficulty. This data is for ages 18 and up.
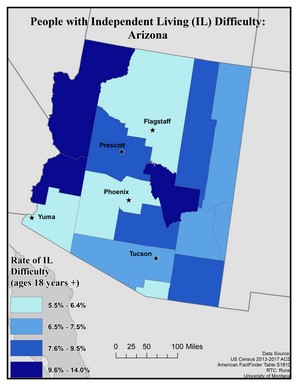
This map of the state of Arizona shows rates of hearing difficulty for ages 18 years and older by county. Rates are broken into four categories: 5.5 to 6.4%, 6.5 to 7.5%, 7.6 to 9.5%, and 9.6 to 14.0%.
Three of the 15 counties in Arizona have the highest rates, of 9.6 to 14.0%. These are: Mohave, La Paz, and Gila.
Yavapai, Pinal, Navajo, and Cochise have rates of 7.6 to 9.5%. Pima, Graham, Greenlee, and Apache have rates of 6.5 to 7.5%.
Yuma, Maricopa, Coconino, and Santa Cruz have the lowest rates, of 5.5 to 6.5%.
Map produced July 2019 based on 2013-2017 American Community Survey data.
- Click on the map for a larger, downloadable version.
- To browse or download the data used to make this map, use our Disability Data Lookup Tool.