The maps on this page explore the American Community Survey 5-year data (Table S1810) on disability by county.
The ACS does not directly measure disability. Instead, it uses a set of disability indicator questions related to difficulty and functional impairment to identify individuals who may experience a disability. If a respondent can answer “yes” to any disability question they are classified as having a disability.
Disability Rates: Texas
-
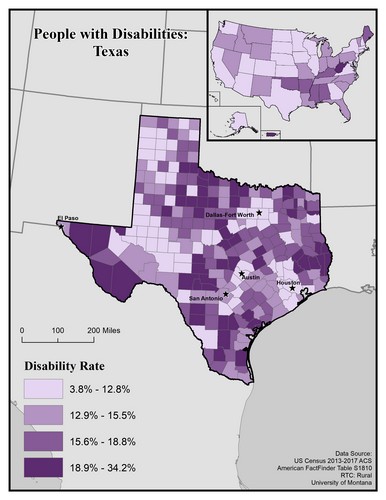
This map of Texas shows general rates of disability across the state at the county level. Disability rates are broken into four categories, from 3.8 to 12.8%.
The five largest urban areas (El Paso, Dallas-Fort Worth, San Antonio, Austin, and Houston) are labeled to show if there are any differences between disability rates in urban vs rural areas. In general, counties with the highest disability rates (18.9 to 34.2%) tend to be rural. Lower rates, of 3.8 to 12.8% and 12.9 to 15.5%, are found around each of the largest urban areas. However, disability rates are fairly scattered across the state, though there are pockets of both highest and lowest rates. There are high rates (18.9 to 34.2%) in the rural counties surrounding El Paso, and a large pocket of the lowest rate (3.8 to 12.8%) just south of the Texas Panhandle region.
In the upper corner of the map is an inset map of the United States showing how overall general disability rates in Texas compare to the rest of the United States. At the state level, disability rates in Texas are in the lowest category.
Map produced September 2019 based on 2013-2017 American Community Survey data.
- Click on the map for a larger, downloadable version.
- To browse or download the data used to make this map, use our Disability Data Lookup Tool.
-
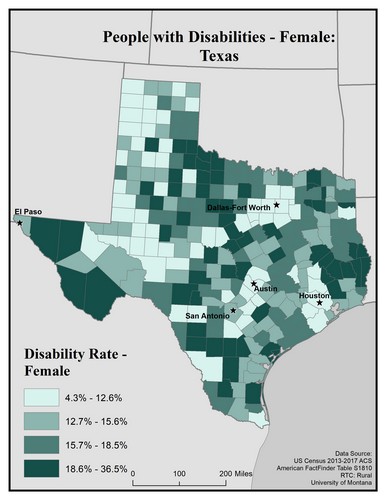
This map of Texas shows disability rates among females by county. Rates are broken into four categories: 4.3 to 12.6%, 12.7 to 15.6%, 15.7 to 18.5%, and 18.6 to 36.5%.
The five largest cities (El Paso, Dallas-Fort Worth, San Antonio, Austin, and Houston) are labeled on the map to show if there are any differences between disability rates in urban vs rural areas. Overall, rates are somewhat varied across the state, but there are generally higher rates of disability in rural counties compared to urban ones. Of the five largest cities, San Antonio and El Paso are in counties with the second lowest rate, while Austin, Houston and Dallas-Fort Worth are in counties with the lowest rate.
The highest rates of disability are in pockets to the far west, far east, and then a semi-contiguous strip that runs north-south through the center of the state.
Map produced February 2020 based on 2013-2017 American Community Survey data.
- Click on the map for a larger, downloadable version.
- To browse or download the data used to make this map, use our Disability Data Lookup Tool.
- For information on how biological sex is used and defined in the ACS, see “American Community Survey and Puerto Rico Community Survey 2017 Subject Definitions” page 125.
-
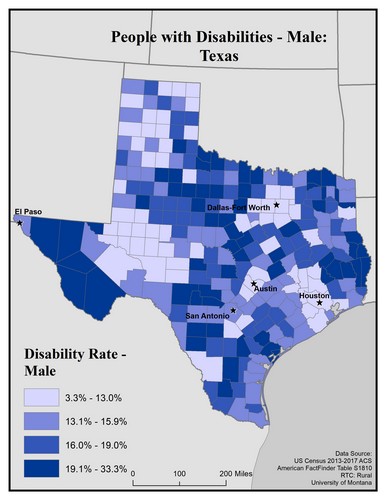
This map of Texas shows disability rates among males by county. Rates are broken into four categories: 3.3 to 13.0%, 13.1 to 15.9%, 16.0 to 19.0%, and 19.1 to 33.5%.
The five largest cities (El Paso, Dallas-Fort Worth, San Antonio, Austin, and Houston) are labeled on the map to show if there are any differences between disability rates in urban vs rural areas. Overall, rates are somewhat varied across the state, but there are generally higher rates of disability in rural counties compared to urban ones. Of the five largest cities, San Antonio and El Paso are in counties with the second lowest rate, while Austin, Houston and Dallas-Fort Worth are in counties with the lowest rate.
The highest rates of disability are in pockets to the far west, far east, and then a semi-contiguous strip that runs north-south through the center of the state.
Map produced February 2020 based on 2013-2017 American Community Survey data.
- Click on the map for a larger, downloadable version.
- To browse or download the data used to make this map, use our Disability Data Lookup Tool.
- For information on how biological sex is used and defined in the ACS, see “American Community Survey and Puerto Rico Community Survey 2017 Subject Definitions” page 125.
-
This map explores the American Community Survey (ACS) 5-year data (Table S1810) on disability estimates.
The ACS asks a set of disability indicator questions to determine disability. If a respondent can answer “yes” to any disability question they are classified as having a disability. The data below are for ages 18 and over.

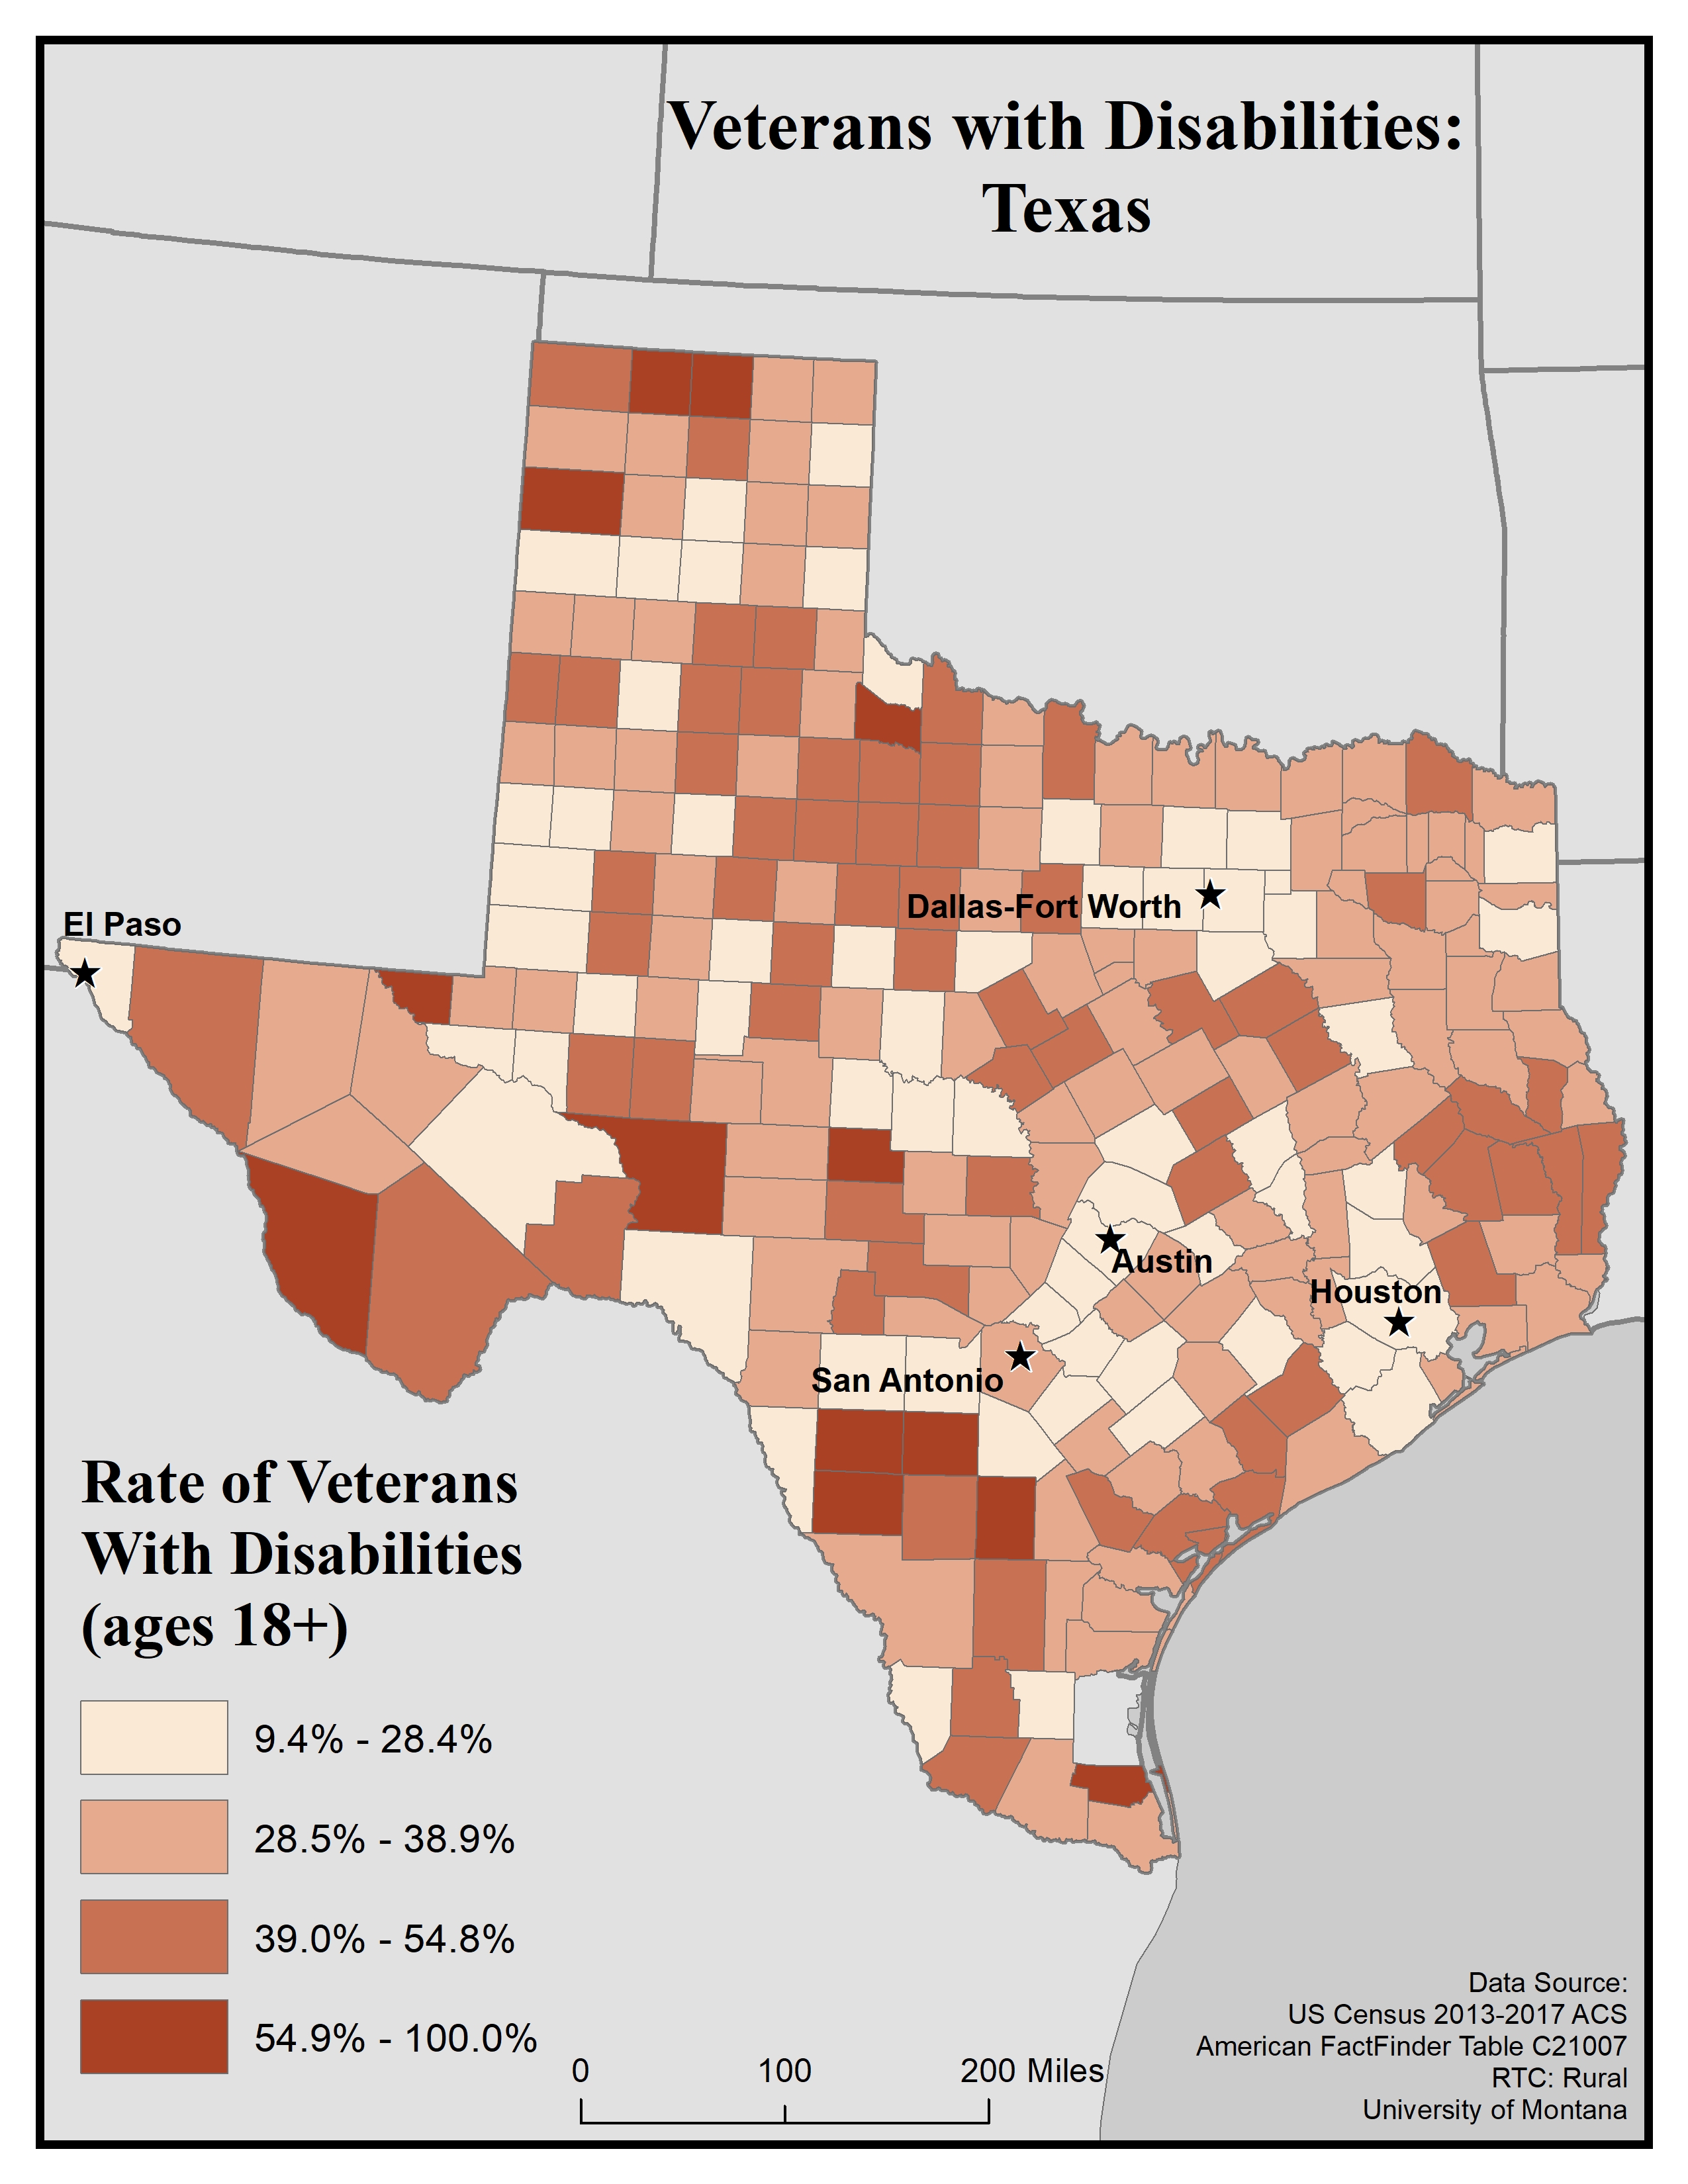
This map of the state of Texas shows rates of veterans with disabilities for ages 18 and older by county. Rates are broken into four categories: 9.4 to 28.4%, 28.5 to 38.9%, 39.0 to 54.8%, and 54.9 to 100%.
The five largest cities (El Paso, Dallas-Fort Worth, San Antonio, Austin, and Houston) are labeled on the map to show if there are any differences between disability rates in urban vs rural areas. Overall, rates are somewhat varied across the state. Some of the counties in the west and south have higher rates.
Of the five largest cities, San Antonio is in a county with the second lowest rate, while Austin, Houston, El Paso, and Dallas-Fort Worth are in counties with the lowest rate.
Map produced February 2020 based on 2013-2017 American Community Survey data.
- Click on the map for a larger, downloadable version.
- To browse or download the data used to make this map, use our Disability Data Lookup Tool.
-
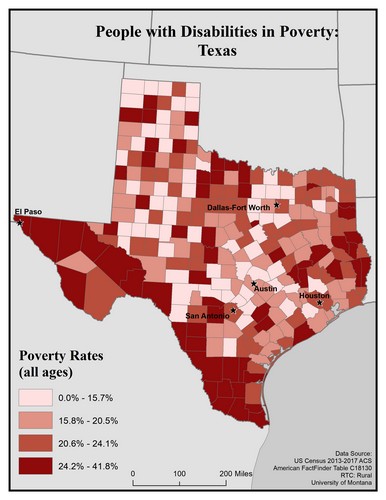
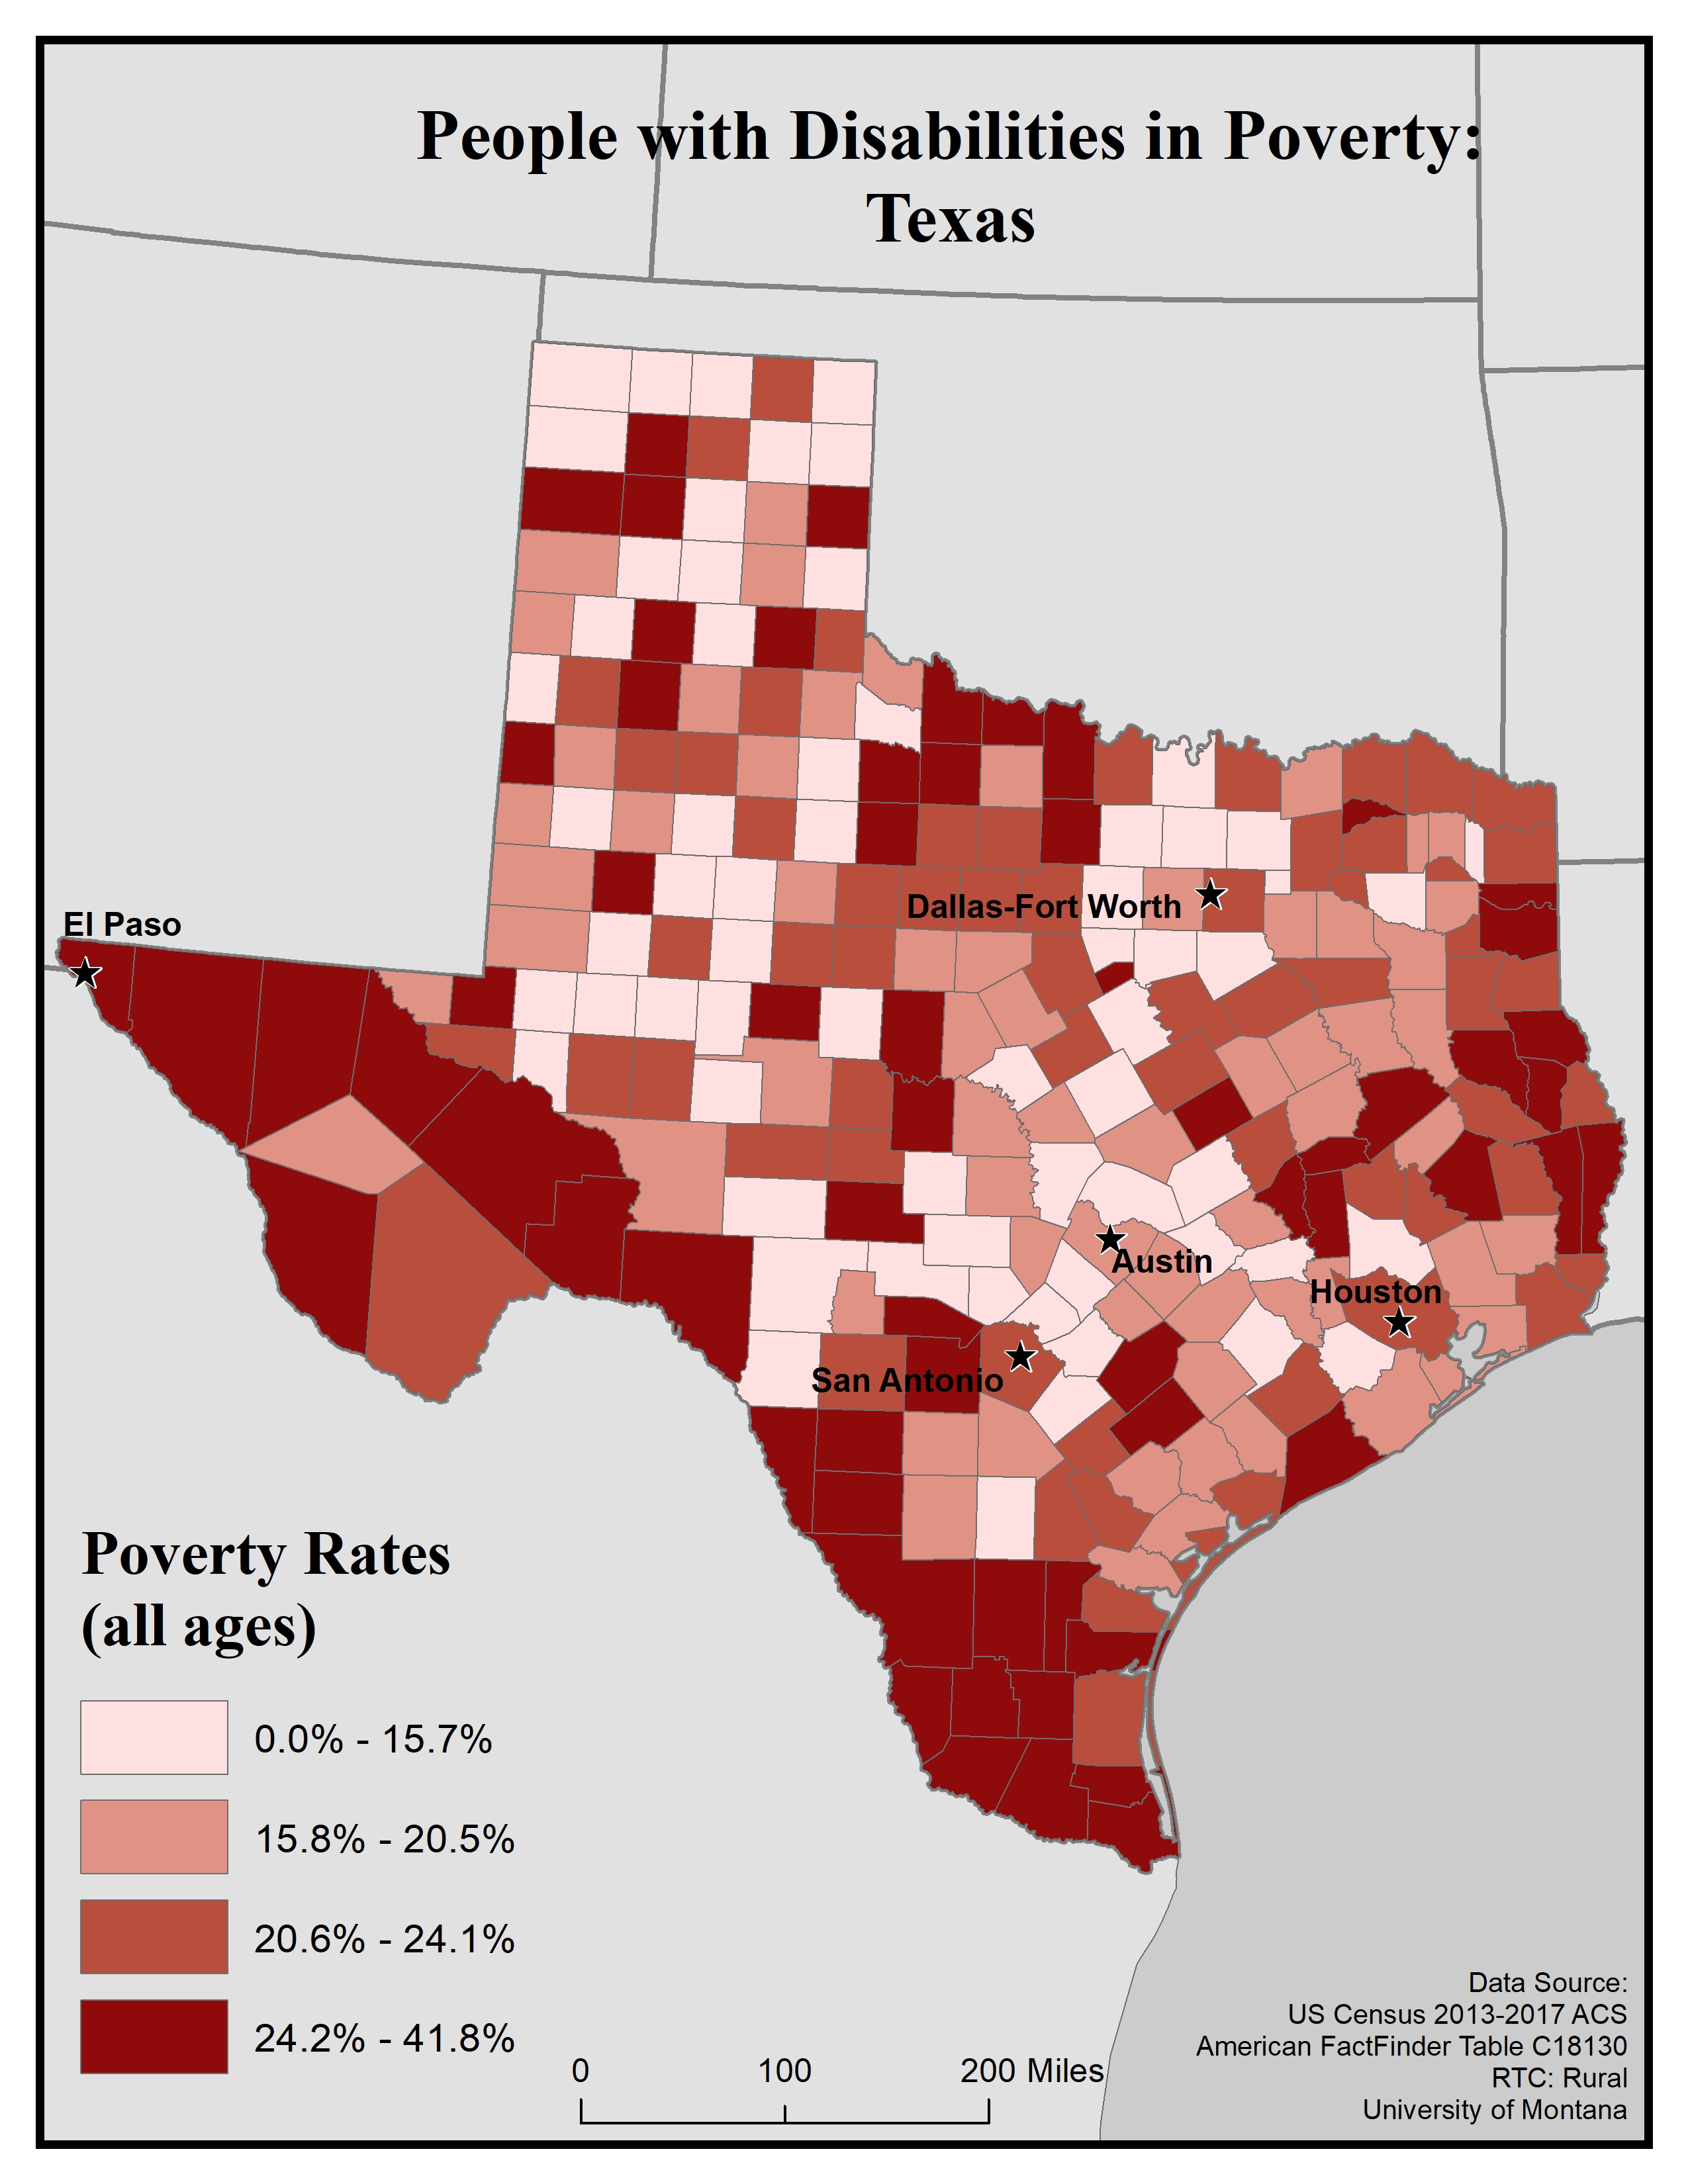
This map of the state of Texas shows poverty rates among people with disabilities ages 18 and older. Rates are broken into four categories: 0.0 to 15.7%, 15.8 to 20.5%, 20.6 to 24.1%, and 24.2 to 41.8%.
The five largest cities (El Paso, Dallas-Fort Worth, San Antonio, Austin, and Houston) are labeled on the map to show if there are any differences between disability rates in urban vs rural areas. Rates are varied across the state. Of the five largest cities, El Paso is in a county with the highest rate, while San Antonio, Houston and Dallas-Fort Worth are in counties with the second-highest rate. Austin is in a county with the second-lowest rate.
Map produced February 2020 based on 2013-2017 American Community Survey data.
- Click on the map for a larger, downloadable version.
- To browse or download the data used to make this map, use our Disability Data Lookup Tool.


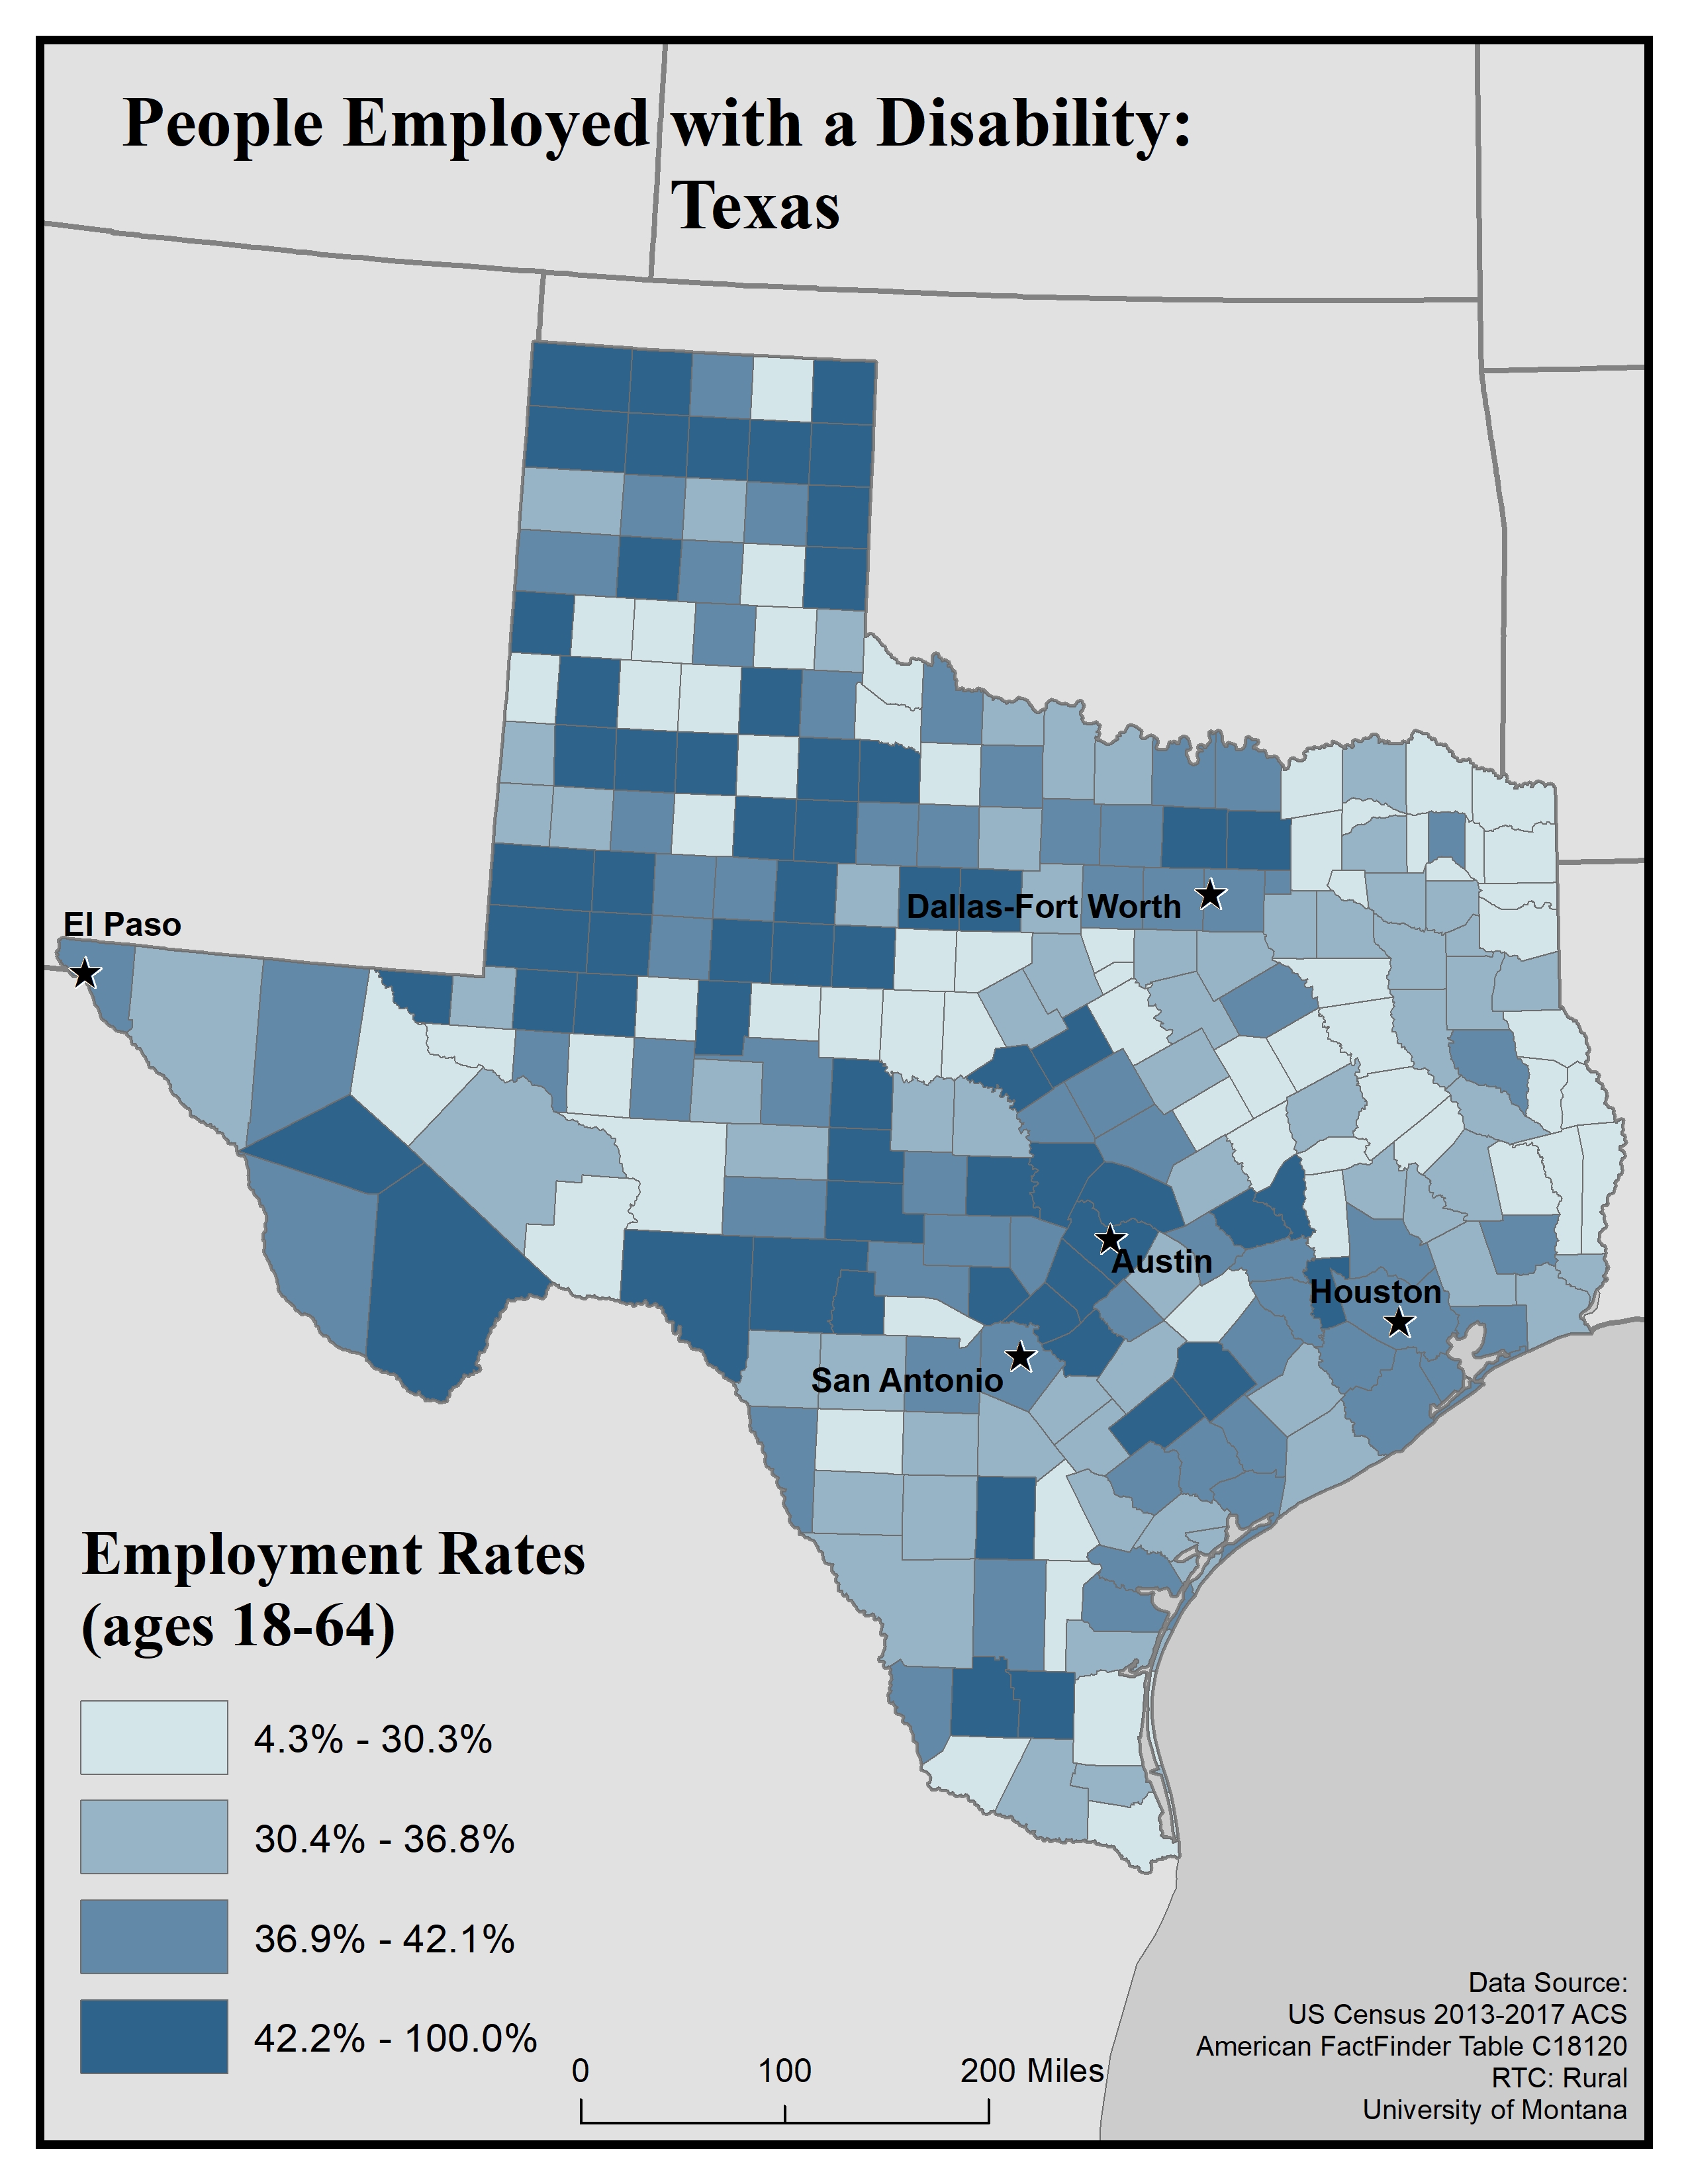
Employment: Texas
-
This map explores American Community Survey (ACS) 5-year data (Table C18120) employment estimates by disability type.
The ACS asks a set of disability indicator questions to determine disability. If a respondent can answer “yes” to any disability question they are classified as having a disability. The data below are for ages 18-64.
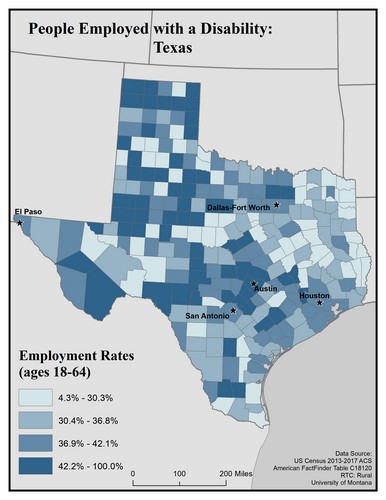
This map of the state of Texas shows employment rates among people with disabilities (ages 18 to 64). Rates are broken into four categories: 4.3 to 30.3%, 30.4 to 36.8%, 36.9 to 42.1%, and 42.2 to 100%.
The five largest cities (El Paso, Dallas-Fort Worth, San Antonio, Austin, and Houston) are labeled on the map to show if there are any differences between disability rates in urban vs rural areas. Rates are varied across the state, but slightly higher in the north. Of the five largest cities, San Antonio, El Paso, Houston and Dallas-Fort Worth are in counties with the second highest rate, while Austin is in a county with the highest rate.
Map produced February 2020 based on 2013-2017 American Community Survey data.
- Click on the map for a larger, downloadable version.
- To browse or download the data used to make this map, use our Disability Data Lookup Tool.
-
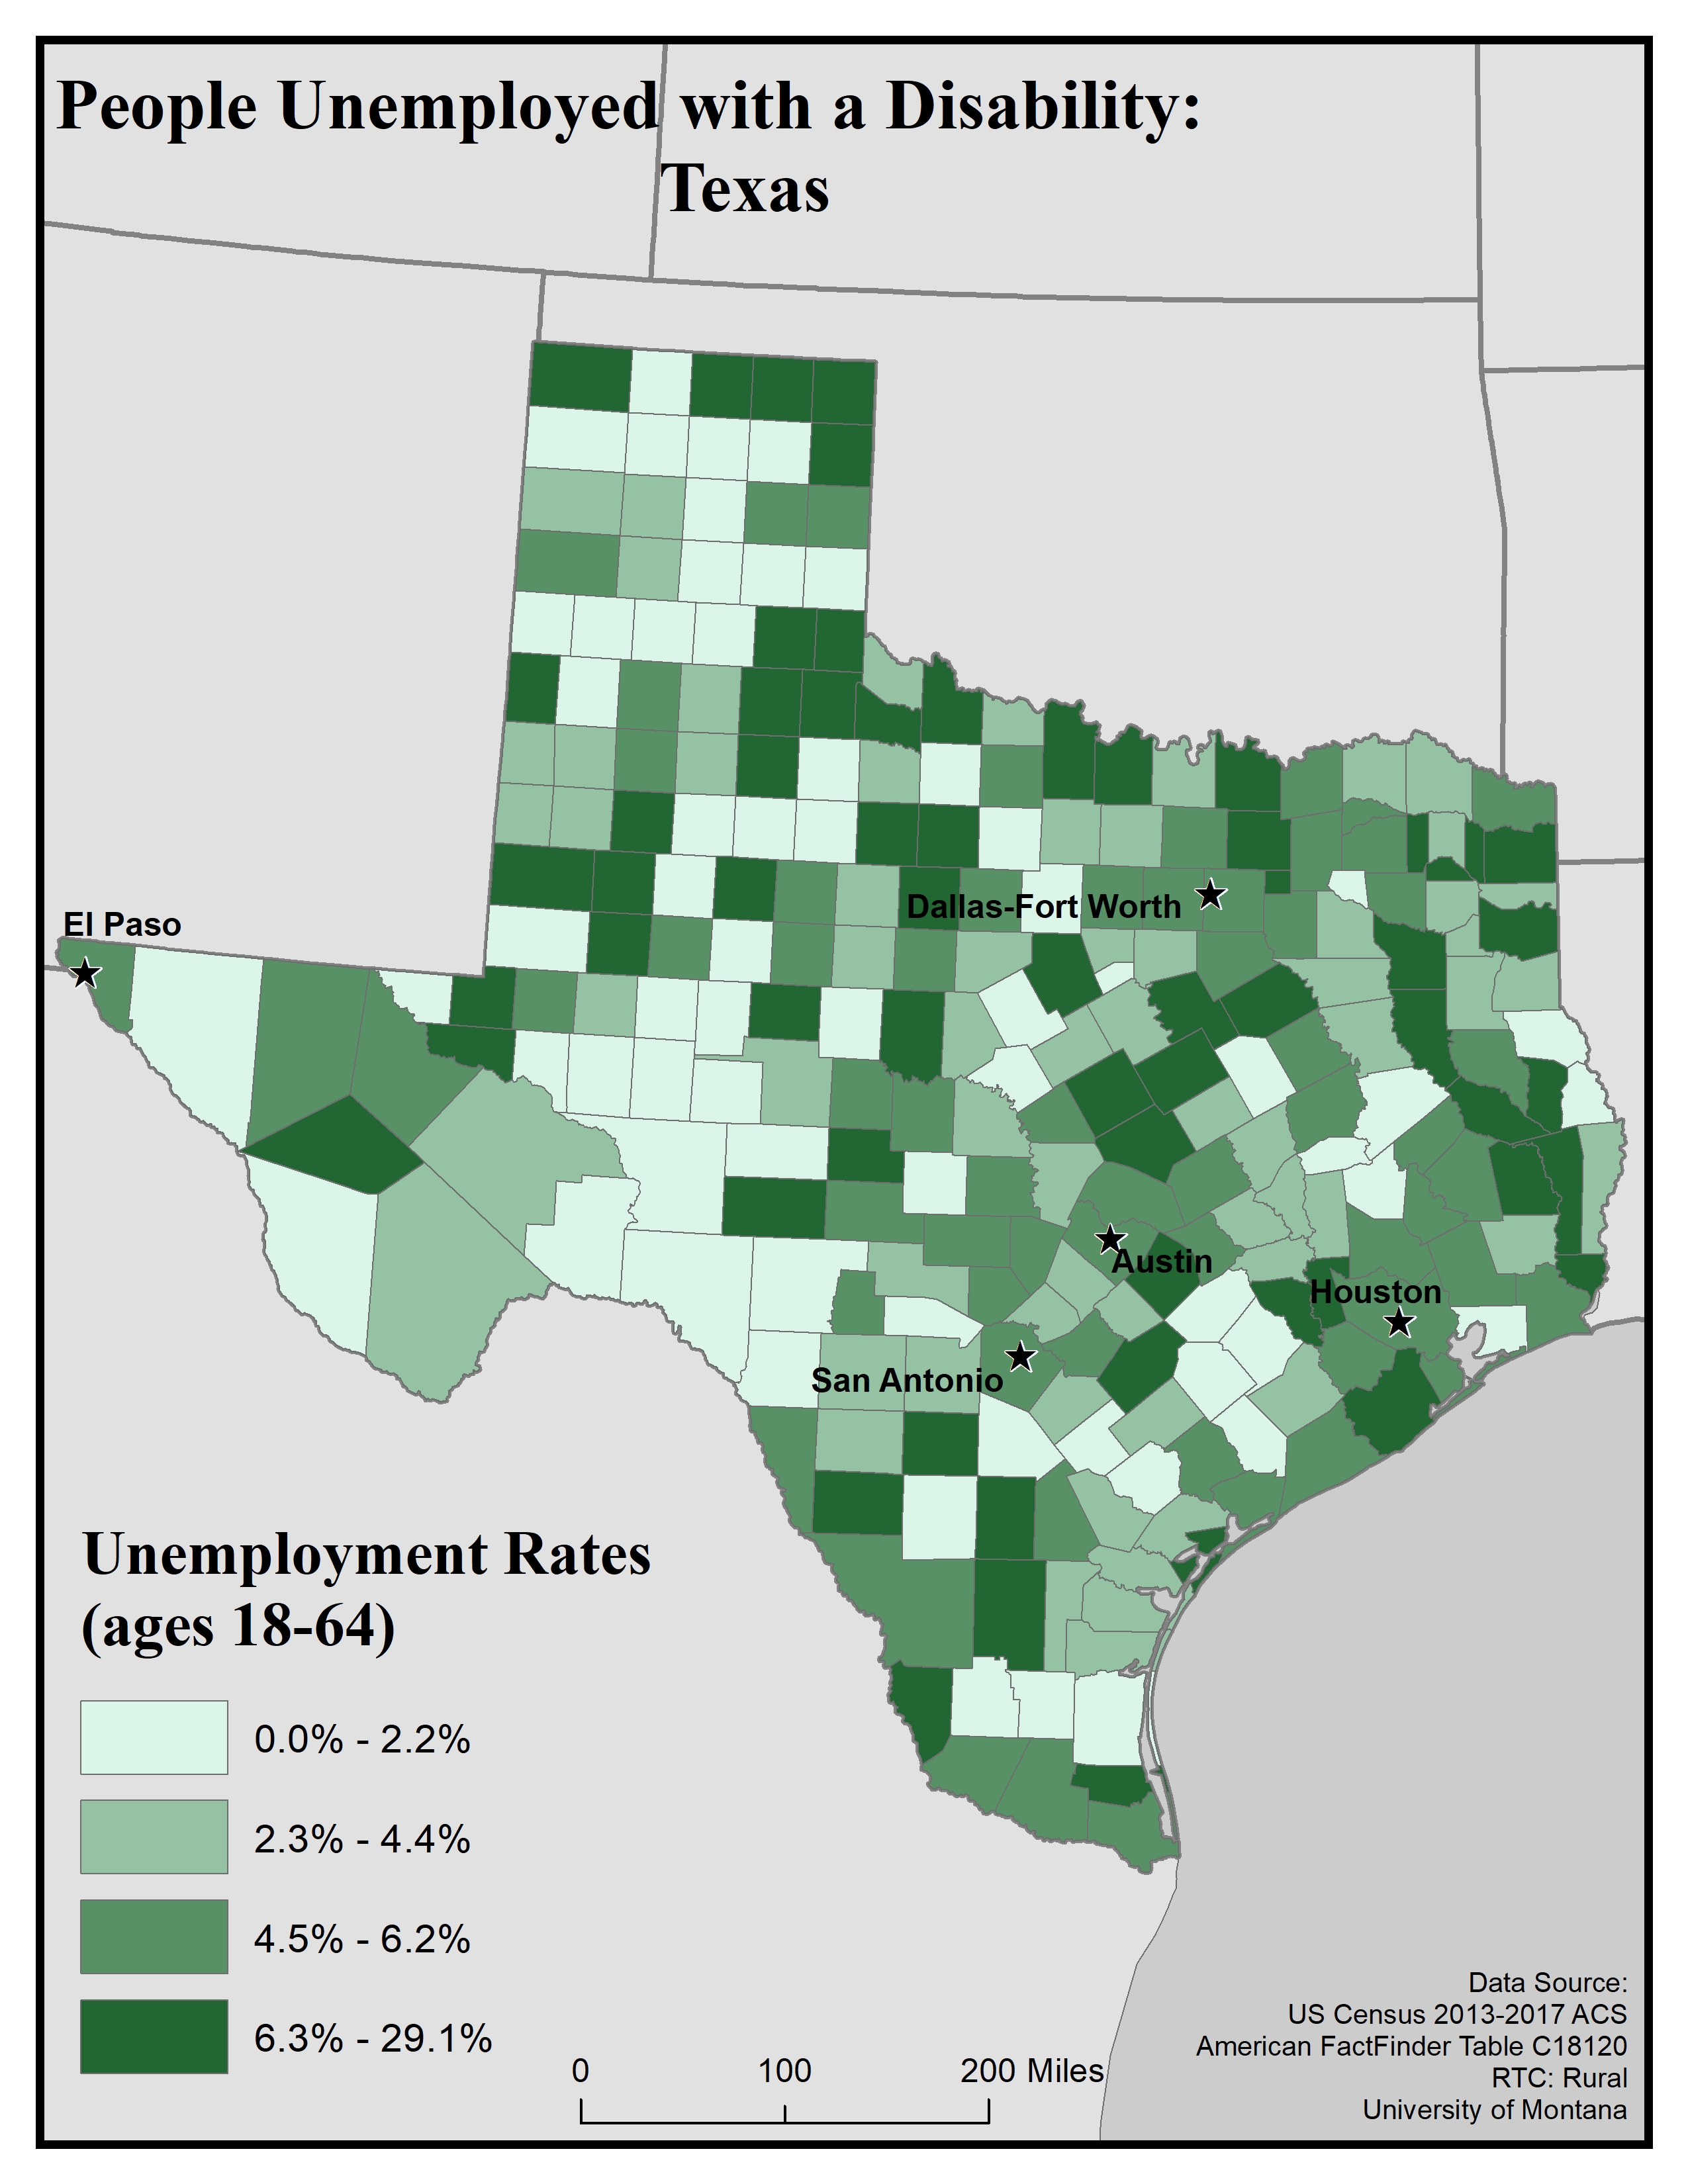
This map explores American Community Survey (ACS) 5-year data (Table C18120) employment estimates by disability type.
The ACS asks a set of disability indicator questions to determine disability. If a respondent can answer “yes” to any disability question they are classified as having a disability. The data below are for ages 18-64.
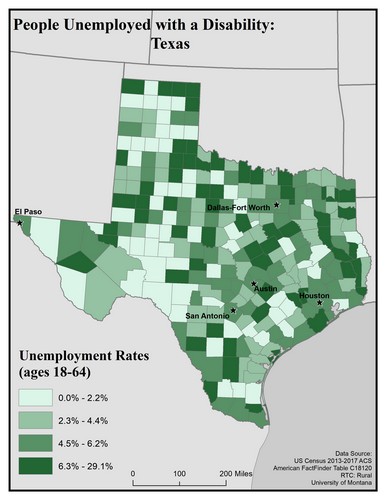
This map of the state of Texas shows unemployment rates among people with disabilities (ages 18 to 64). Rates are broken into four categories: 0.0 to 2.2%, 2.3 to 4.4%, 4.5 to 6.2%, and 6.3 to 29.1%.
The five largest cities (El Paso, Dallas-Fort Worth, San Antonio, Austin, and Houston) are labeled on the map to show if there are any differences between disability rates in urban vs rural areas. Rates are varied across the state. Of the five largest cities, San Antonio, El Paso, Houston, Austin and Dallas-Fort Worth are in counties with the second highest rate.
Map produced February 2020 based on 2013-2017 American Community Survey data.
- Click on the map for a larger, downloadable version.
- To browse or download the data used to make this map, use our Disability Data Lookup Tool.
-
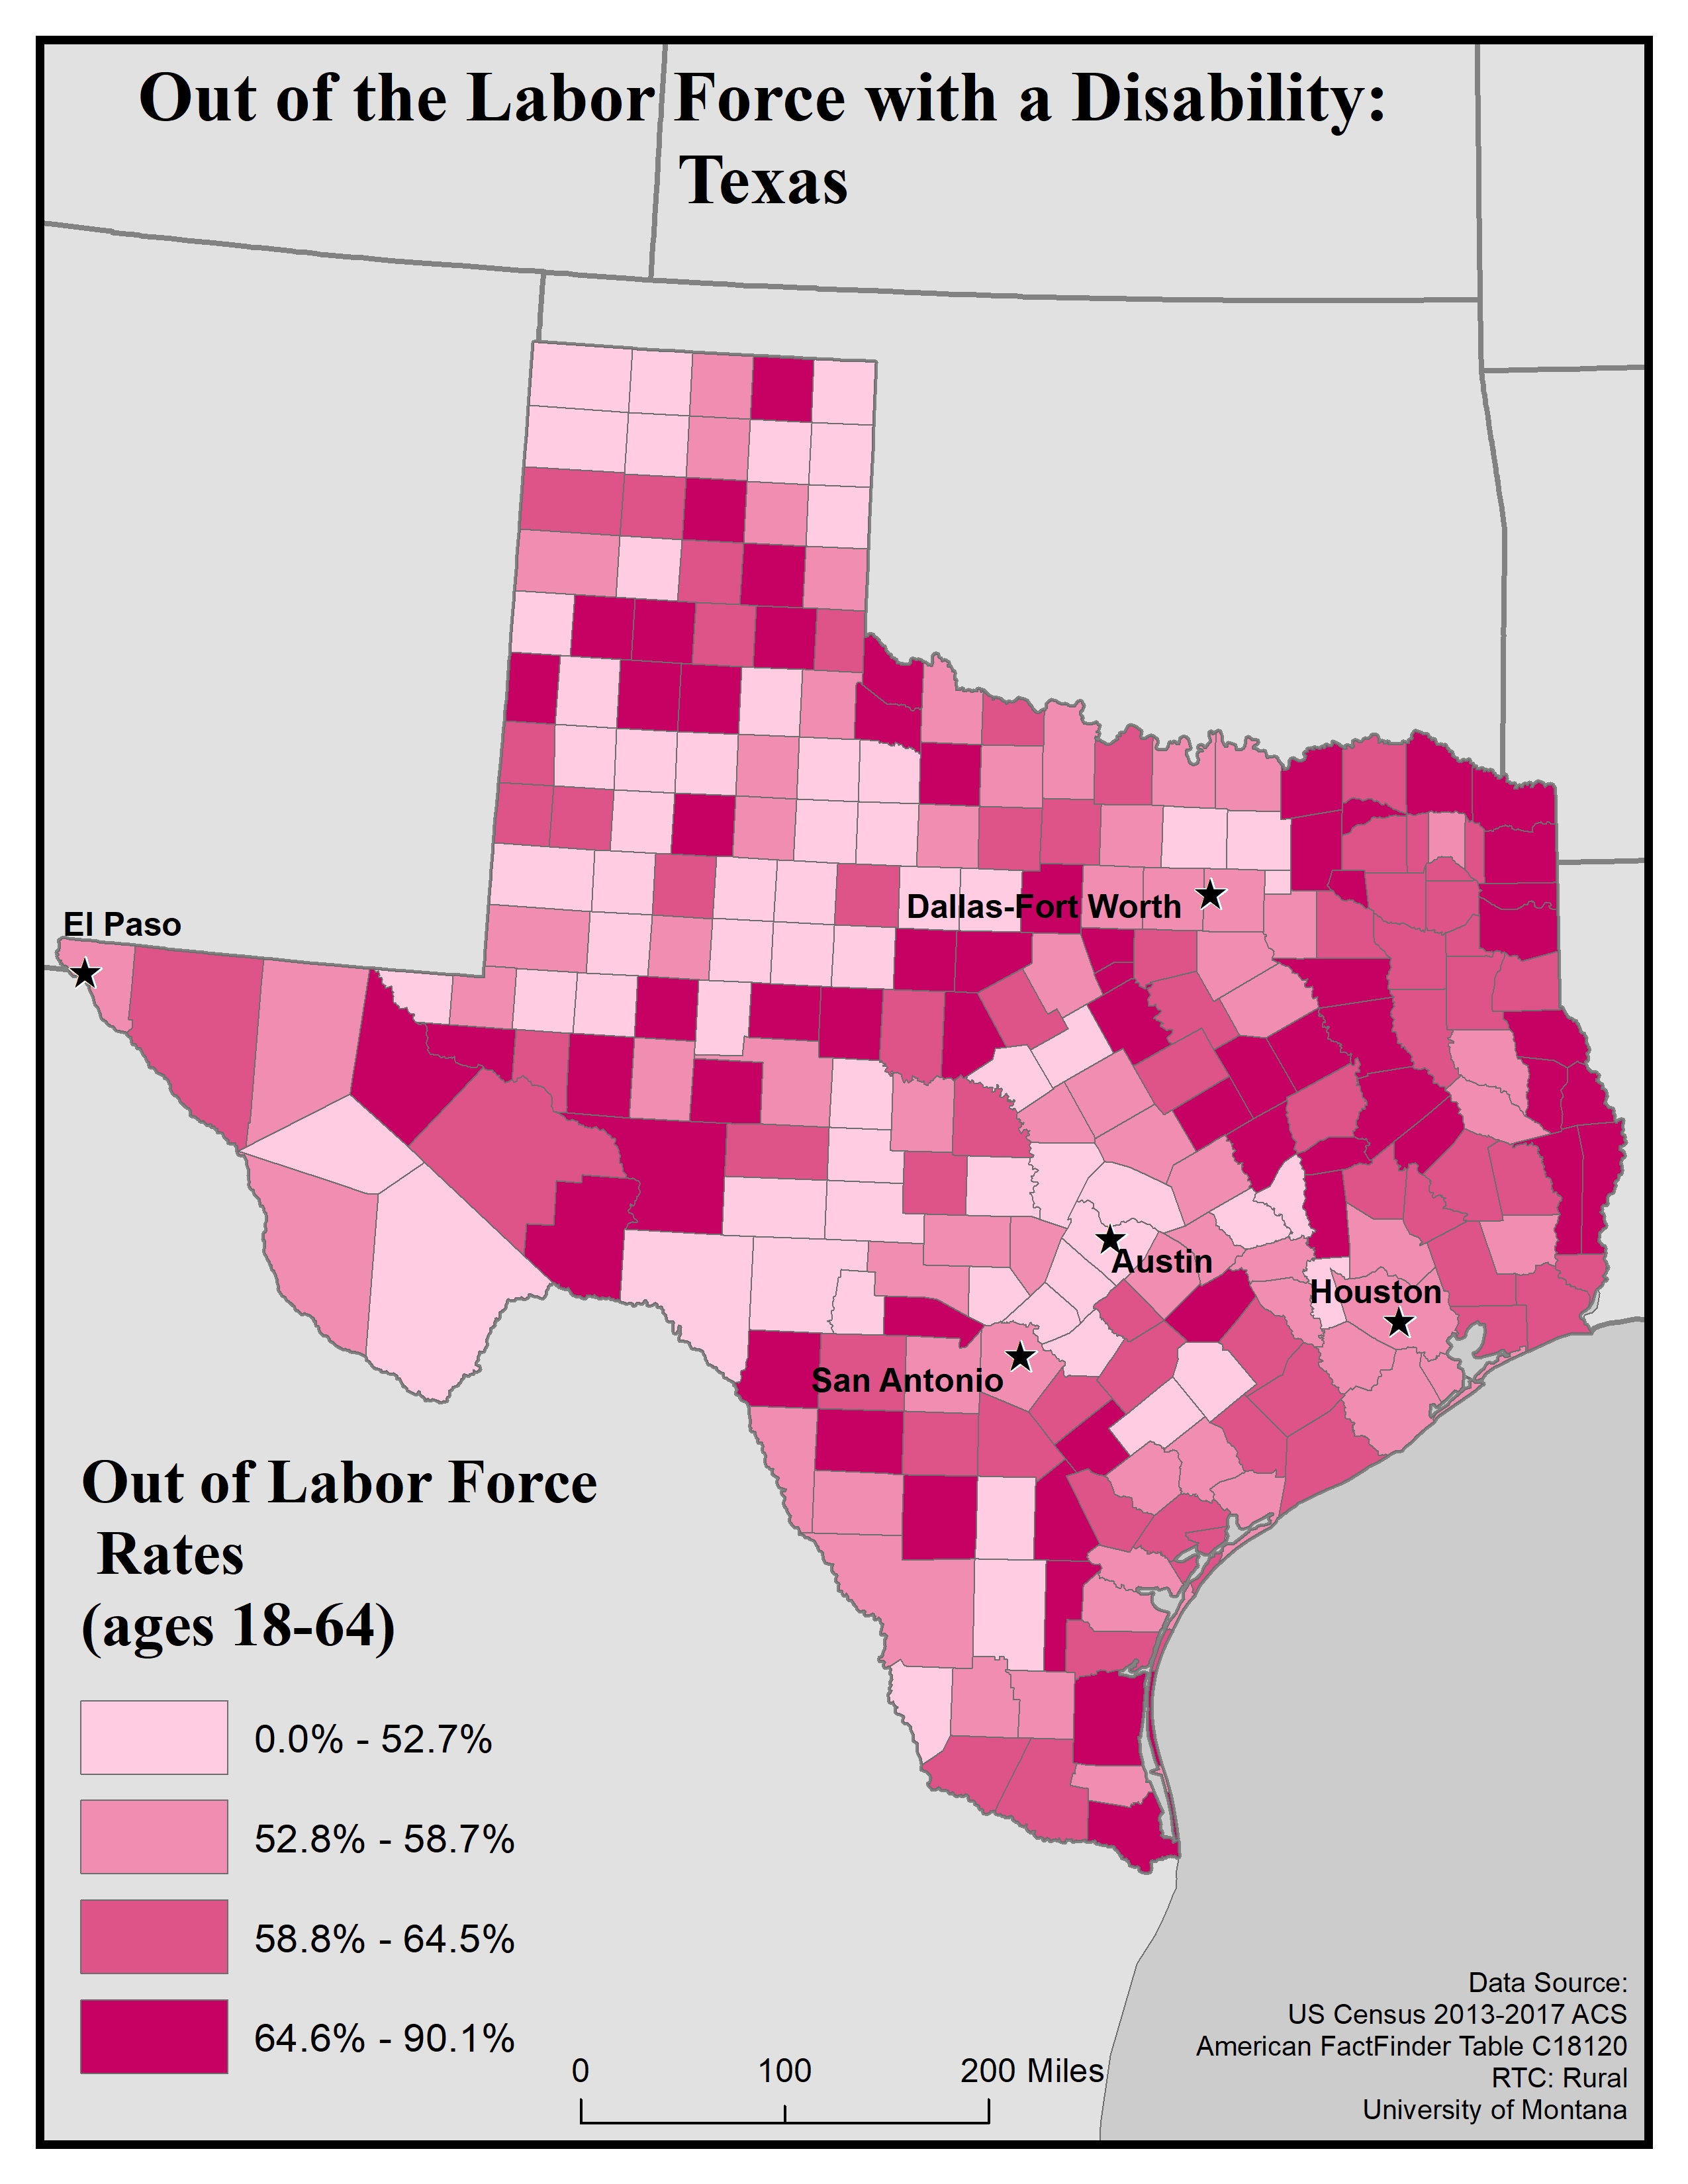
This map explores American Community Survey (ACS) 5-year data (Table C18120) employment estimates by disability type.
The ACS asks a set of disability indicator questions to determine disability. If a respondent can answer “yes” to any disability question they are classified as having a disability. The data below are for ages 18-64.

This map of the state of Texas shows rates of people with disabilities out of the labor force (ages 18 to 64) by county. Rates are broken into four categories: 0.0 to 52.7%, 52.8 to 58.7%, 58.8 to 64.5%, and 64.6 to 90.1%.
The five largest cities (El Paso, Dallas-Fort Worth, San Antonio, Austin, and Houston) are labeled on the map to show if there are any differences between disability rates in urban vs rural areas. Overall, rates are higher in the east, but there are high-rate counties across the state.
Of the five largest cities, San Antonio, El Paso, Houston and Dallas-Fort Worth are in counties with the second lowest rate, while Austin is in a county with the lowest rate.
Map produced February 2020 based on 2013-2017 American Community Survey data.
- Click on the map for a larger, downloadable version.
- To browse or download the data used to make this map, use our Disability Data Lookup Tool.
Disability Rates by Functional Limitation: Texas
-
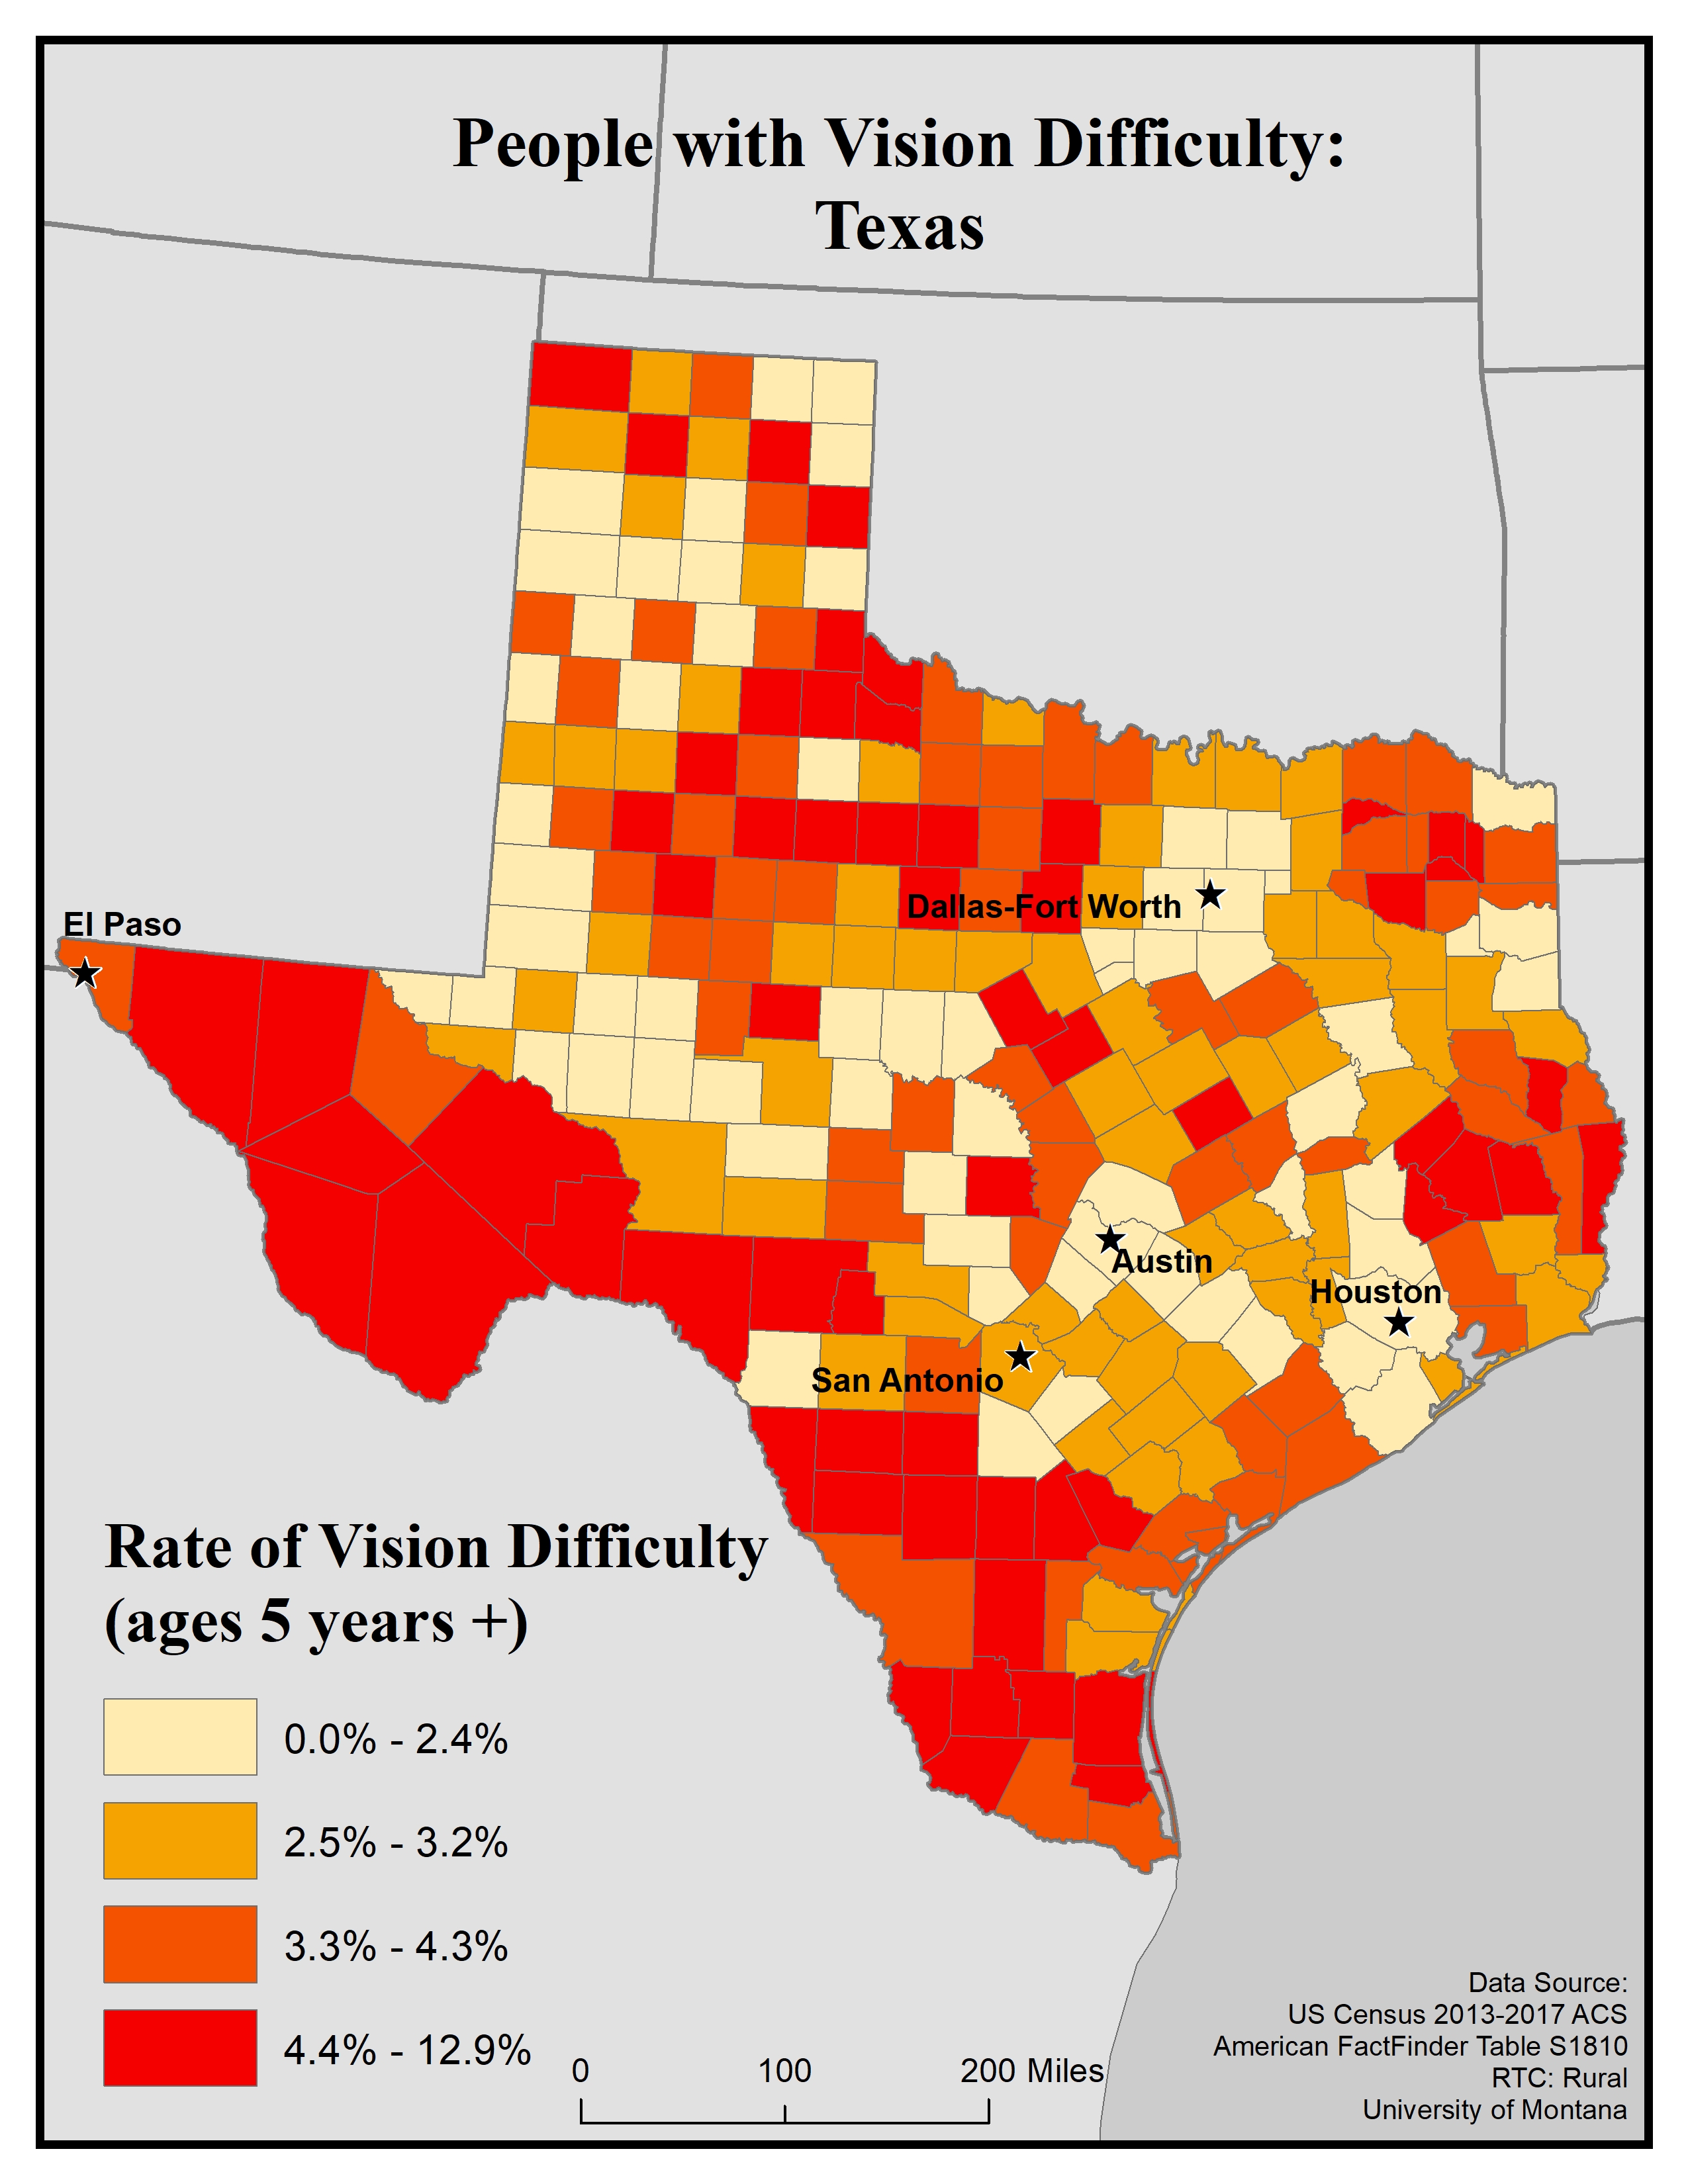
This map explores the American Community Survey (ACS) 5-year data (Table S1810) on disability estimates by county.
For vision difficulty the ACS asks if a respondent is blind or has serious difficulty seeing, even when wearing glasses. If they answer “yes” they are classified as having a vision difficulty. This data is for all ages.
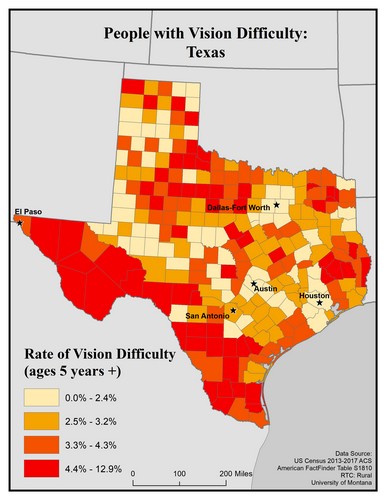
This map of the state of Texas shows rates of people with vision difficulty for ages 5 and older by county. Rates are broken into four categories: 0.0 to 2.4%, 2.5 to 3.2%, 3.3 to 4.3%, and 4.4 to 12.9%.
The five largest cities (El Paso, Dallas-Fort Worth, San Antonio, Austin, and Houston) are labeled on the map to show if there are any differences between rates in urban vs rural areas. Overall, rates are somewhat varied across the state, but there are generally higher rates in rural counties compared to urban ones. Of the five largest cities, San Antonio and El Paso are in counties with the second lowest rate, while Austin, Houston and Dallas-Fort Worth are in counties with the lowest rate.
High rates of vision difficulty are spread across the state, including the west and south, east, and spread throughout the central and even northern parts of the state.
Map produced February 2020 based on 2013-2017 American Community Survey data.
- Click on the map for a larger, downloadable version.
- To browse or download the data used to make this map, use our Disability Data Lookup Tool.
-
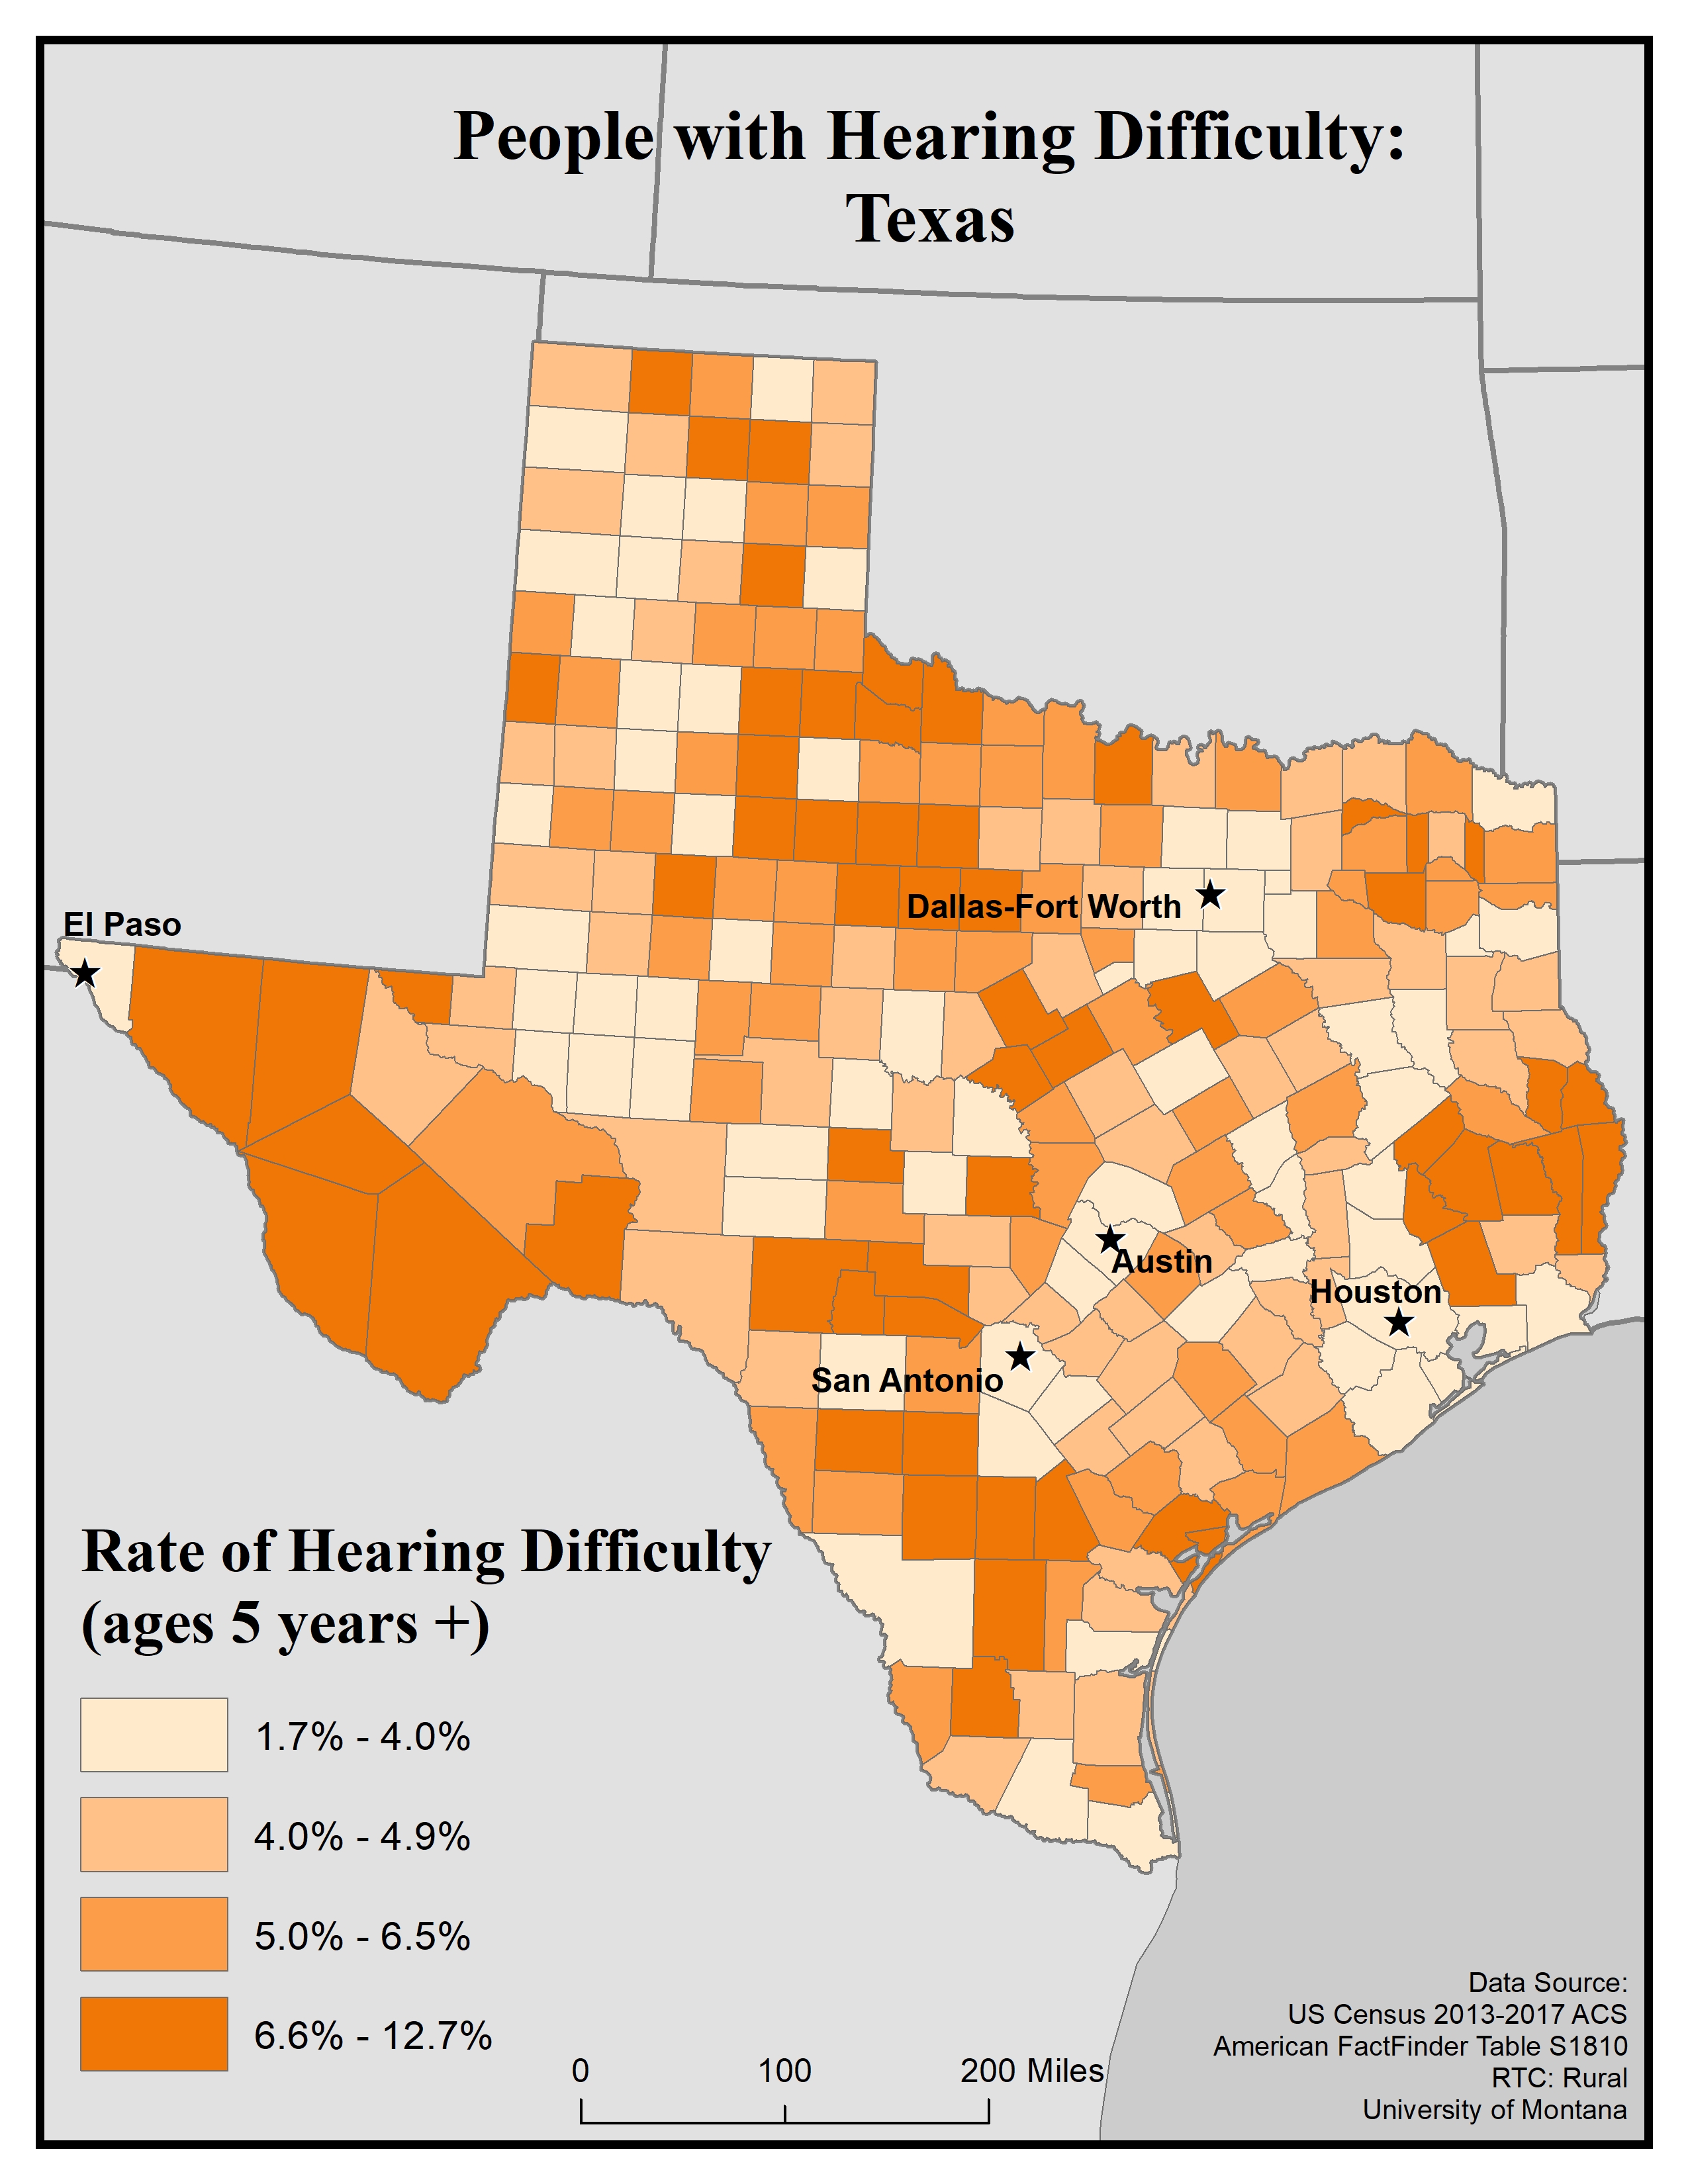
This map explores the American Community Survey (ACS) 5-year data (Table S1810) on disability estimates by county.
For hearing difficulty the ACS asks if a respondent is deaf or has serious difficulty hearing. If they answer “yes” they are classified as having a hearing difficulty. This data is for all ages.
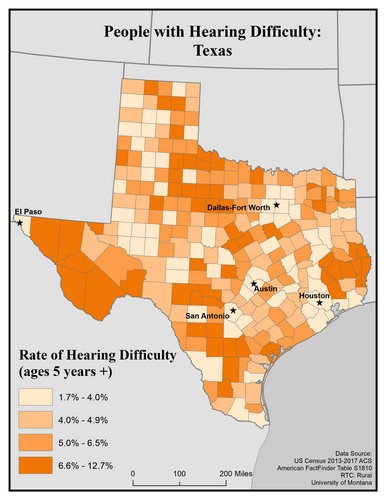
This map of the state of Texas shows rates of people with hearing difficulty for ages 5 and older by county. Rates are broken into four categories: 1.7 to 4.0%, 4.0 to 4.9%, 5.0 to 6.5%, and 6.6 to 12.7%.
The five largest cities (El Paso, Dallas-Fort Worth, San Antonio, Austin, and Houston) are labeled on the map to show if there are any differences between disability rates in urban vs rural areas. Overall, rates are somewhat varied across the state, but there are generally higher rates in rural counties compared to urban ones. Of the five largest cities, all are in counties with the lowest rate.
High rates are spread throughout the state, with some pockets in the west, north- and south-central, and east.
Map produced February 2020 based on 2013-2017 American Community Survey data.
- Click on the map for a larger, downloadable version.
- To browse or download the data used to make this map, use our Disability Data Lookup Tool.
-
This map explores the American Community Survey (ACS) 5-year data (Table S1810) on disability estimates by county.
For cognitive difficulty the ACS asks because of a physical, mental, or emotional problem, does the respondent have difficulty remembering, concentrating, or making decisions. If they answer “yes” they are classified as having a cognitive difficulty. This data is for ages 5 and up.
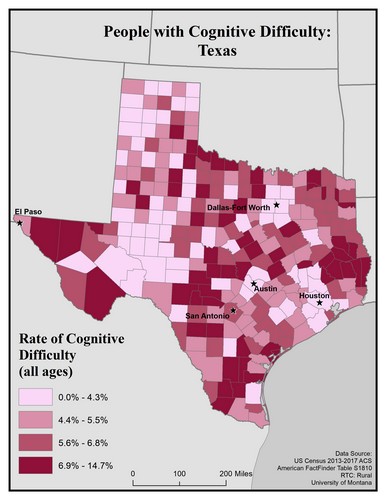
This map of the state of Texas shows rates of people with cognitive difficulty for all ages by county. Rates are broken into four categories: 0.0 to 4.3%, 4.4 to 5.5%, 5.6 to 6.8%, and 6.9 to 14.7%.
The five largest cities (El Paso, Dallas-Fort Worth, San Antonio, Austin, and Houston) are labeled on the map to show if there are any differences between disability rates in urban vs rural areas. Of the five largest cities, San Antonio is in a county with the second-highest rate, El Paso is in a county with the second-lowest rate, while Austin, Houston and Dallas-Fort Worth are in counties with the lowest rate.
High rates are spread throughout the state, with some pockets in the west, north-, central, and south-central, and east.
Map produced February 2020 based on 2013-2017 American Community Survey data.
- Click on the map for a larger, downloadable version.
- To browse or download the data used to make this map, use our Disability Data Lookup Tool.
-
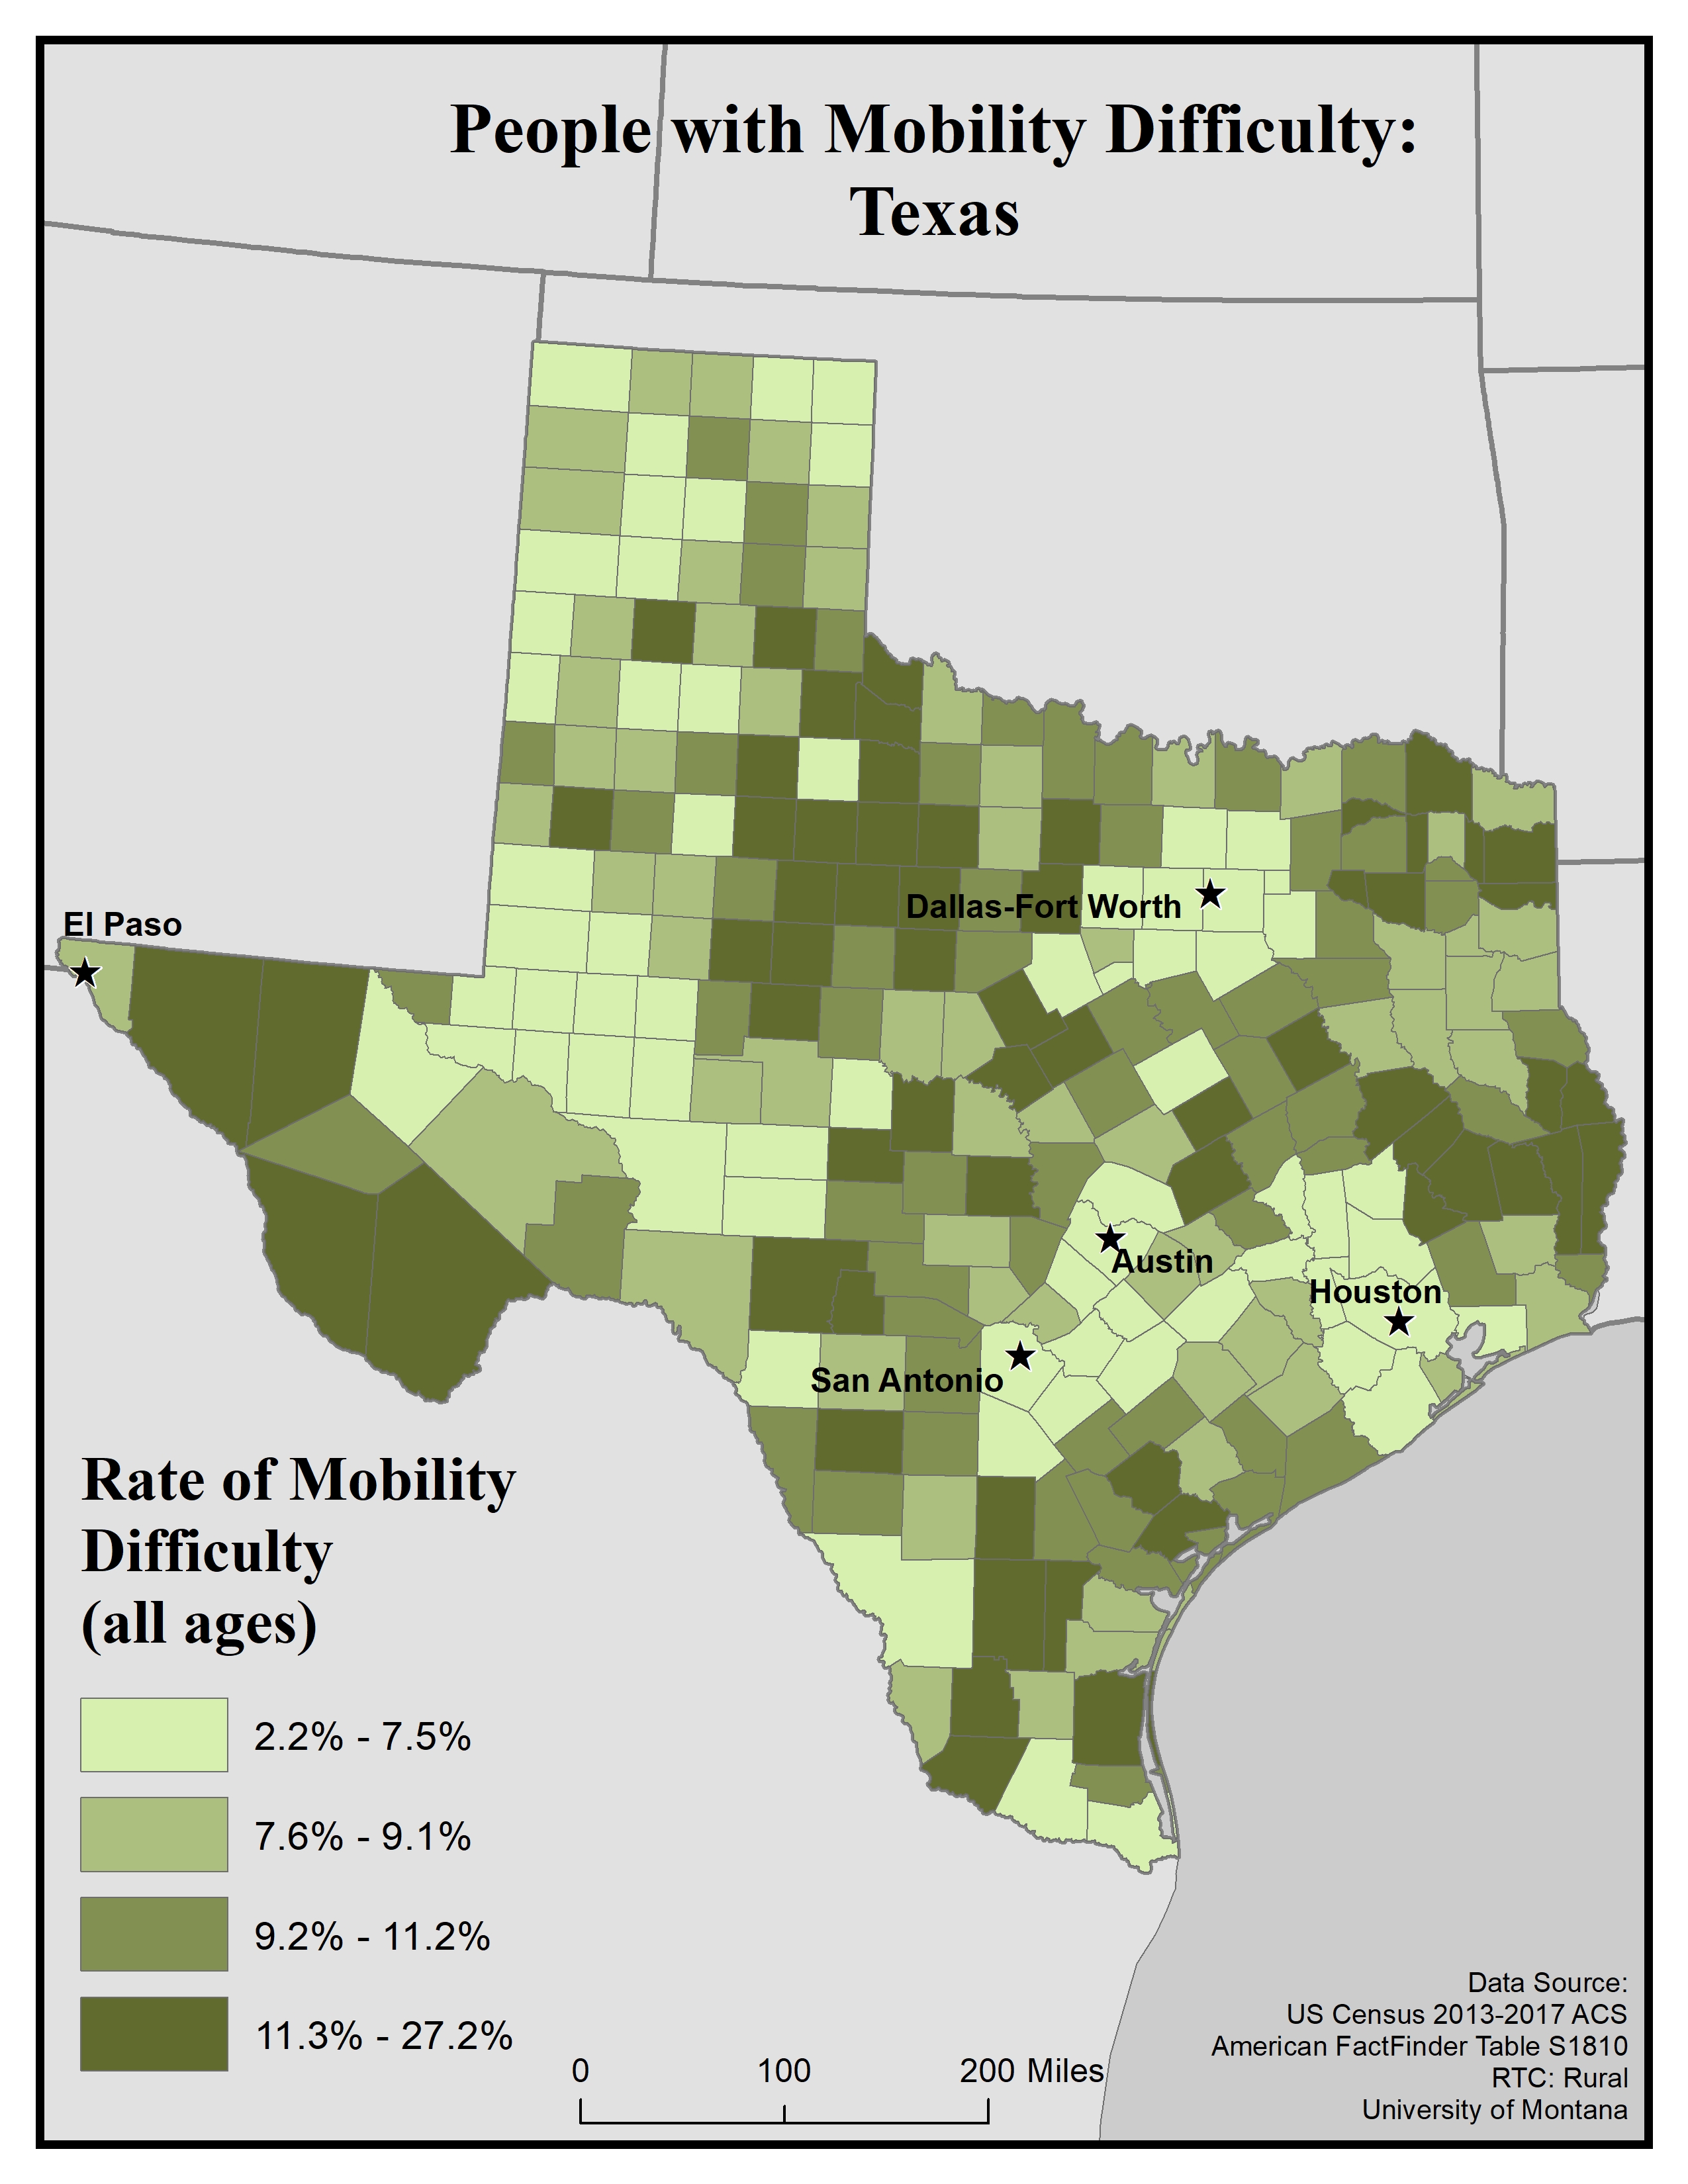
This map explores the American Community Survey (ACS) 5-year data (Table S1810) on disability estimates by county.
For ambulatory (i.e. mobility) difficulty the ACS asks if a respondent has serious difficulty walking or climbing stairs. If they answer “yes” they are classified as having a mobility difficulty. This data is for ages 5 and up.
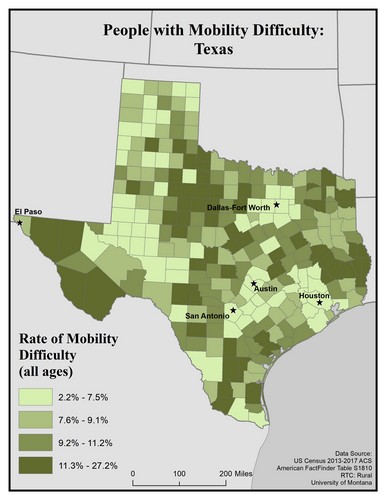 This map of the state of Texas shows rates of people with mobility difficulty for all ages by county. Rates are broken into four categories: 2.2 to 7.5%, 7.6 to 9.1%, 9.2 to 11.2%, and 11.3 to 27.2%.
 The five largest cities (El Paso, Dallas-Fort Worth, San Antonio, Austin, and Houston) are labeled on the map to show if there are any differences between disability rates in urban vs rural areas. Overall, rates are somewhat varied across the state, but there are generally higher rates of disability in rural counties compared to urban ones. Of the five largest cities, El Paso is in a county with the second lowest rate, while San Antonio, Austin, Houston and Dallas-Fort Worth are in counties with the lowest rate.
Map produced February 2020 based on 2013-2017 American Community Survey data.
- Click on the map for a larger, downloadable version.
- To browse or download the data used to make this map, use our Disability Data Lookup Tool.
-
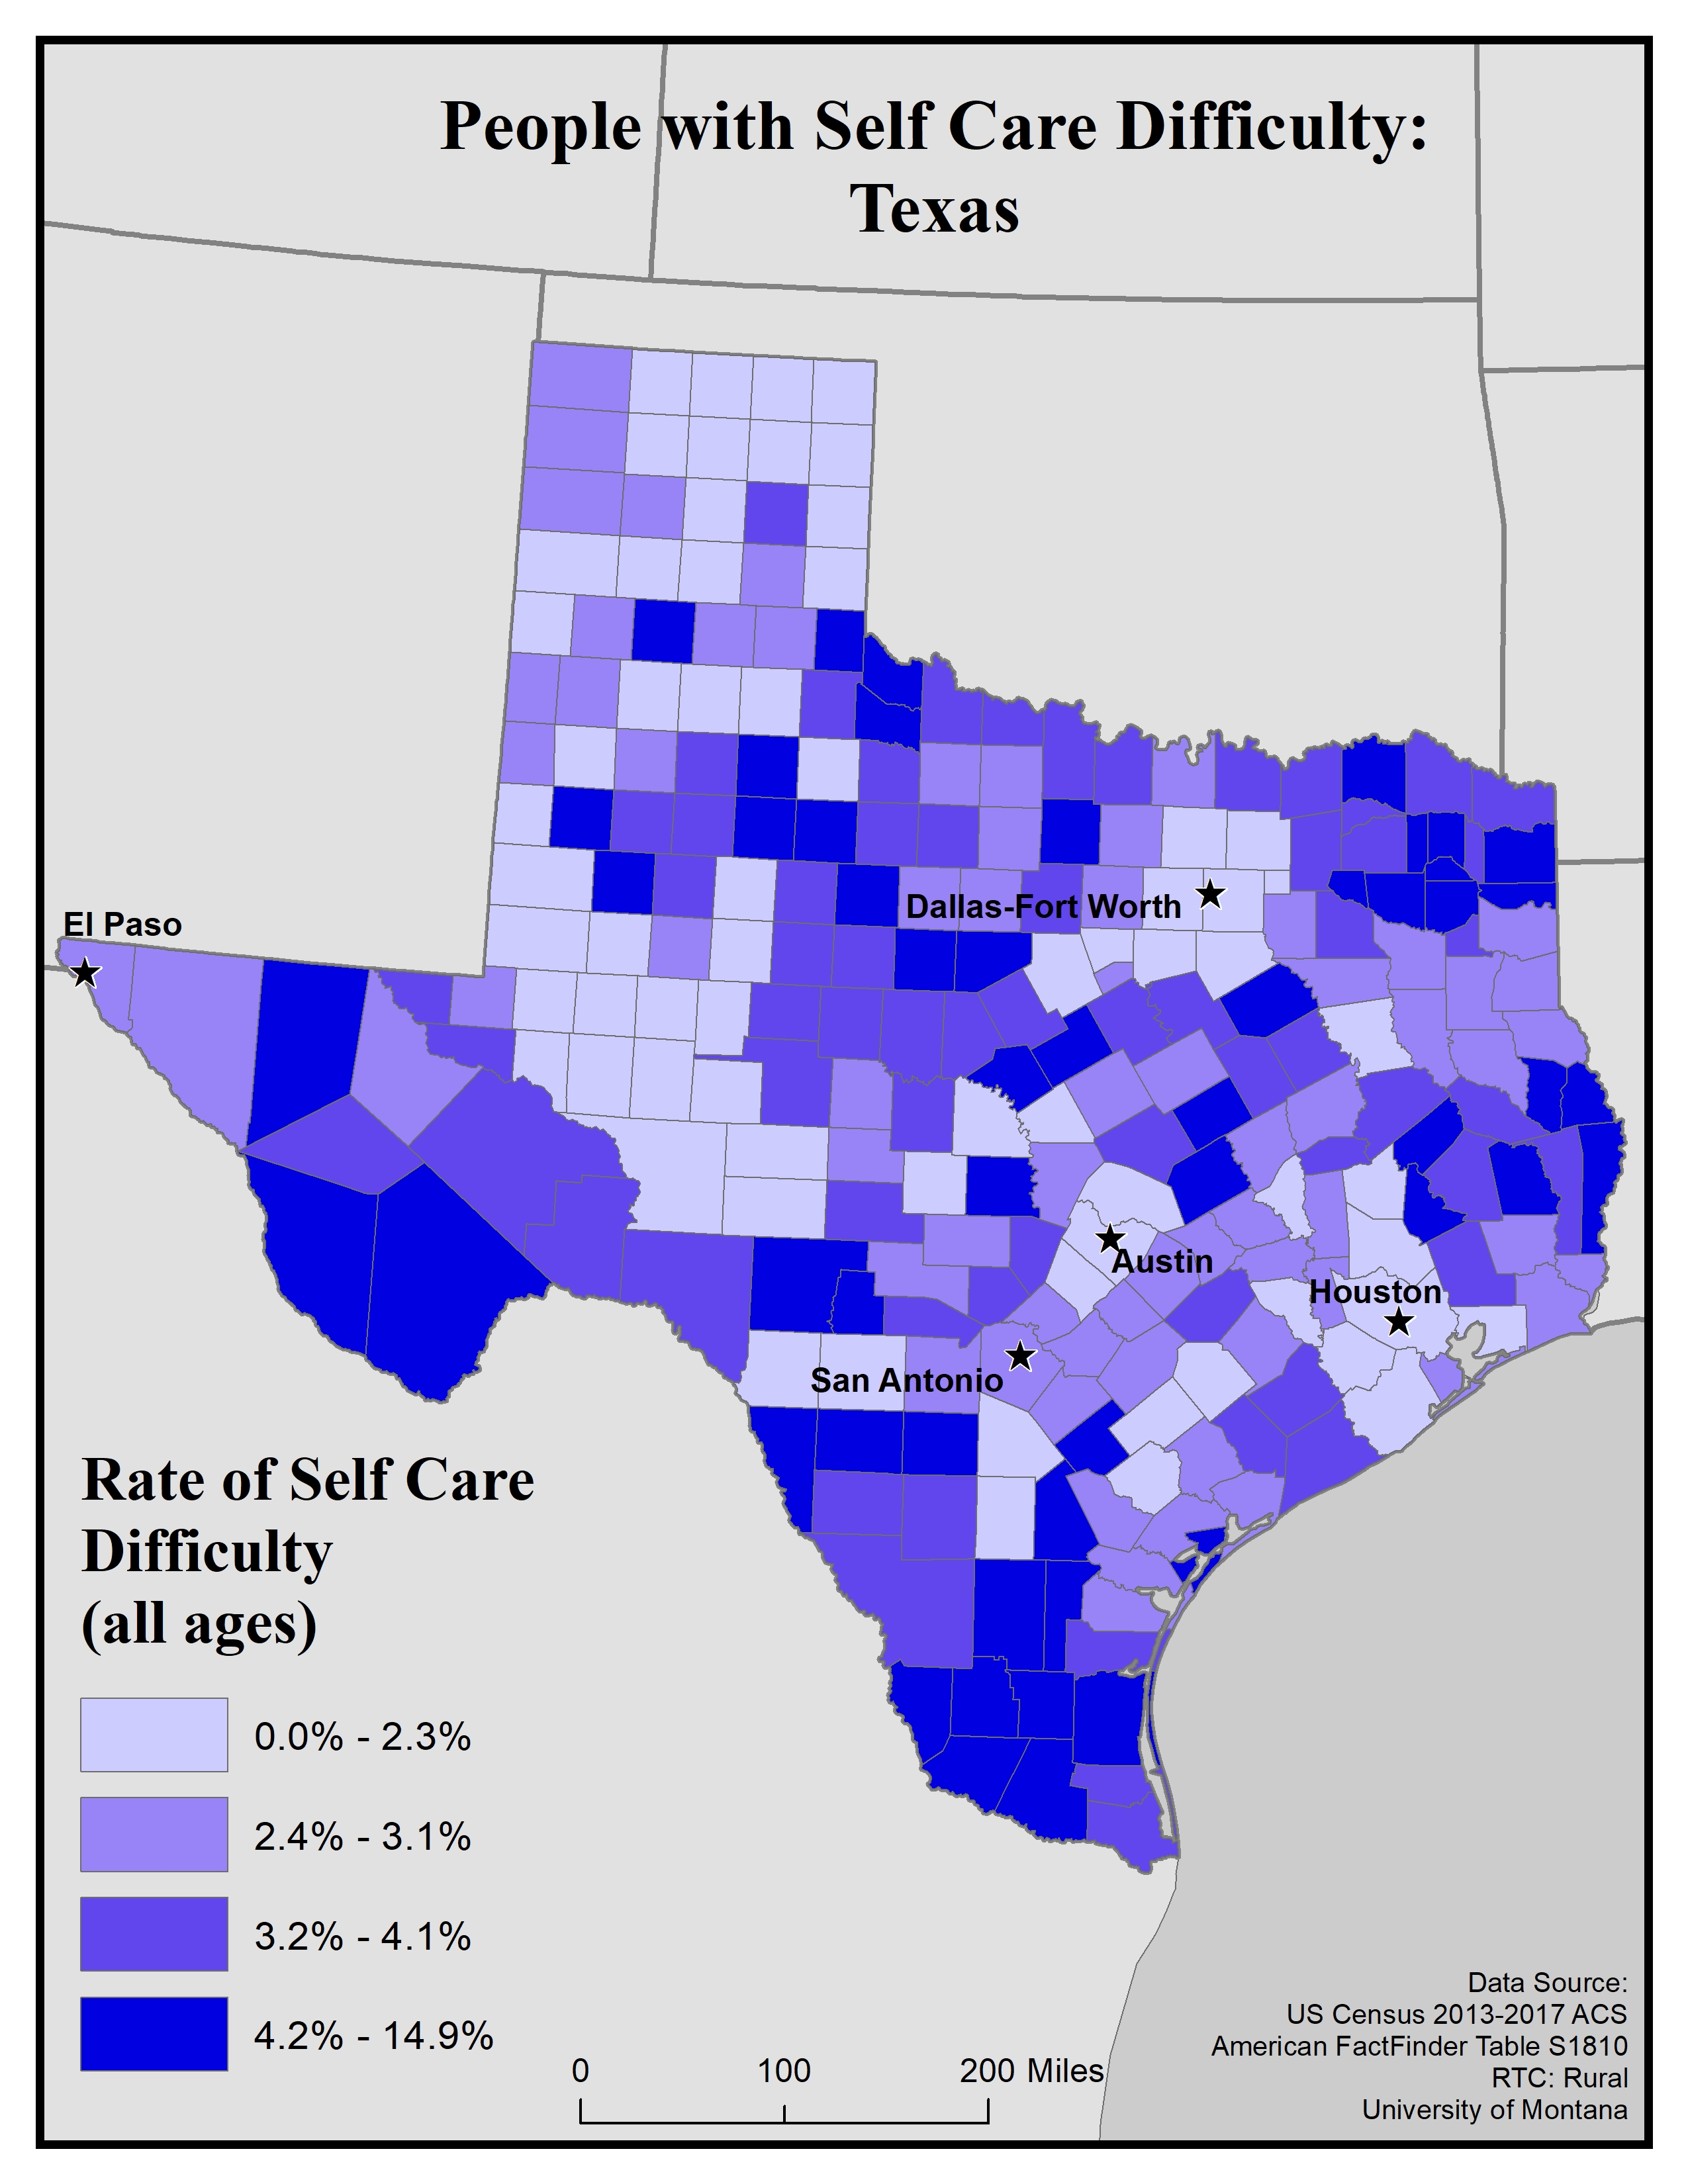
This map explores the American Community Survey (ACS) 5-year data (Table S1810) on disability estimates by county.
For self-care difficulty the ACS asks if a respondent has difficulty bathing or dressing. If they answer “yes” they are classified as having a self-care difficulty. This data is for ages 5 and up.
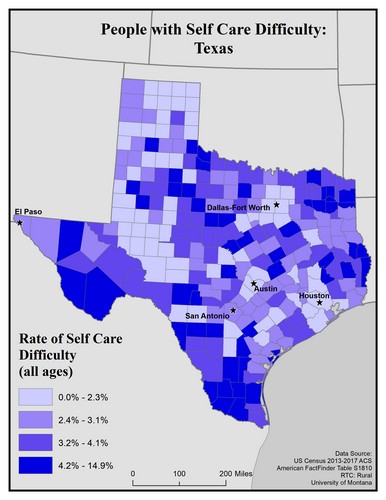
This map of the state of Texas shows rates of people with self care difficulty for all ages by county. Rates are broken into four categories: 0.0 to 2.3%, 2.4 to 3.1%, 3.2 to 4.1%, and 4.2 to 14.9%.
The five largest cities (El Paso, Dallas-Fort Worth, San Antonio, Austin, and Houston) are labeled on the map to show if there are any differences between disability rates in urban vs rural areas. Overall, rates are somewhat varied across the state, but there are generally higher rates of disability in rural counties compared to urban ones. Of the five largest cities, San Antonio and El Paso are in counties with the second lowest rate, while Austin, Houston and Dallas-Fort Worth are in counties with the lowest rate.
Map produced February 2020 based on 2013-2017 American Community Survey data.
- Click on the map for a larger, downloadable version.
- To browse or download the data used to make this map, use our Disability Data Lookup Tool.
-
This map explores the American Community Survey (ACS) 5-year data (Table S1810) on disability estimates by county.
For independent living difficulty the ACS asks because of a physical, mental, or emotional problem, does the respondent have difficulty doing errands alone such as visiting a doctor’s office or shopping. If they answer “yes” they are classified as having an independent living difficulty. This data is for ages 18 and up.
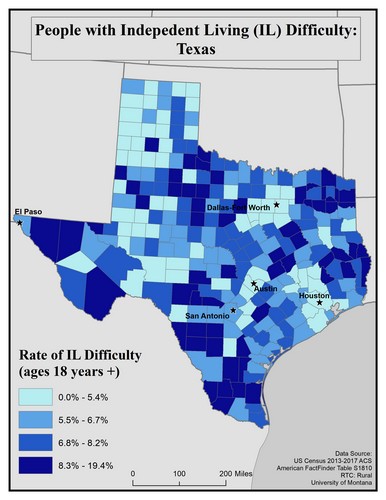
This map of the state of Texas shows rates of people with Independent Living difficulty for ages 18 and older by county. Rates are broken into four categories: 0.0 to 5.4%, 5.5 to 6.7%, 6.8 to 8.2%, and 8.3 to 19.4%.
The five largest cities (El Paso, Dallas-Fort Worth, San Antonio, Austin, and Houston) are labeled on the map to show if there are any differences between disability rates in urban vs rural areas. Overall, rates are somewhat varied across the state, but there are generally higher rates of disability in rural counties compared to urban ones. Of the five largest cities, San Antonio and El Paso are in counties with the second lowest rate, while Austin, Houston and Dallas-Fort Worth are in counties with the lowest rate.
Map produced February 2020 based on 2013-2017 American Community Survey data.
- Click on the map for a larger, downloadable version.
- To browse or download the data used to make this map, use our Disability Data Lookup Tool.