The maps on this page explore the American Community Survey 5-year data (Table S1810) on disability by county.
The ACS does not directly measure disability. Instead, it uses a set of disability indicator questions related to difficulty and functional impairment to identify individuals who may experience a disability. If a respondent can answer “yes” to any disability question they are classified as having a disability.
Disability Rates: Montana
-
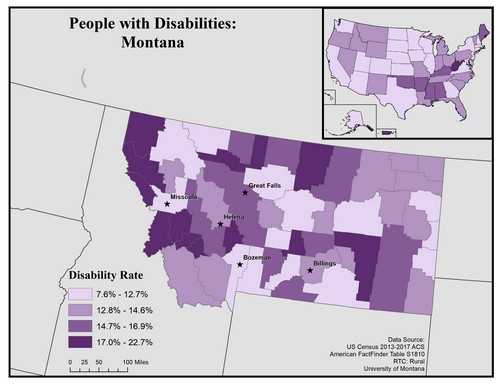
This map of Montana displays rates of disabilities across the state at the county level. Disability rates are broken into four categories from 7.6 to 22.7%. The five largest urban areas (Missoula, Helena, Great Falls, Bozeman, and Billings) are labeled on the map to show if there are any differences between rates in urban compared to rural areas. Two of the five most populous cities in Montana are located in counties with the lowest rate category of 7.6 to 12.7%, while the other three are located in counties with the two middle rates categories of 12.8 to 14.6% and 14.7 to 16.9%.
In the upper right of the map is an inset map of the United States where, again, disability rates were broken into four quantiles. Montana falls into the second quantile when compared to other states.
Map produced August 2019 based on 2013-2017 American Community Survey data.
- Click on the map for a larger, downloadable version.
- To browse or download the data used to make this map, use our Disability Data Lookup Tool.
-
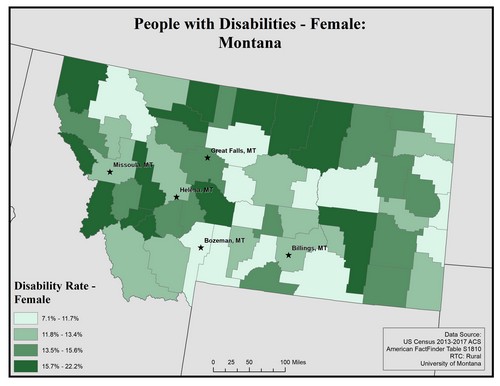
This map of the state of Montana shows disability rate among females by county. Disability rates are broken into four levels from 7.1 to 22.2%.
The five largest urban areas (Missoula, Great Falls, Helena, Bozeman, and Billings) are labeled on the map to show if there are any differences between disability rates in urban compared to rural areas. Disability rates for females in Montana, a very rural state, vary across rural and urban counties. Rates are high in the counties surrounding Missoula, Great Falls, and Helena, with lower rates surrounding Bozeman and Billings, which are further south. The lowest rates of 7.1 to 11.7% occur in counties in the central and eastern parts of the state.
Map produced December 2019 based on 2013-2017 American Community Survey data.
- Click on the map for a larger, downloadable version.
- To browse or download the data used to make this map, use our Disability Data Lookup Tool.
- For information on how biological sex is used and defined in the ACS, see “American Community Survey and Puerto Rico Community Survey 2017 Subject Definitions” page 125.
-
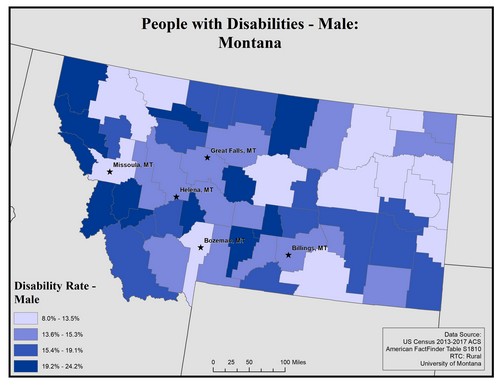
This map of the state of Montana shows disability rate among males by county. Rates are broken into four categories from 8.0 to 24.2%.
The five largest urban areas (Missoula, Helena, Great Falls, Bozeman, and Billings) are labeled on the map to show if there are any differences between rates in urban compared to rural areas. Overall, there is an uneven pattern of disability rates for males in Montana, which is a largely rural state. In general, the two lowest categories of rates between 8.0 and 15.3% can be observed around the five most populous cities, as well as the eastern and northwestern parts of the state. The highest rates of 19.4 to 24.2% occur in the western and central counties of the state.
Map produced December 2019 based on 2013-2017 American Community Survey data.
- Click on the map for a larger, downloadable version.
- To browse or download the data used to make this map, use our Disability Data Lookup Tool.
- For information on how biological sex is used and defined in the ACS, see “American Community Survey and Puerto Rico Community Survey 2017 Subject Definitions” page 125.
-
This map explores the American Community Survey (ACS) 5-year data (Table S1810) on disability estimates.
The ACS asks a set of disability indicator questions to determine disability. If a respondent can answer “yes” to any disability question they are classified as having a disability. The data below are for ages 18 and over.
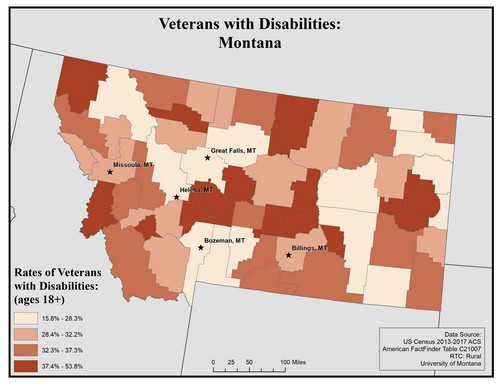
This map of the state of Montana shows the rate of veterans with disabilities at the county level. Rates are broken down into four categories from 15.8 to 53.8%. The five largest urban areas (Missoula, Helena, Great Falls, Bozeman, and Billings) are labeled on the map to show if there are any differences between rates in urban compared to rural areas. All top five most populous cities are in counties that fall under the two lowest categories with rates of 15.8 to 28.3% and 28.4 to 32.2%. The highest rates of 32.3 to 37.3% and 37.4 to 53.8% tend to occur in more rural counties in Montana.
Map produced December 2019 based on 2013-2017 American Community Survey data.
- Click on the map for a larger, downloadable version.
- To browse or download the data used to make this map, use our Disability Data Lookup Tool.
-
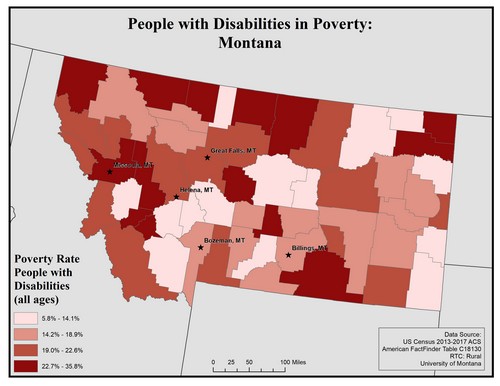
This map of the state of Montana shows the rate of people with disabilities living in poverty at the county level. Rates are broken down into four categories from 5.8 to 35.8%. The five largest urban areas (Missoula, Helena, Great Falls, Bozeman, and Billings) are labeled on the map to show if there are any differences between rates in urban compared to rural areas. None of the five most populous cities are located in counties with the lowest rates of 5.8 to 14.1%. There is an uneven pattern of rates across the state at the county level.
Map produced November 2020 based on 2013-2017 American Community Survey data.
- Click on the map for a larger, downloadable version.
- To browse or download the data used to make this map, use our Disability Data Lookup Tool.


Employment: Montana
-
This map explores American Community Survey (ACS) 5-year data (Table C18120) employment estimates by disability type.
The ACS asks a set of disability indicator questions to determine disability. If a respondent can answer “yes” to any disability question they are classified as having a disability. The data below are for ages 18-64.
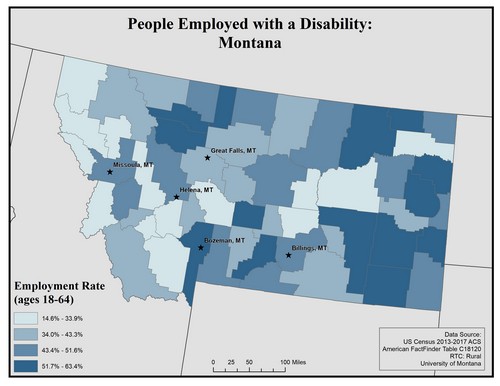
This map of the state of Montana shows the rate of people employed with a disability at the county level. Rates are broken down into four categories from 14.6 to 63.4%. The five largest urban areas (Missoula, Helena, Great Falls, Bozeman, and Billings) are labeled on the map to show if there are any differences between rates in urban compared to rural areas. None of the five most populous cities are located in counties with the lowest rate category of 14.6 to 33.9%. Only one of the five most populous cities is located in a country with the highest category of rates of 51.7 to 63.4%. There is an uneven pattern of the four rate categories across the state.
Map produced December 2019 based on 2013-2017 American Community Survey data.
- Click on the map for a larger, downloadable version.
- To browse or download the data used to make this map, use our Disability Data Lookup Tool.
-
This map explores American Community Survey (ACS) 5-year data (Table C18120) employment estimates by disability type.
The ACS asks a set of disability indicator questions to determine disability. If a respondent can answer “yes” to any disability question they are classified as having a disability. The data below are for ages 18-64.
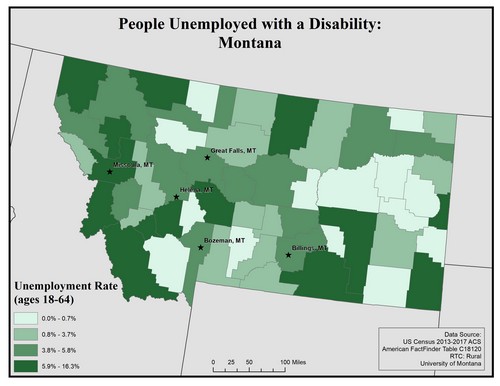
This map of the state of Montana shows the rate of people unemployed with a disability at the county level. Rates are broken down into four categories from 0.0 to 16.3%. The five largest urban areas (Missoula, Helena, Great Falls, Bozeman, and Billings) are labeled on the map to show if there are any differences between rates in urban compared to rural areas. All five of the most populous cities are located in counties with the two highest rate categories of 3.8 to 5.9 and 16.3%. At a glance, there is a larger number of counties with the lowest rate category of 0.0 to 0.7% in the eastern part of the state, and a larger number of counties with the highest rate category of 5.9 to 16.3% in the central and western parts of the state.
Map produced December 2019 based on 2013-2017 American Community Survey data.
- Click on the map for a larger, downloadable version.
- To browse or download the data used to make this map, use our Disability Data Lookup Tool.
-
This map explores American Community Survey (ACS) 5-year data (Table C18120) employment estimates by disability type.
The ACS asks a set of disability indicator questions to determine disability. If a respondent can answer “yes” to any disability question they are classified as having a disability. The data below are for ages 18-64.
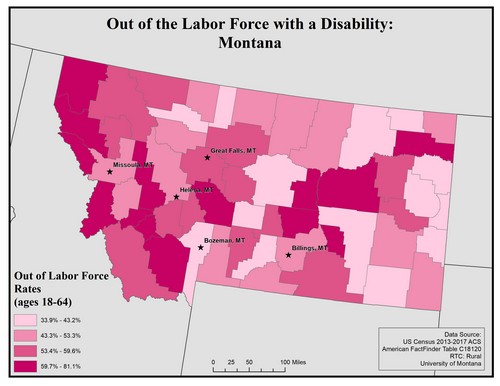
This map of the state of Montana shows the rate of people out of the labor force with a disability at the county level. Rates are broken down into four categories from 33.9 to 81.1%. The five largest urban areas (Missoula, Helena, Great Falls, Bozeman, and Billings) are labeled on the map to show if there are any differences between rates in urban compared to rural areas. Only one of the five most populous cities is located in a county with the lowest rate category of 33.9 to 43.2%. Counties with the highest rate category of 59.7 to 81.1% are largely located in the central and western parts of the state.
Map produced December 2019 based on 2013-2017 American Community Survey data.
- Click on the map for a larger, downloadable version.
- To browse or download the data used to make this map, use our Disability Data Lookup Tool.


Disability Rates by Functional Limitation: Montana
-
This map explores the American Community Survey (ACS) 5-year data (Table S1810) on disability estimates by county.
For vision difficulty the ACS asks if a respondent is blind or has serious difficulty seeing, even when wearing glasses. If they answer “yes” they are classified as having a vision difficulty. This data is for all ages.
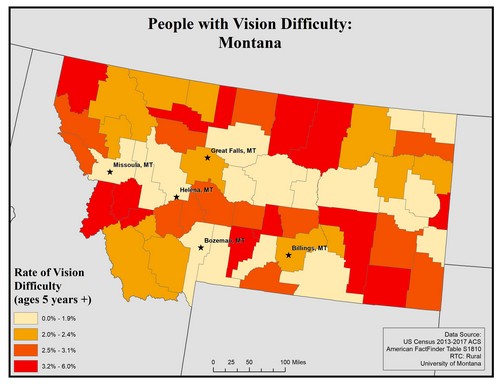
This map of the state of Montana shows the rate of vision difficulty by county. Rates are broken into four categories from 0.0 to 6.0%.
The five largest urban areas (Missoula, Helena, Great Falls, Bozeman, and Billings) are labeled on the map to show if there are any differences between rates in urban compared to rural areas. The lowest rates of 0.0 to 1.9% occur mostly in the central and southern counties of the state. The counties with the highest rates of 3.2 to 6.0% are spread unevenly across the state.
Map produced December 2019 based on 2013-2017 American Community Survey data.
- Click on the map for a larger, downloadable version.
- To browse or download the data used to make this map, use our Disability Data Lookup Tool.
-
This map explores the American Community Survey (ACS) 5-year data (Table S1810) on disability estimates by county.
For hearing difficulty the ACS asks if a respondent is deaf or has serious difficulty hearing. If they answer “yes” they are classified as having a hearing difficulty. This data is for all ages.
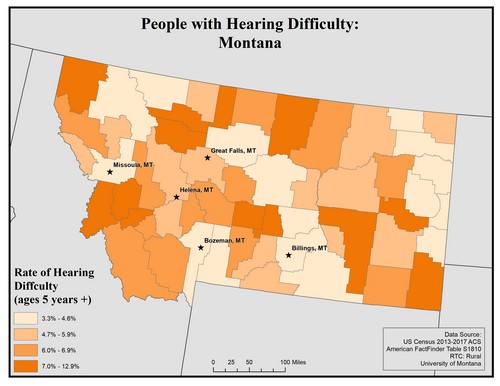
This map of the state of Montana shows the rate of hearing difficulty by county. Rates are broken into four categories from 3.3 to 12.9%.
The five largest urban areas (Missoula, Helena, Great Falls, Bozeman, and Billings) are labeled on the map to show if there are any differences between rates in urban compared to rural areas. Three of the five most populous cities are in counties with the lowest rates of 3.3 to 4.6%. Patterns are largely uneven across this rural state.
Map produced December 2019 based on 2013-2017 American Community Survey data.
- Click on the map for a larger, downloadable version.
- To browse or download the data used to make this map, use our Disability Data Lookup Tool.
-
This map explores the American Community Survey (ACS) 5-year data (Table S1810) on disability estimates by county.
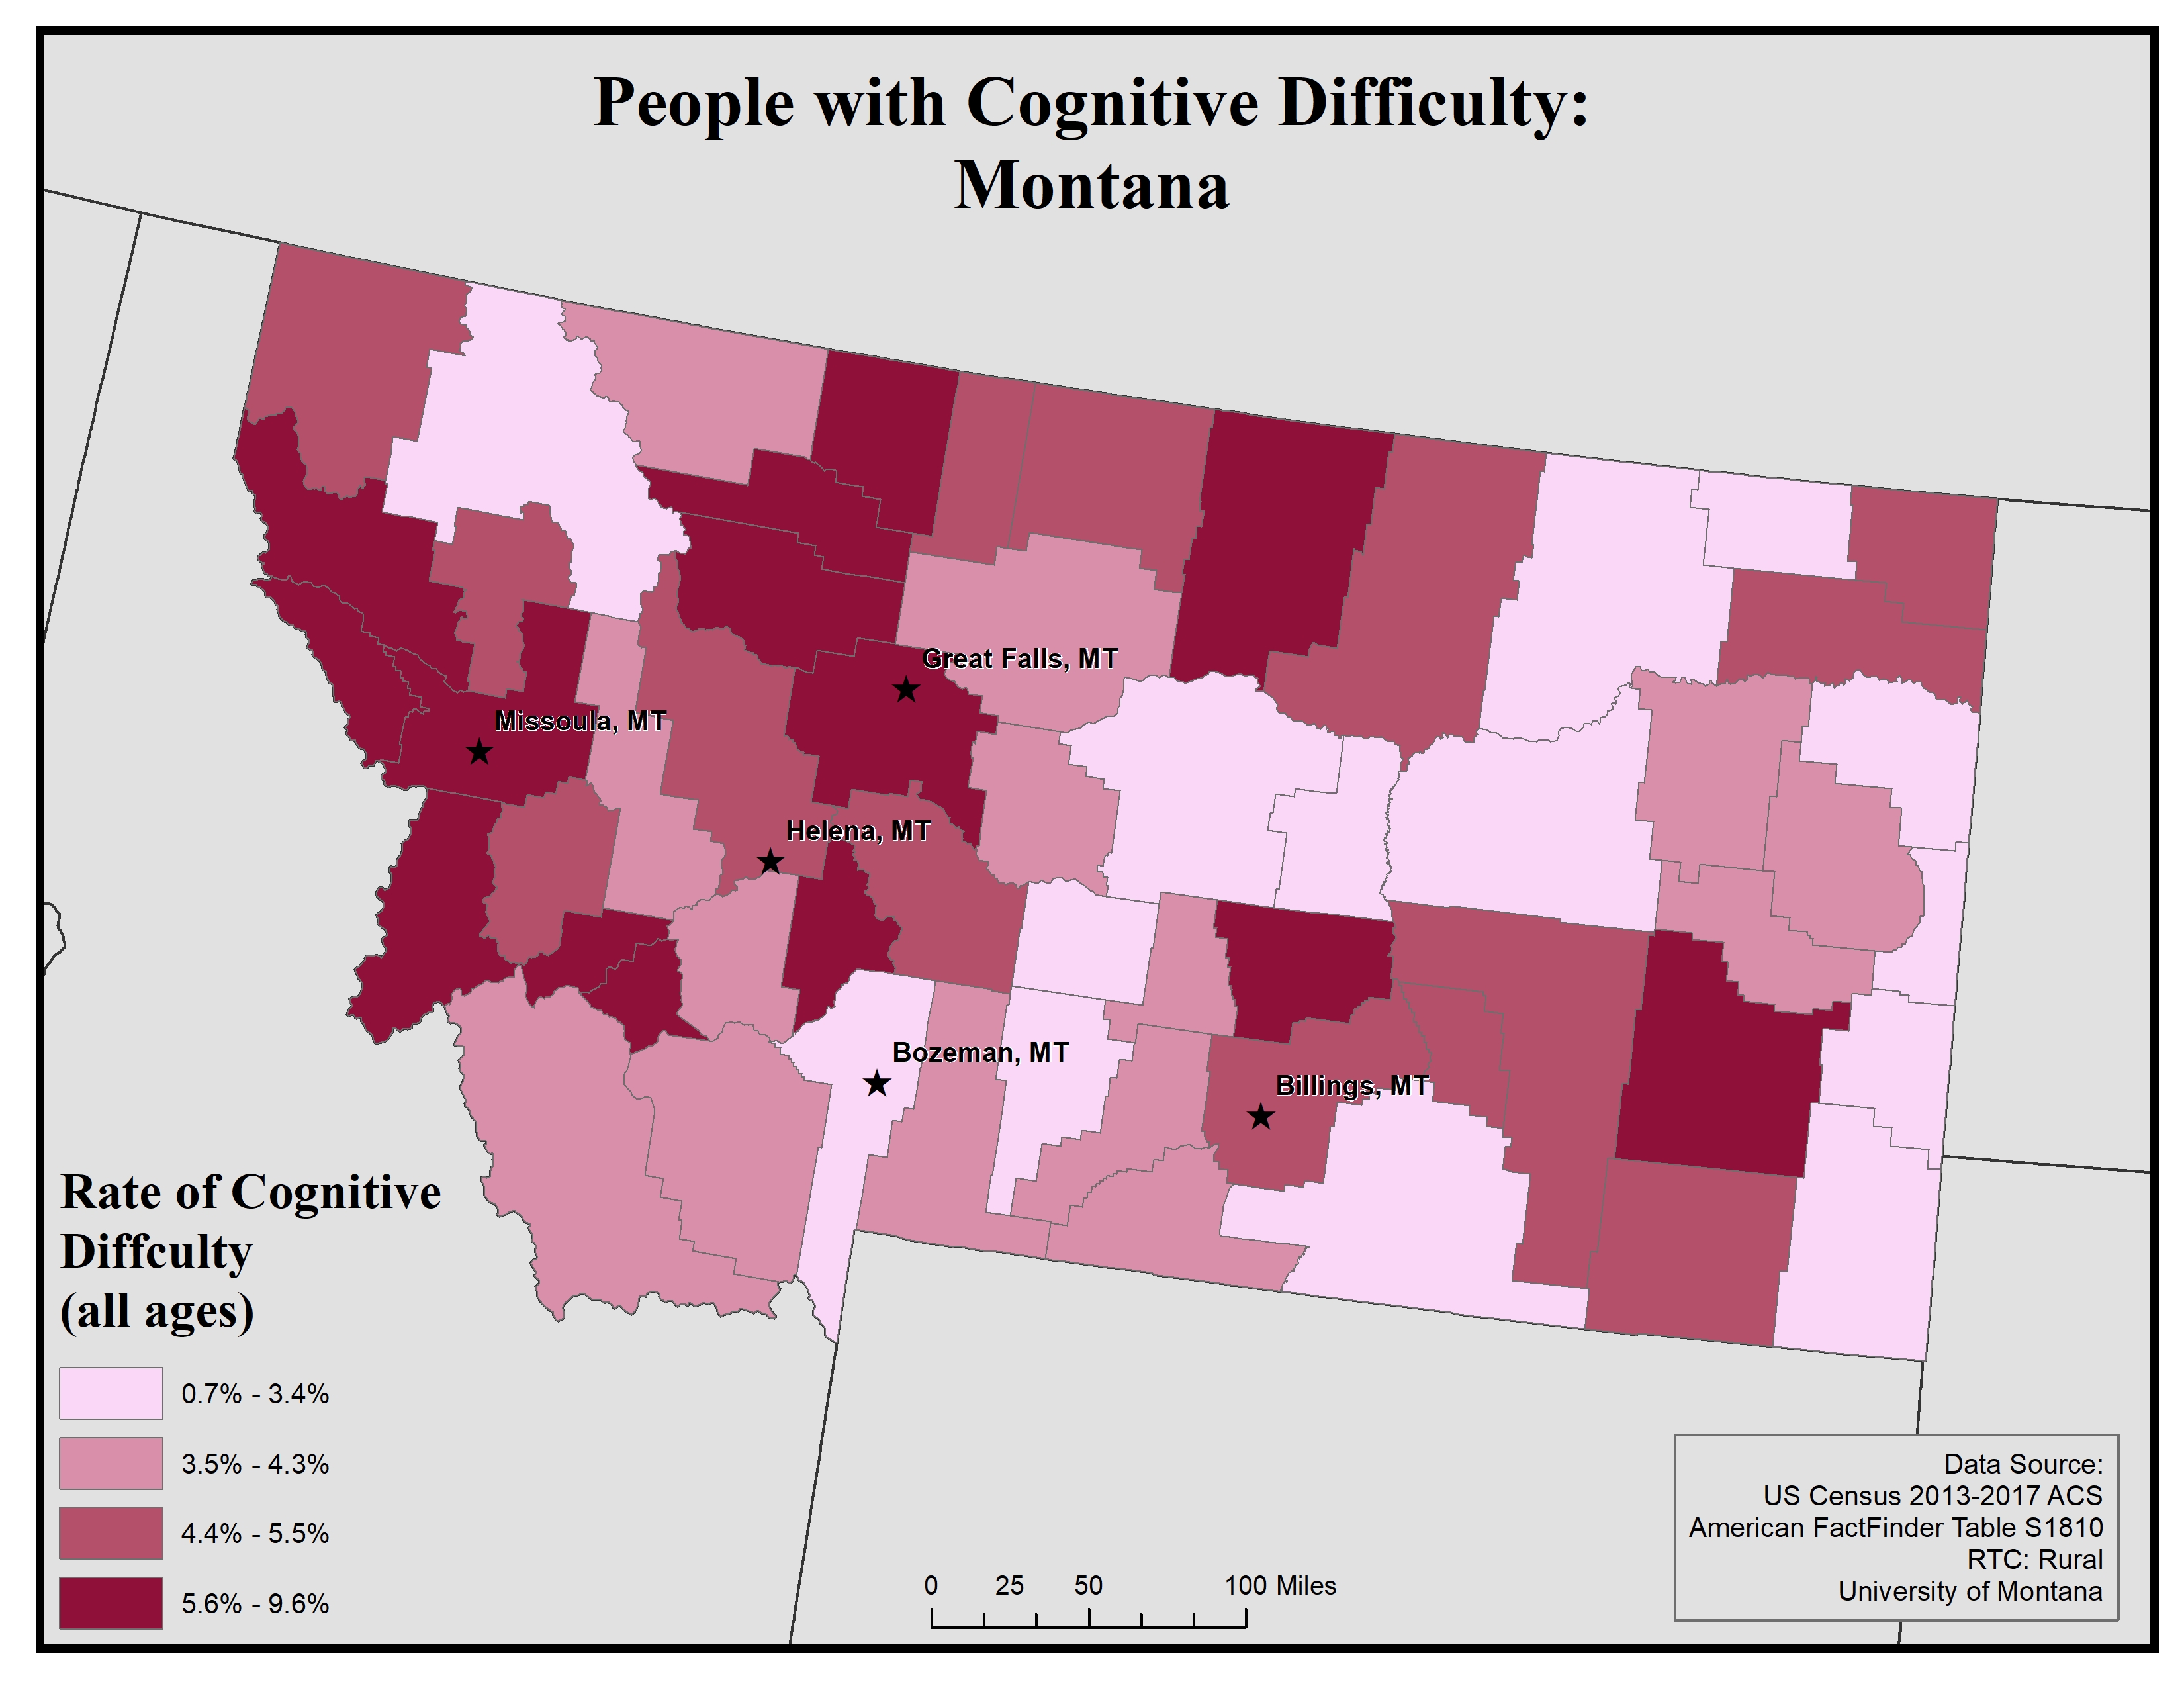
For cognitive difficulty the ACS asks because of a physical, mental, or emotional problem, does the respondent have difficulty remembering, concentrating, or making decisions. If they answer “yes” they are classified as having a cognitive difficulty. This data is for ages 5 and up.
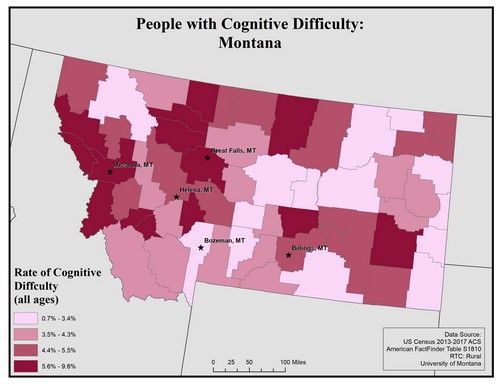
This map of the state of Montana shows the rate of cognitive difficulty by county. Rates are broken down into four categories from 0.7% to 9.6%.
The five largest urban areas (Missoula, Helena, Great Falls, Bozeman, and Billings) are labeled on the map to show if there are any differences between rates in urban compared to rural areas. Cognitive difficulty rates are actually higher in the counties surrounding four of the five most populous cities, a pattern not typically seen when mapping disability rates at the county level. Overall, patterns of cognitive difficulty rates are uneven across the state.
Map produced December 2019 based on 2013-2017 American Community Survey data.
- Click on the map for a larger, downloadable version.
- To browse or download the data used to make this map, use our Disability Data Lookup Tool.
-
This map explores the American Community Survey (ACS) 5-year data (Table S1810) on disability estimates by county.
For ambulatory (i.e. mobility) difficulty the ACS asks if a respondent has serious difficulty walking or climbing stairs. If they answer “yes” they are classified as having a mobility difficulty. This data is for ages 5 and up.
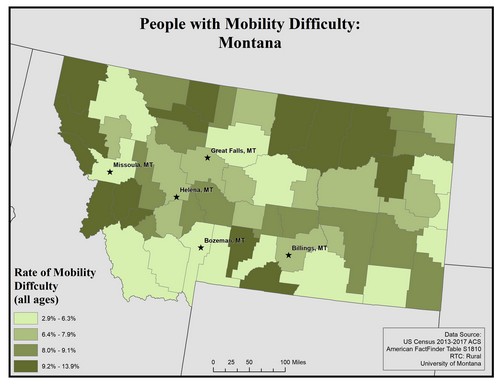
This map of the state of Montana shows the rate of mobility difficulty by county. Rates are broken down into four categories from 2.9 to 13.9%.
The five largest urban areas (Missoula, Helena, Great Falls, Bozeman, and Billings) are labeled on the map to show if there are any differences between rates in urban compared to rural areas. Mobility difficulty rates for the counties with the five most populous cities fall into the two lowest categories from 2.9 to 7.9%. There are large cluster of counties displaying the highest rate of 9.2 to 13.9% in the northern and western parts of the state, with some also in the southern part of the state.
Map produced December 2019 based on 2013-2017 American Community Survey data.
- Click on the map for a larger, downloadable version.
- To browse or download the data used to make this map, use our Disability Data Lookup Tool.
-
This map explores the American Community Survey (ACS) 5-year data (Table S1810) on disability estimates by county.
For self-care difficulty the ACS asks if a respondent has difficulty bathing or dressing. If they answer “yes” they are classified as having a self-care difficulty. This data is for ages 5 and up.
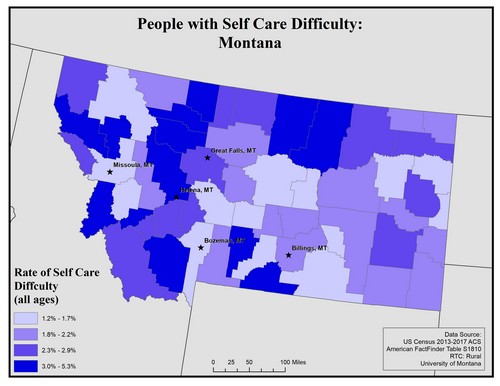
This map of the state of Montana shows the rate of self care difficulty by county. Rates are broken down into four categories from 1.2 to 5.3%. The five largest urban areas (Missoula, Helena, Great Falls, Bozeman, and Billings) are labeled on the map to show if there are any differences between rates in urban compared to rural areas. Overall, the pattern of rates of self care difficulty are uneven across the state. Rates tend to be higher for the counties with the top five populous states, with the exception of Missoula and Bozeman.
Map produced December 2019 based on 2013-2017 American Community Survey data.
- Click on the map for a larger, downloadable version.
- To browse or download the data used to make this map, use our Disability Data Lookup Tool.
-
This map explores the American Community Survey (ACS) 5-year data (Table S1810) on disability estimates by county.
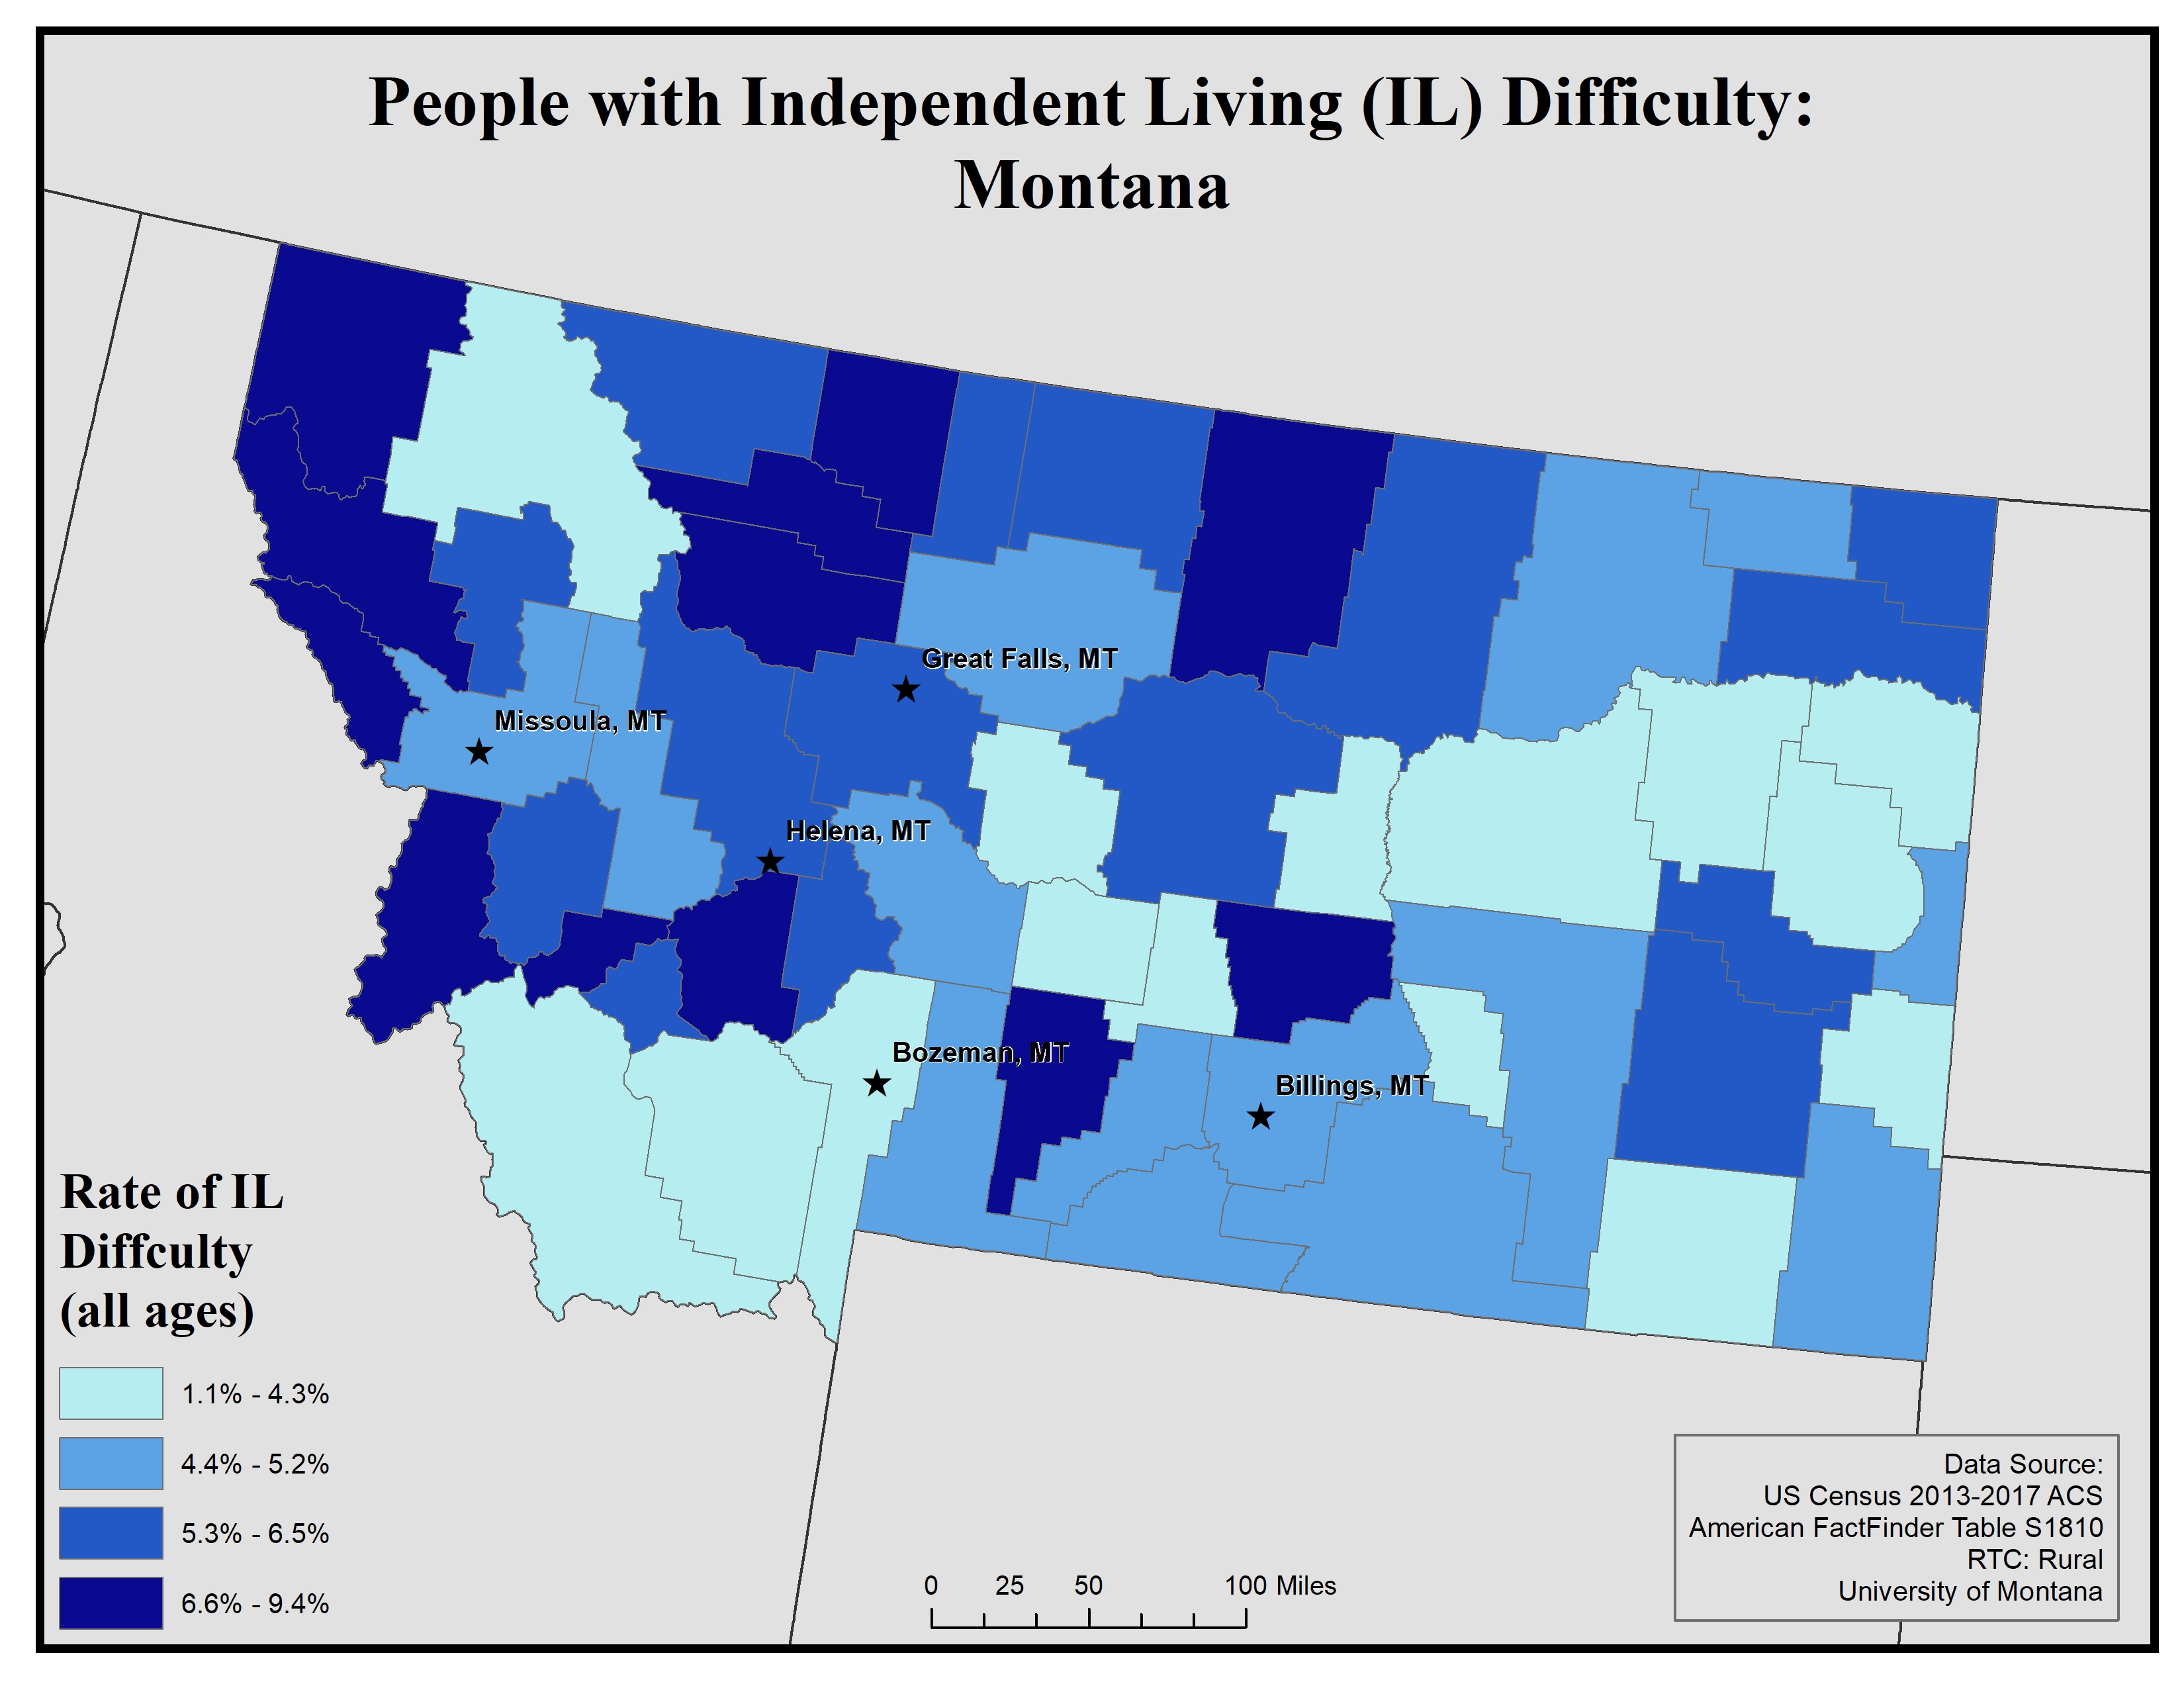
For independent living difficulty the ACS asks because of a physical, mental, or emotional problem, does the respondent have difficulty doing errands alone such as visiting a doctor’s office or shopping. If they answer “yes” they are classified as having an independent living difficulty. This data is for ages 18 and up.
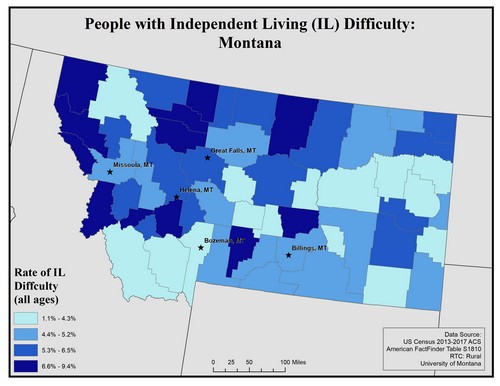
This map of the state of Montana shows the rate of independent living difficulty by county. Rates are broken down into four categories from 1.1 to 9.4%. The five largest urban areas (Missoula, Helena, Great Falls, Bozeman, and Billings) are labeled on the map to show if there are any differences between rates in urban compared to rural areas. The highest rates of 6.6 to 9.4% are concentrated in the central and western counties of the state. The five most populous cities are in counties with rates ranging from 4.4 to 5.2% and 5.3 to 6.5%. There is an uneven pattern across the state of the lowest rates of 1.1 to 4.3%.
Map produced December 2019 based on 2013-2017 American Community Survey data.
- Click on the map for a larger, downloadable version.
- To browse or download the data used to make this map, use our Disability Data Lookup Tool.