The maps on this page explore the American Community Survey 5-year data (Table S1810) on disability by county.
The ACS does not directly measure disability. Instead, it uses a ;set of disability indicator questions related to difficulty and functional impairment to identify individuals who may experience a disability. If a respondent can answer “yes” to any disability question they are classified as having a disability.
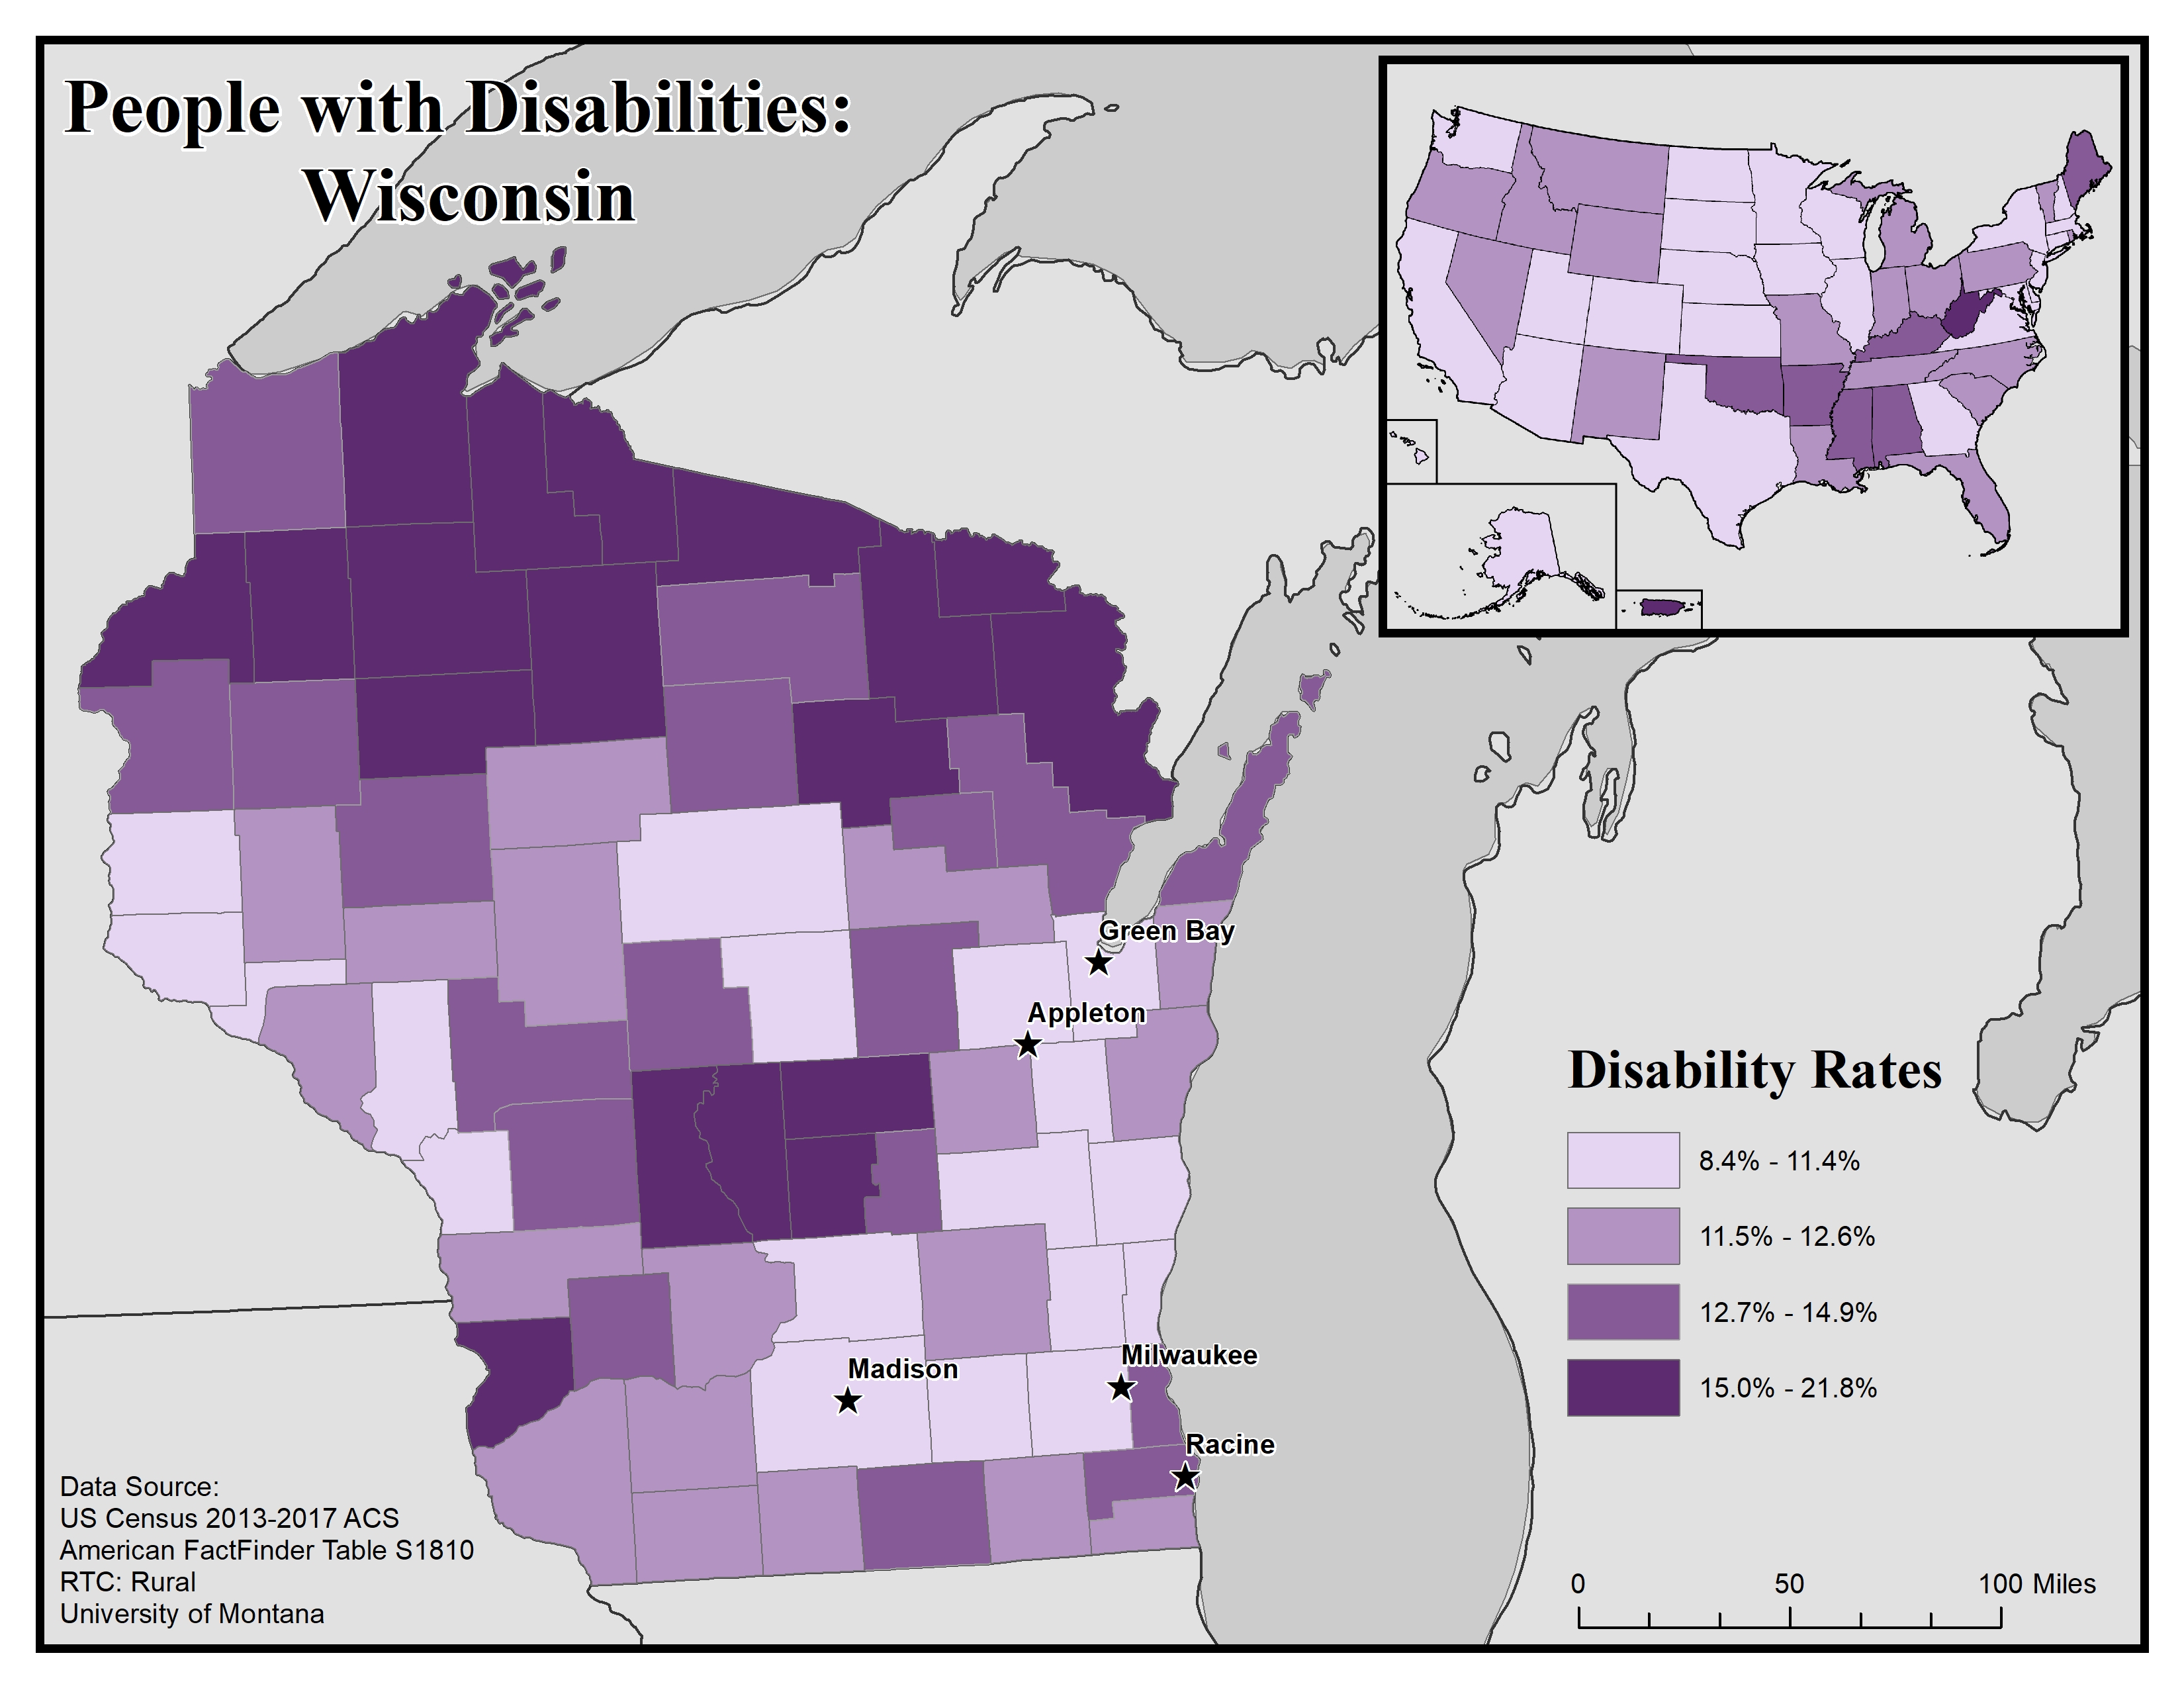
Disability Rates: Wisconsin
-
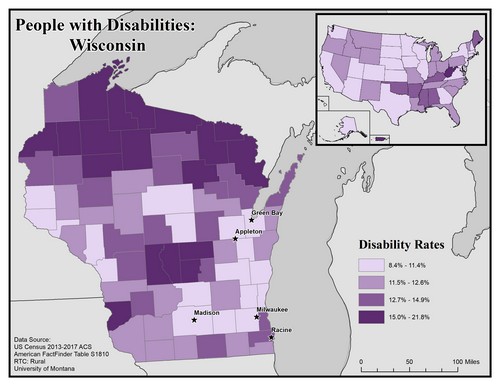
This map of Wisconsin shows general rates of disability across the state at the county level. Disability rates are broken into four categories, from 9.6 to 28.9%.
The five largest urban areas (Racine, Milwaukee, Madison, Appleton, and Green Bay) are labeled to show if there are any differences between disability rates in urban vs rural areas. Disability rates tend to be higher in rural areas than urban ones. The lowest rates of 8.4 to 11.4% are mainly found in the counties surrounding each of the five largest urban areas and tend to occur in clusters across the state. The highest rates of 15.0 to 21.8% can be observed in the central and northern parts of the state.
In the upper corner is an inset map of the United States showing how overall general disability rates in Wisconsin compare to the rest of the country. Overall, general disability rates in Wisconsin are in the lowest category (out of four) compared to the rest of the U.S.
Map produced October 2019 based on 2013-2017 American Community Survey data.
- Click on the map for a larger, downloadable version.
- To browse or download the data used to make this map, use our Disability Data Lookup Tool.
-
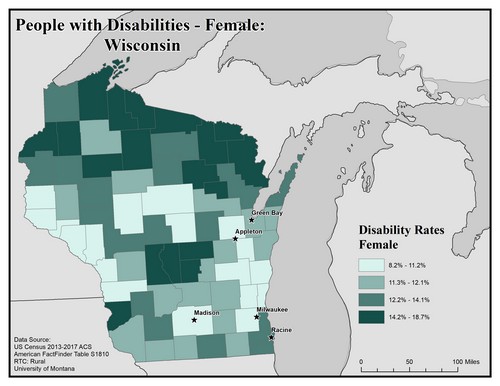
This map of the state of Wisconsin shows disability rate among females by county. Rates are broken into four categories from 8.2% to 18.7%.
Overall, there are higher rates of females with disabilities in rural counties than in urban ones. There is a pocket of counties with the highest rate of 14.2% to 18.7% in the north near the Michigan border.
The five largest urban areas (Racine, Milwaukee, Madison, Appleton, and Green Bay) are labeled on the map to show if there are any differences between rates in urban compared to rural areas. Appleton, Milwaukee and Madison are in counties with the lowest rate of 8.2% to 11.2%, Green Bay is in a county with the second lowest rate of 11.3% to 12.1%, and Racine is in a county with the second highest rate of 12.2% to 14.1%.
Map produced February 2020 based on 2013-2017 American Community Survey data.
- Click on the map for a larger, downloadable version.
- To browse or download the data used to make this map, use our Disability Data Lookup Tool.
- For information on how biological sex is used and defined in the ACS, see “American Community Survey and Puerto Rico Community Survey 2017 Subject Definitions” page 125.
-

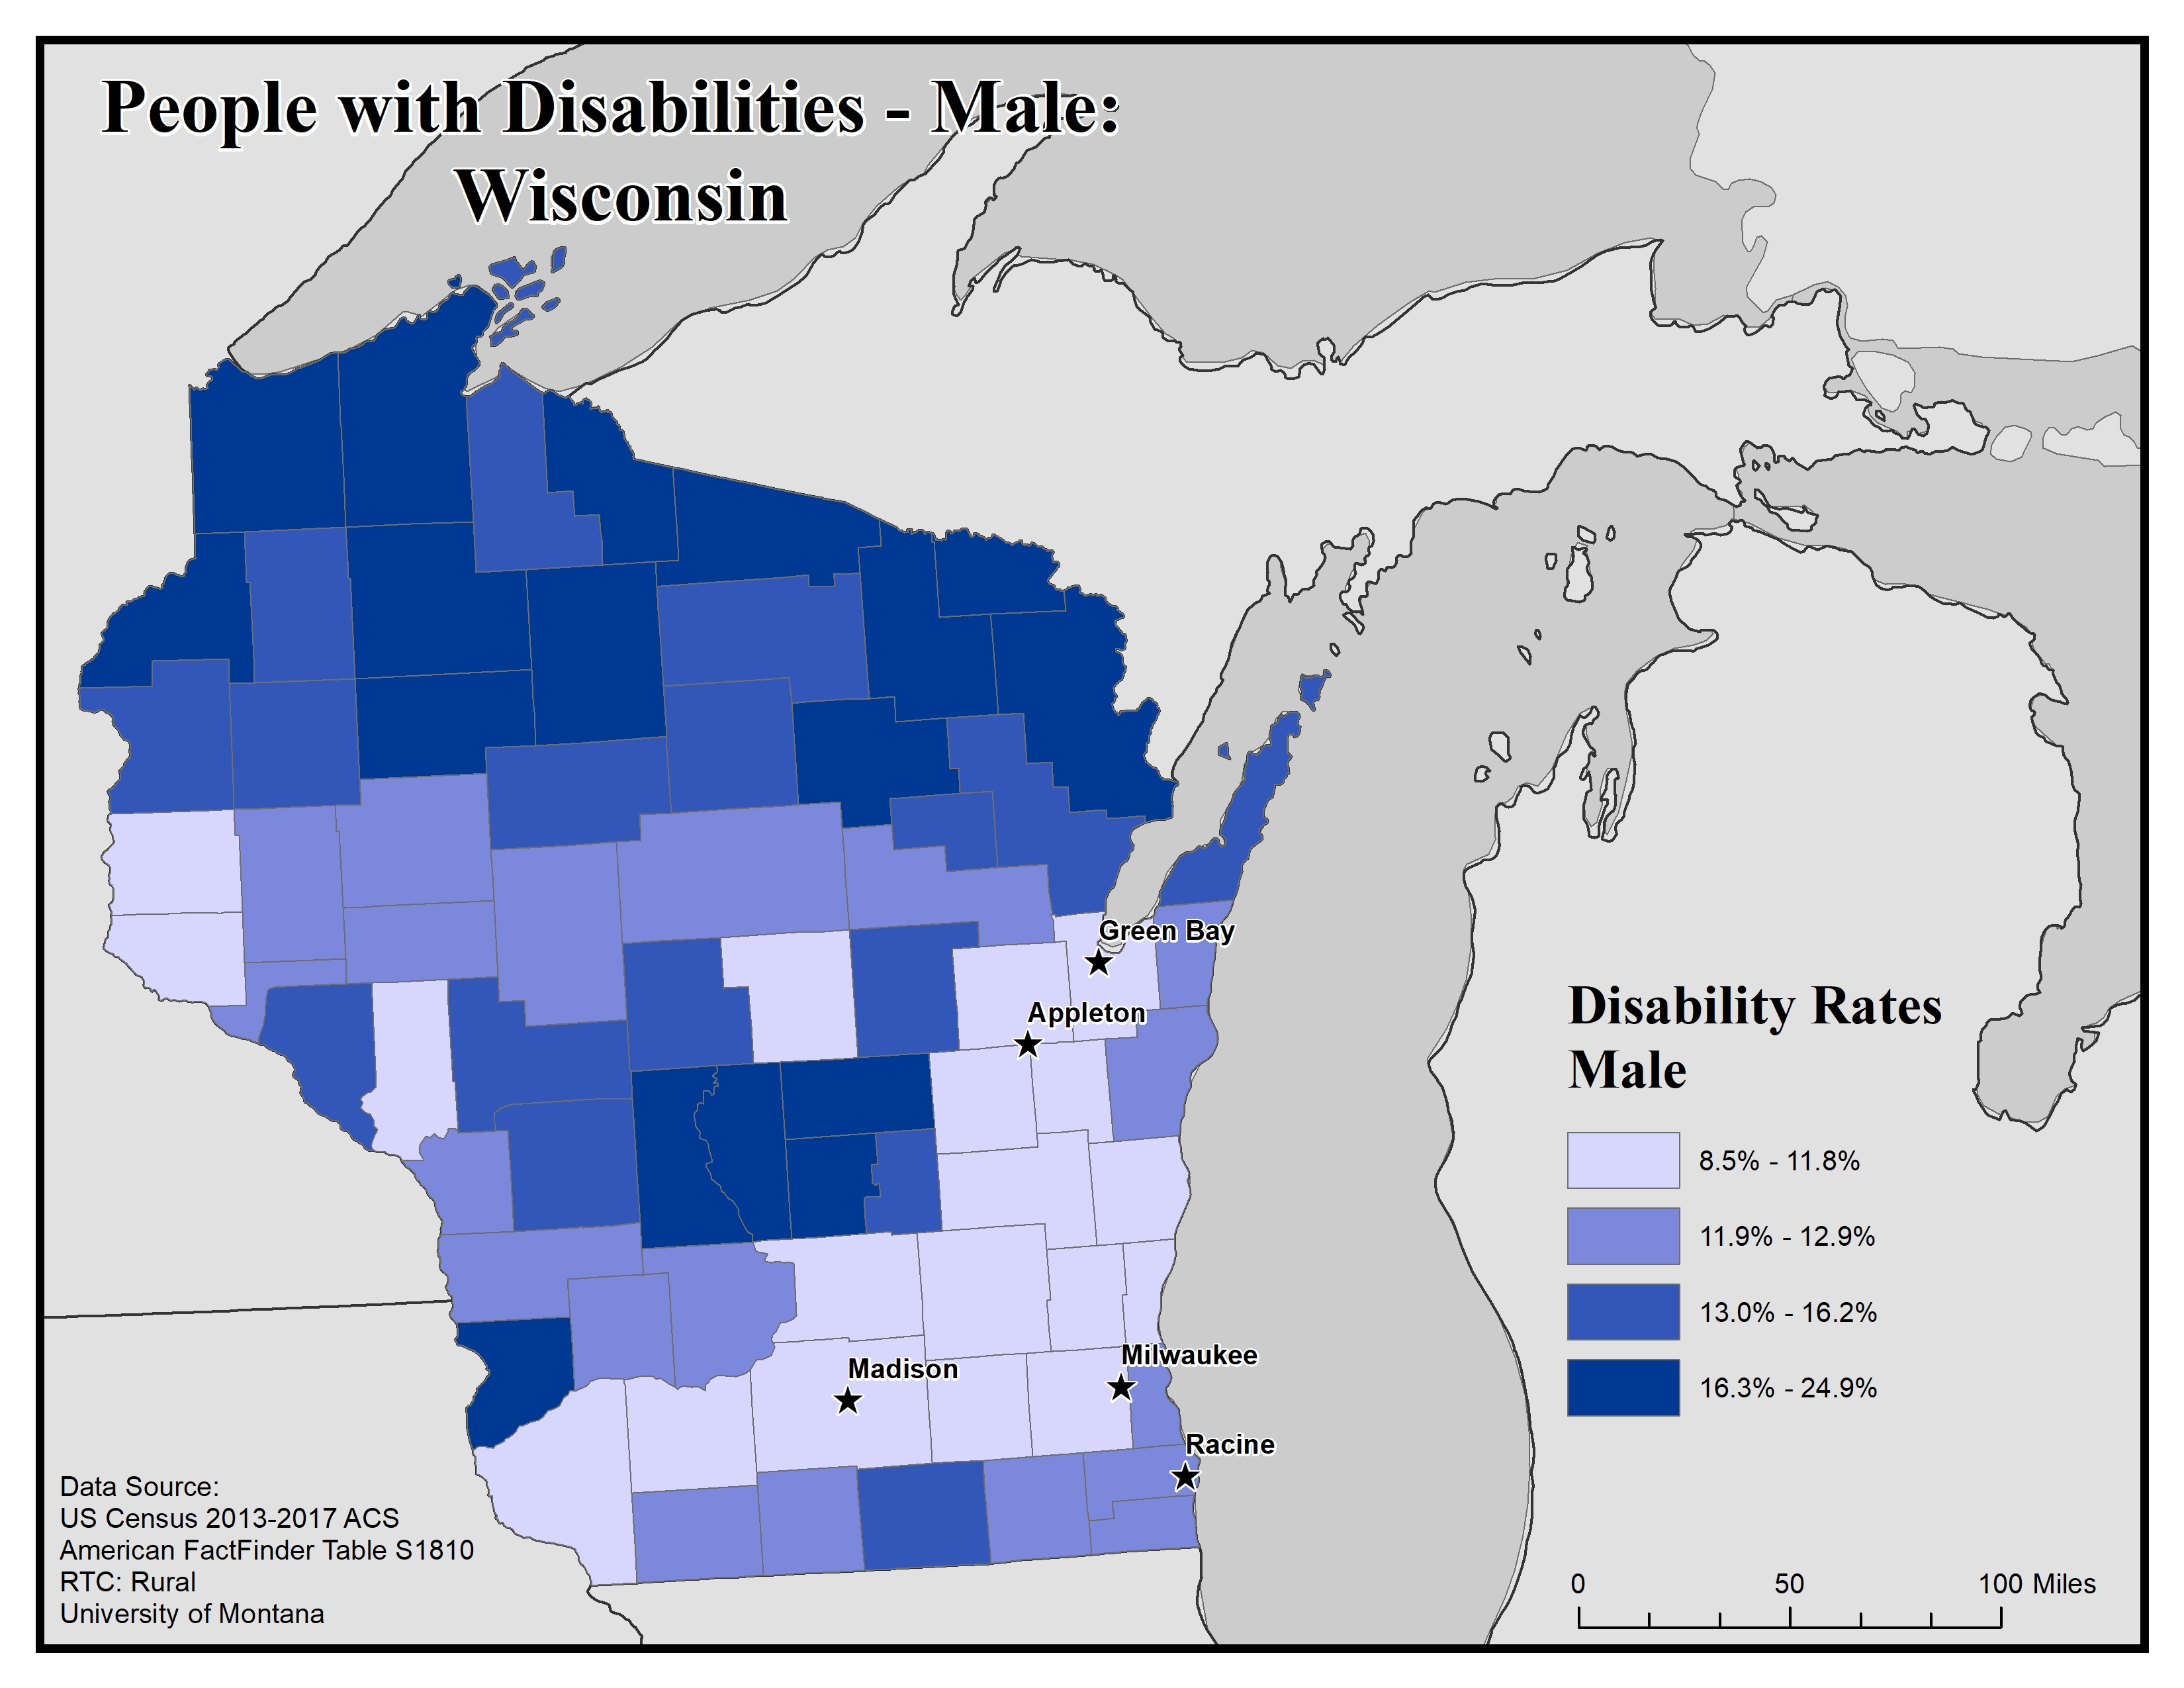
This map of the state of Wisconsin shows disability rate among males by county. Rates are broken into four categories from 8.5% to 24.9%.
Overall, there are higher rates of males with disabilities in rural counties than in urban ones. The highest rates are in counties along the northern border, with rates of 16.3% to 24.9%. There are a few central counties in the highest bracket as well.
The five largest urban areas (Racine, Milwaukee, Madison, Appleton, and Green Bay) are labeled on the map to show if there are any differences between rates in urban compared to rural areas. Racine is in a county with the second lowest rate of 11.9% to 12.9%, while Milwaukee, Appleton, Green Bay and Madison are in counties with the lowest rates of 8.5% to 11.8%.
Map produced February 2020 based on 2013-2017 American Community Survey data.
- Click on the map for a larger, downloadable version.
- To browse or download the data used to make this map, use our Disability Data Lookup Tool.
- For information on how biological sex is used and defined in the ACS, see “American Community Survey and Puerto Rico Community Survey 2017 Subject Definitions” page 125.
-
This map explores the American Community Survey (ACS) 5-year data (Table S1810) on disability estimates.
The ACS asks a set of disability indicator questions to determine disability. If a respondent can answer “yes” to any disability question they are classified as having a disability. The data below are for ages 18 and over.
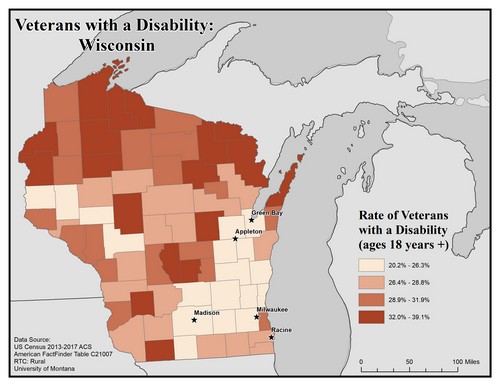
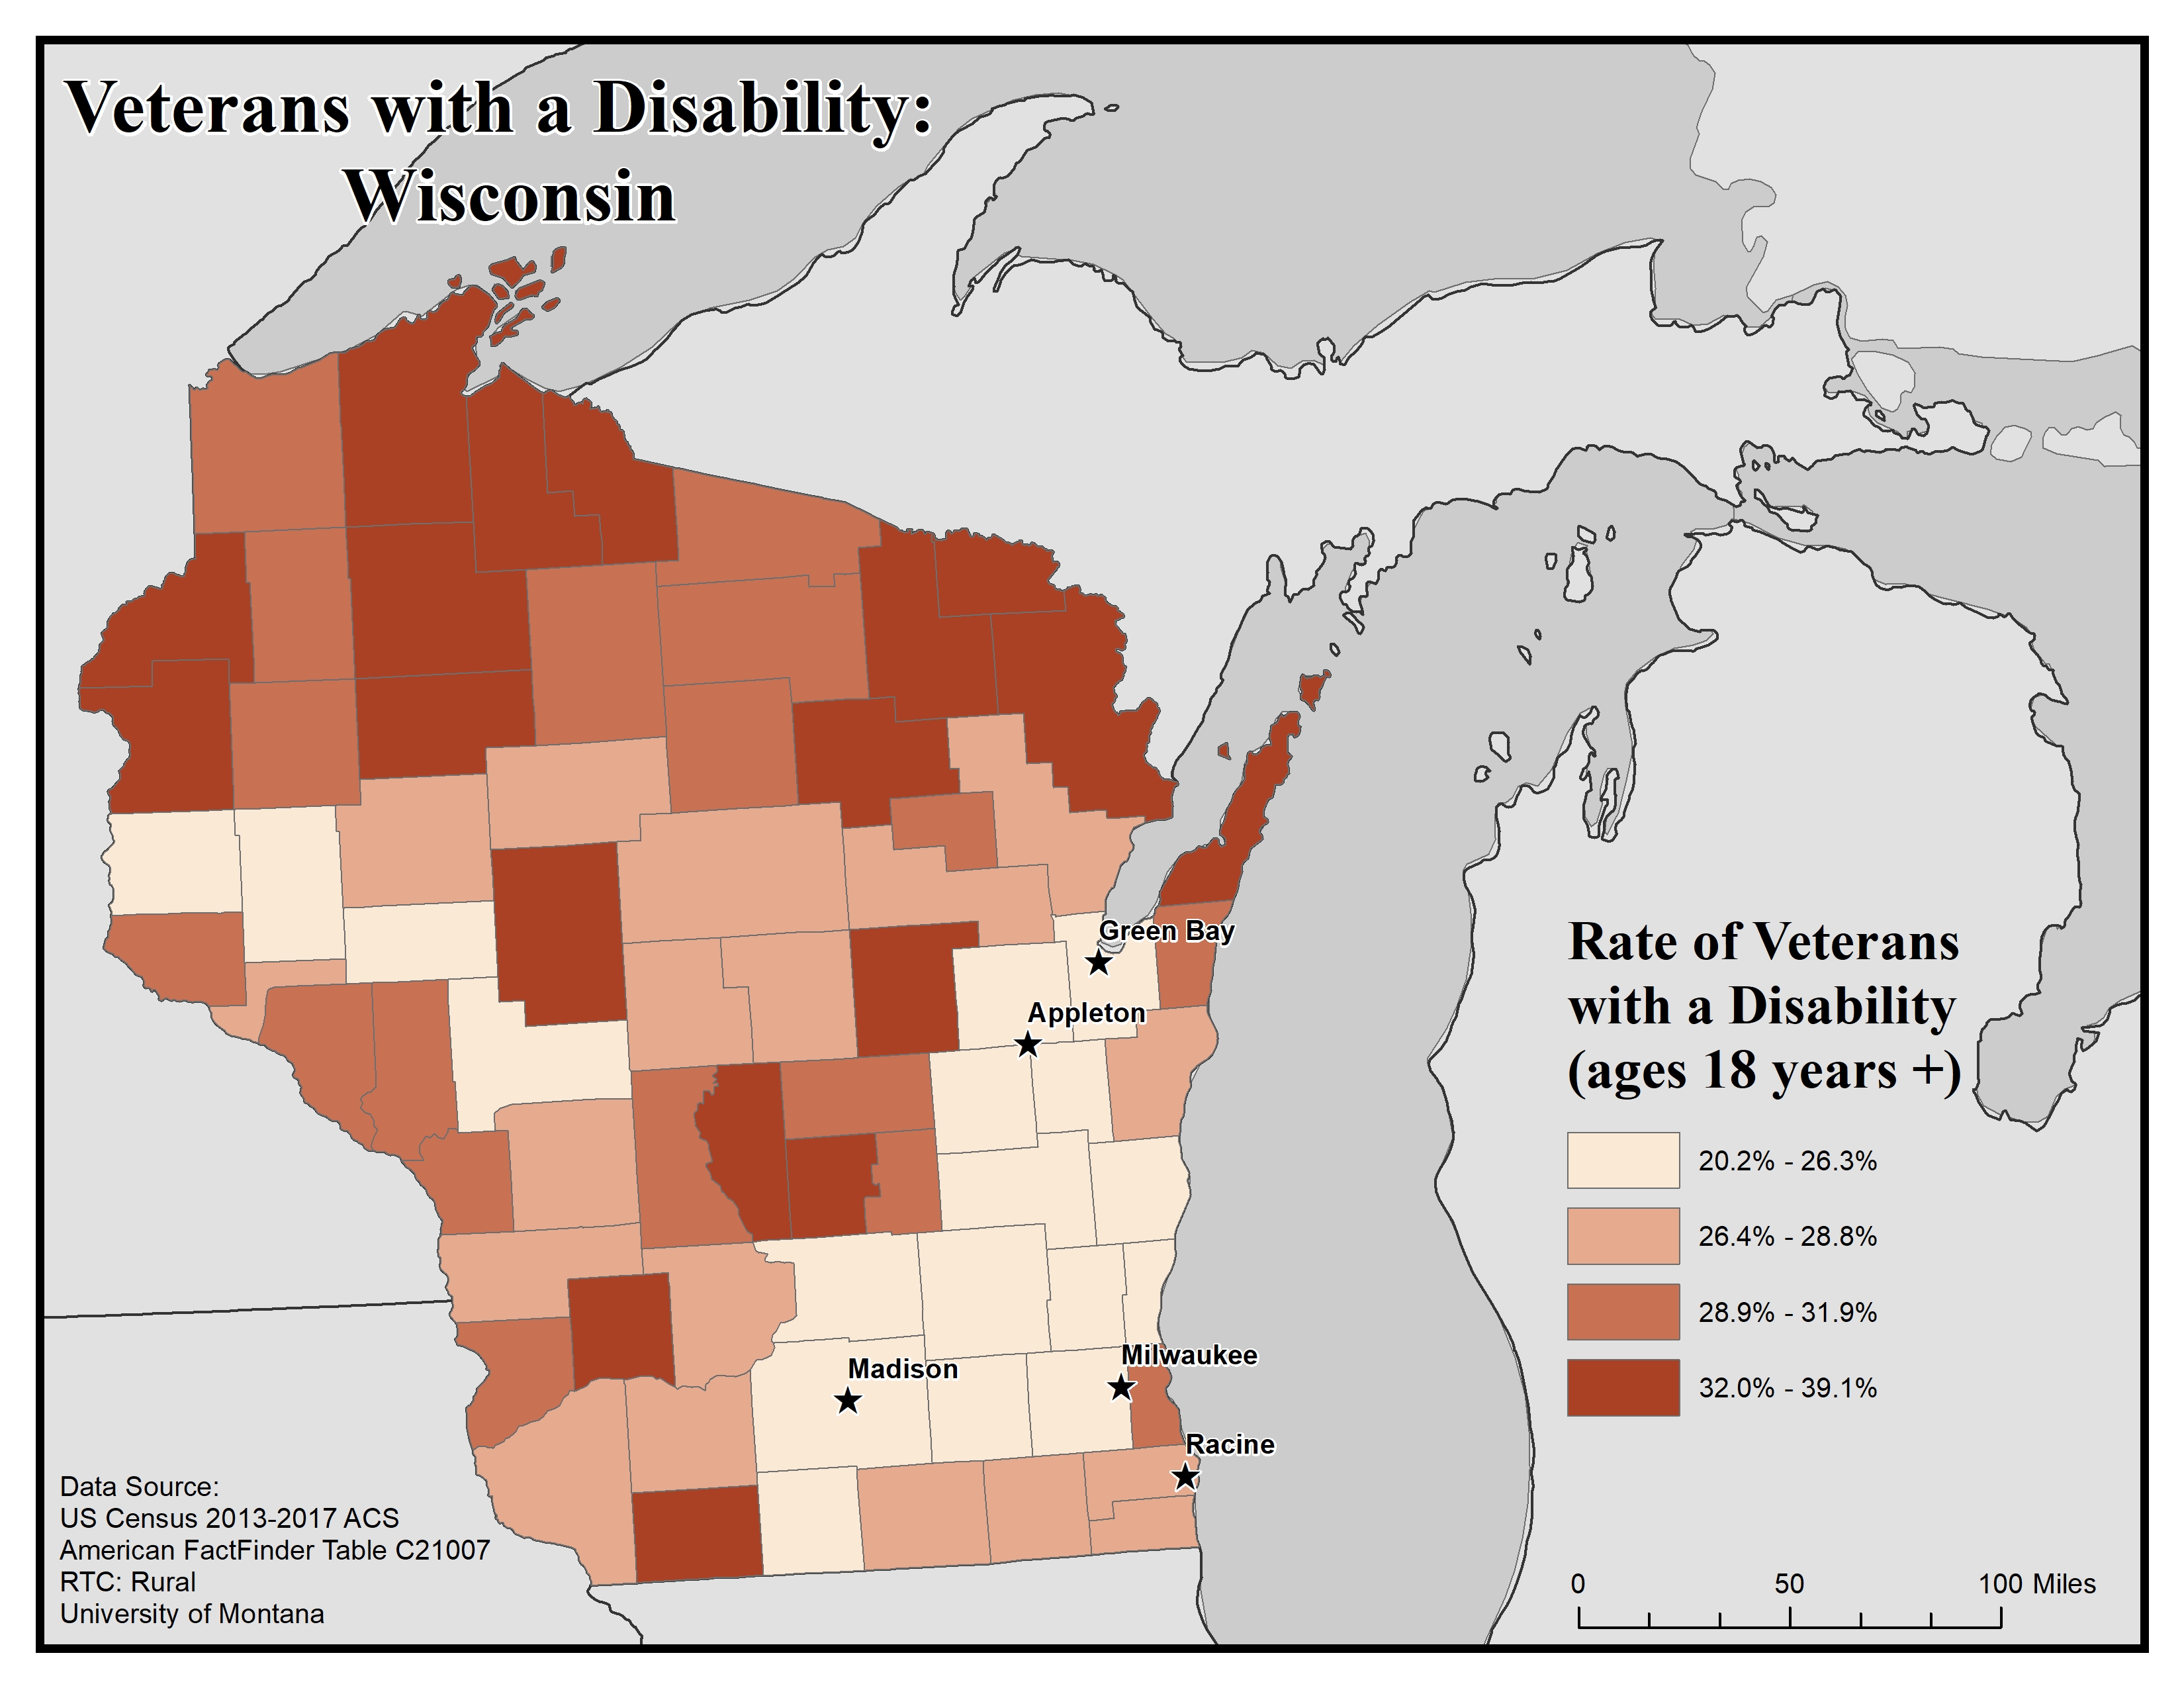
This map of the state of Wisconsin shows rates of disability among veterans aged 18 and older by county. Rates are broken into four categories from 20.2% to 39.1%.
The five largest urban areas (Racine, Milwaukee, Madison, Appleton, and Green Bay) are labeled on the map to show if there are any differences between rates in urban compared to rural areas. Overall, there are higher rates of veterans with disabilities in rural counties than urban ones, with a concentration mostly in the northern part of the state.
Racine is in a county with the second lowest rate of 26.4% to 28.8%. The other cities, Green Bay, Appleton, Madison and Milwaukee are in counties with the lowest rate of 20.2% to 26.3%.
Map produced February 2020 based on 2013-2017 American Community Survey data.
- Click on the map for a larger, downloadable version.
- To browse or download the data used to make this map, use our Disability Data Lookup Tool.
-
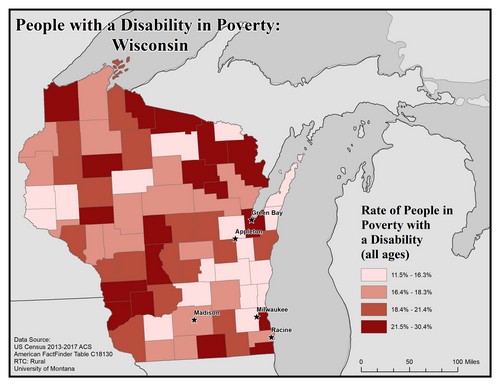
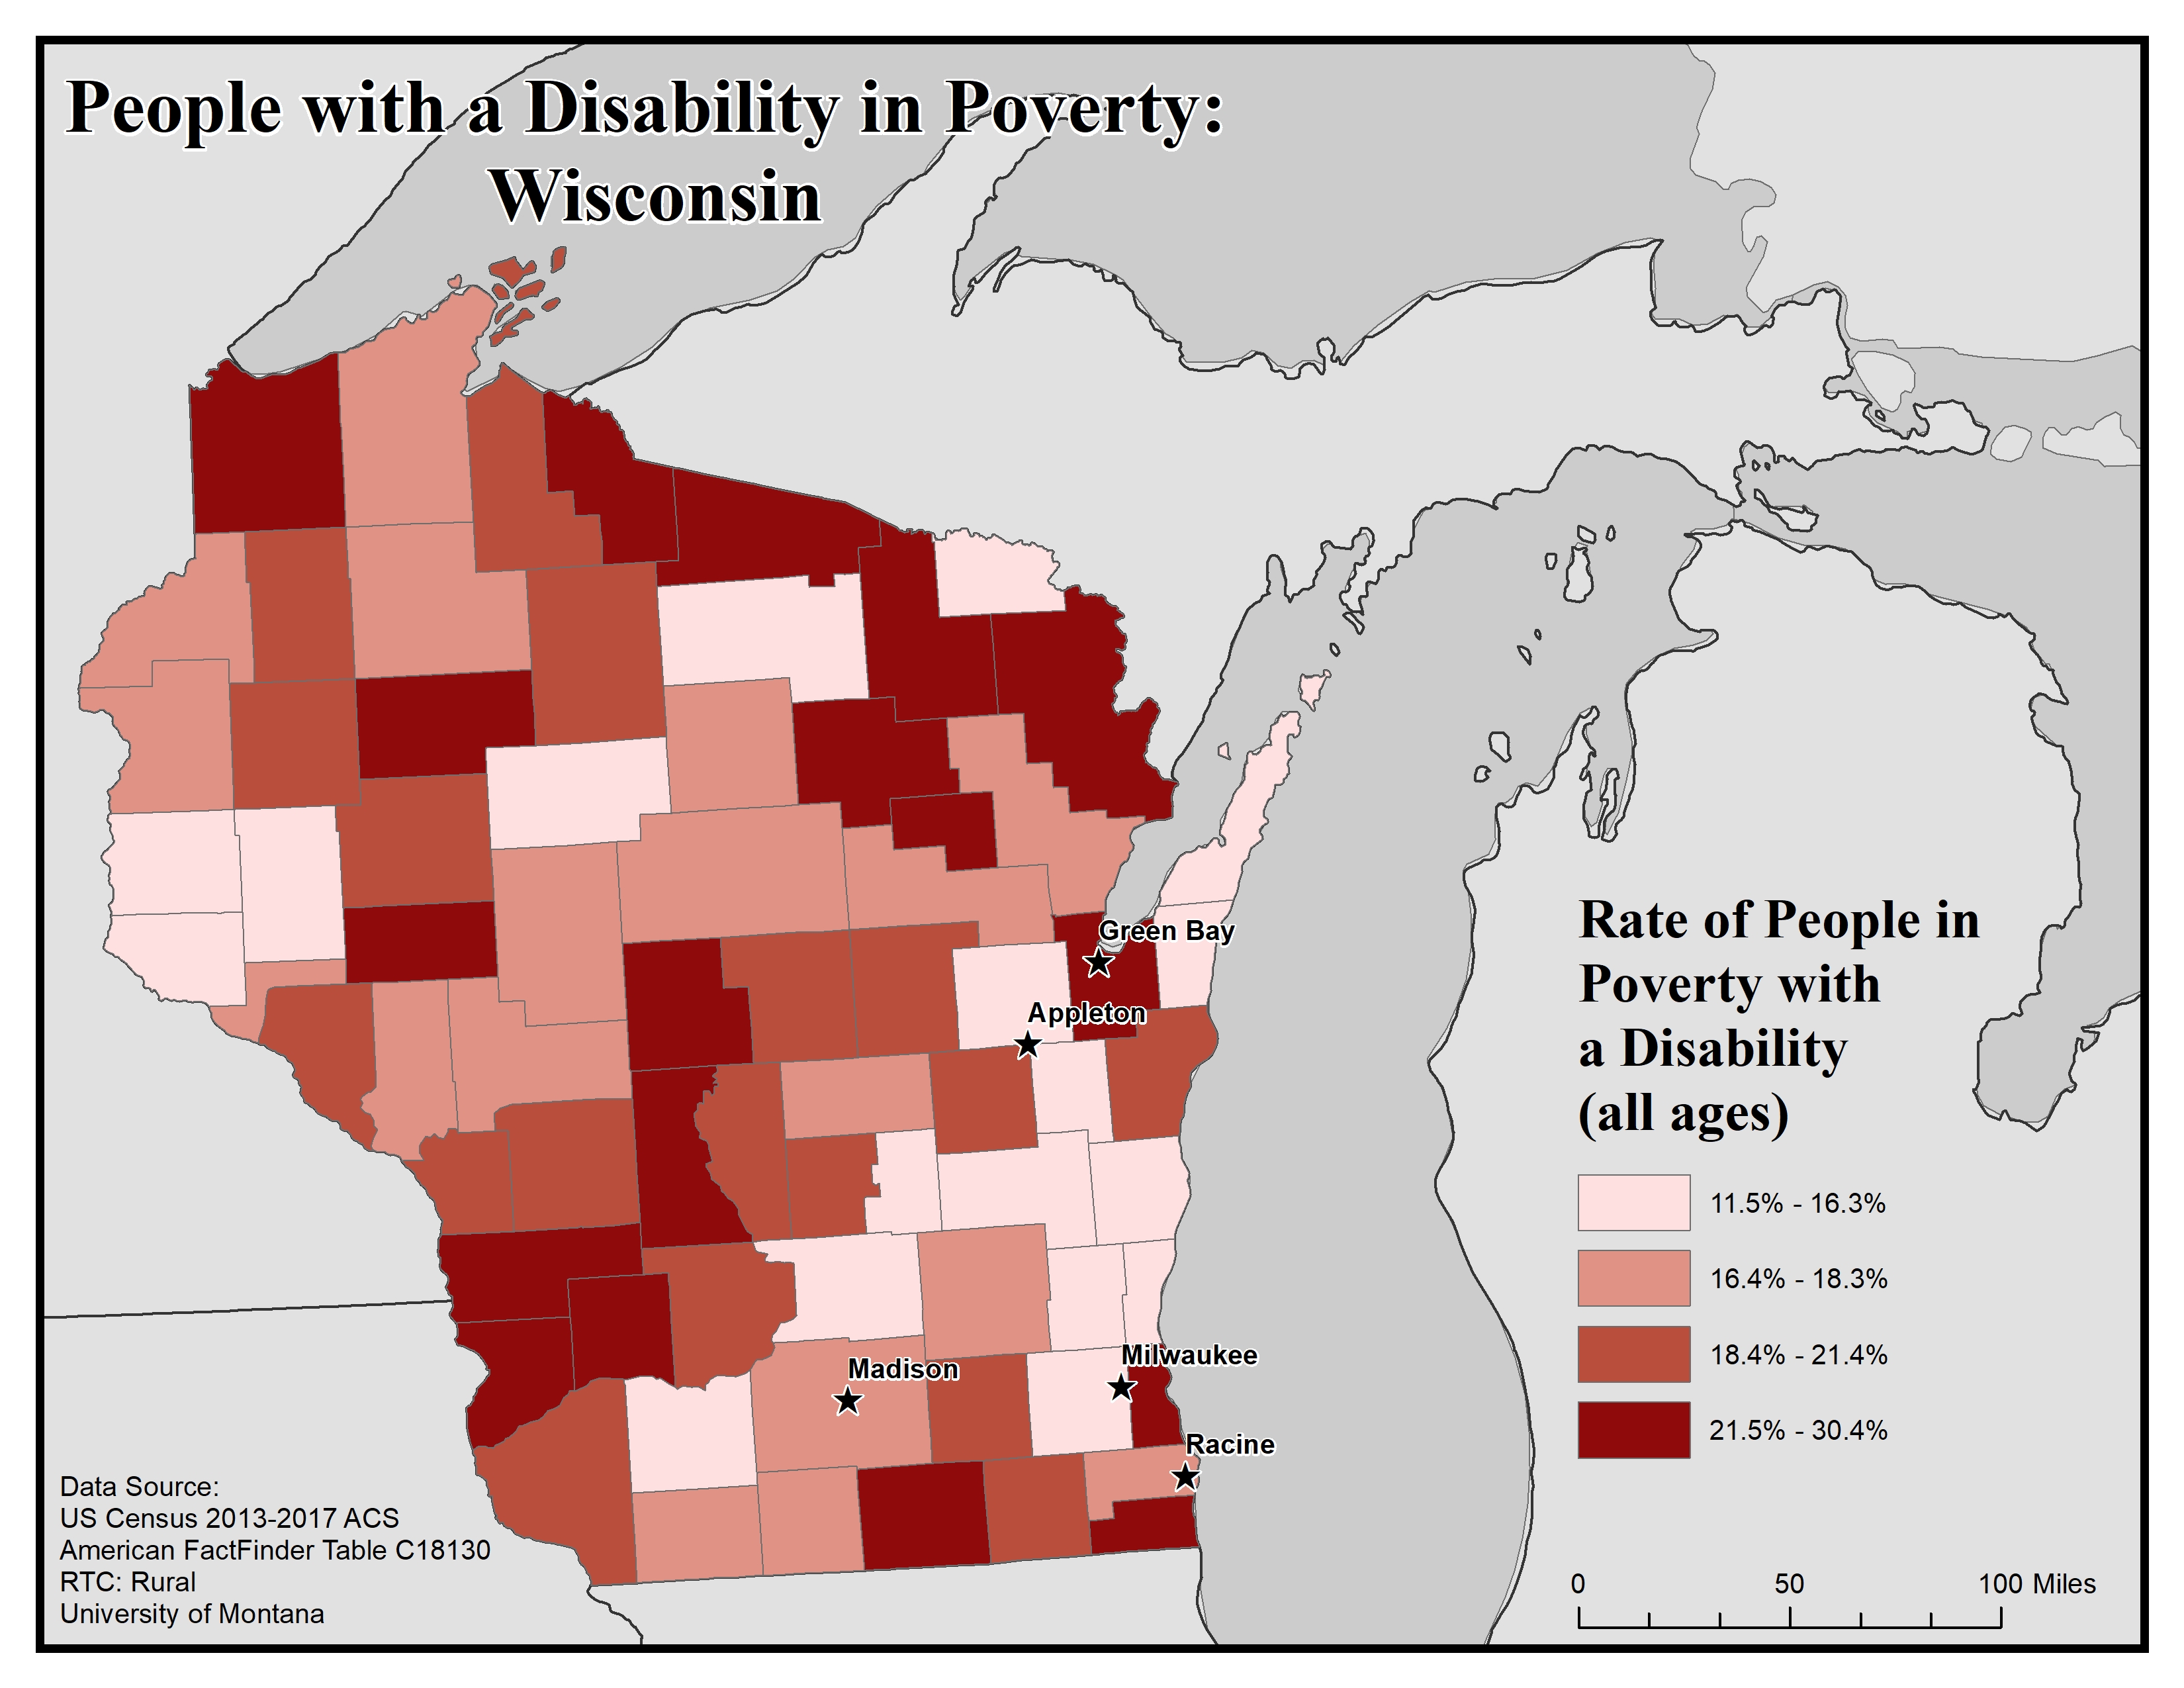
This map of the state of Wisconsin shows poverty rates among people with disabilities of all ages by county. Poverty rates are broken into four levels from 11.5% to 16.3%.
The five largest urban areas (Racine, Milwaukee, Madison, Appleton, and Green Bay) are labeled on the map to show if there are any differences between rates in urban compared to rural areas. Rates are mixed across the state.
Green Bay is in a county with the highest rate of 21.5% to 30.4%. Racine and Madison are in counties with the second lowest rate, 16.4% to 18.3%. Appleton and Milwaukee are in counties with the lowest rate of 11.5% to 16.3%.
Map produced February 2020 based on 2013-2017 American Community Survey data.
- Click on the map for a larger, downloadable version.
- To browse or download the data used to make this map, use our Disability Data Lookup Tool.

Employment: Wisconsin
-
This map explores American Community Survey (ACS) 5-year data (Table C18120) employment estimates by disability type.
The ACS asks a set of disability indicator questions to determine disability. If a respondent can answer “yes” to any disability question they are classified as having a disability. The data below are for ages 18-64.
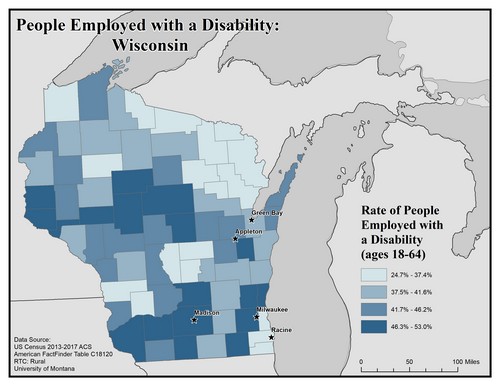
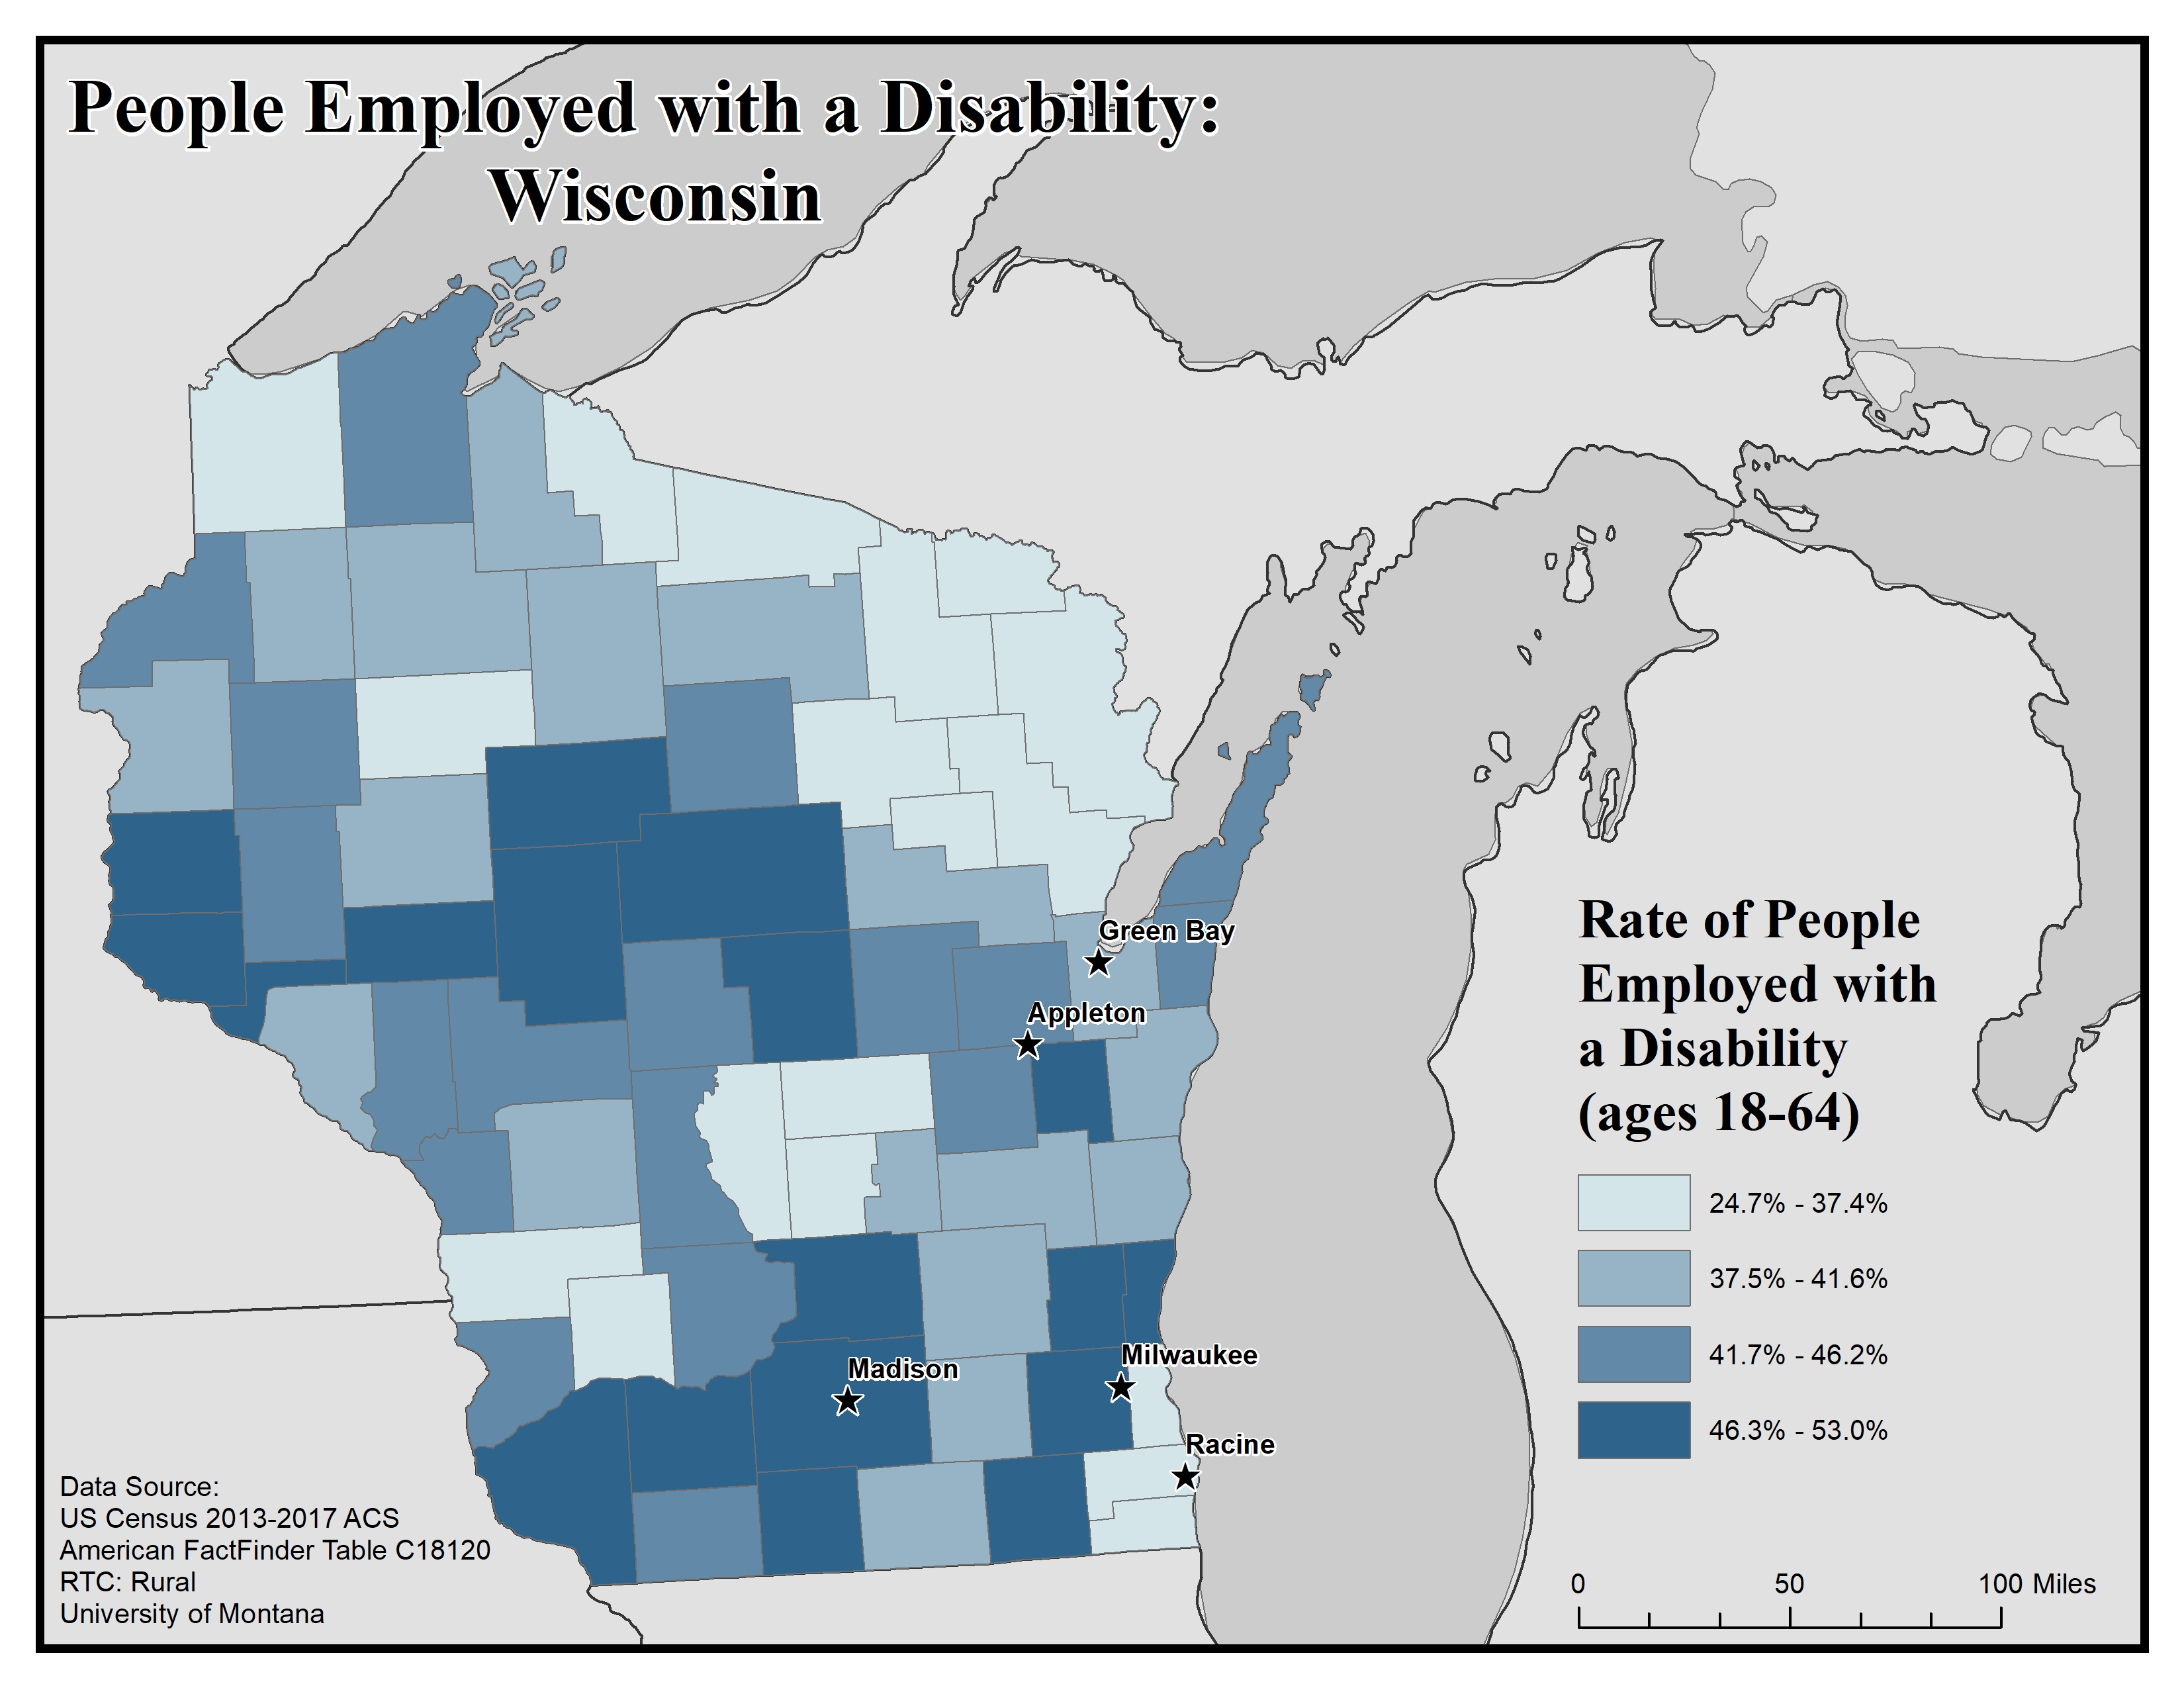
This map of Wisconsin shows employment rates among people with disabilities. The data includes people ages 18 to 64. Rates are broken into four categories ranging from 24.7% to 53.0%.
The highest rates of employment are mostly in the central southeast, but there are a few other counties in the highest bracket across the state.
The five largest urban areas (Racine, Milwaukee, Madison, Appleton, and Green Bay) are labeled on the map to show if there are any differences between rates in urban compared to rural areas.
Racine is in a county with the lowest rate, 24.7% to 37.4%. Green Bay is in a county with the second lowest rate, 37.5% to 41.6%. Appleton is in a county with the second highest rate of 41.7% to 46.2%. Madison and Milwaukee are in counties with the highest rate of 46.3% to 53.0%.
Map produced February 2020 based on 2013-2017 American Community Survey data.
- Click on the map for a larger, downloadable version.
- To browse or download the data used to make this map, use our Disability Data Lookup Tool.
-
This map explores American Community Survey (ACS) 5-year data (Table C18120) employment estimates by disability type.
The ACS asks a set of disability indicator questions to determine disability. If a respondent can answer “yes” to any disability question they are classified as having a disability. The data below are for ages 18-64.
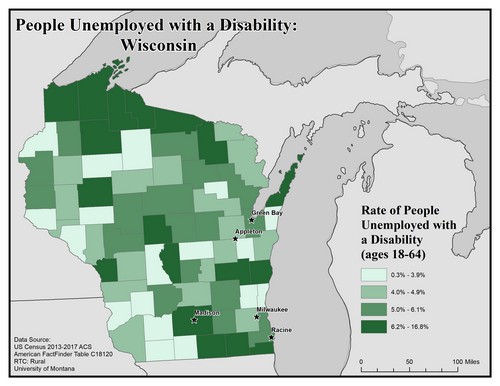
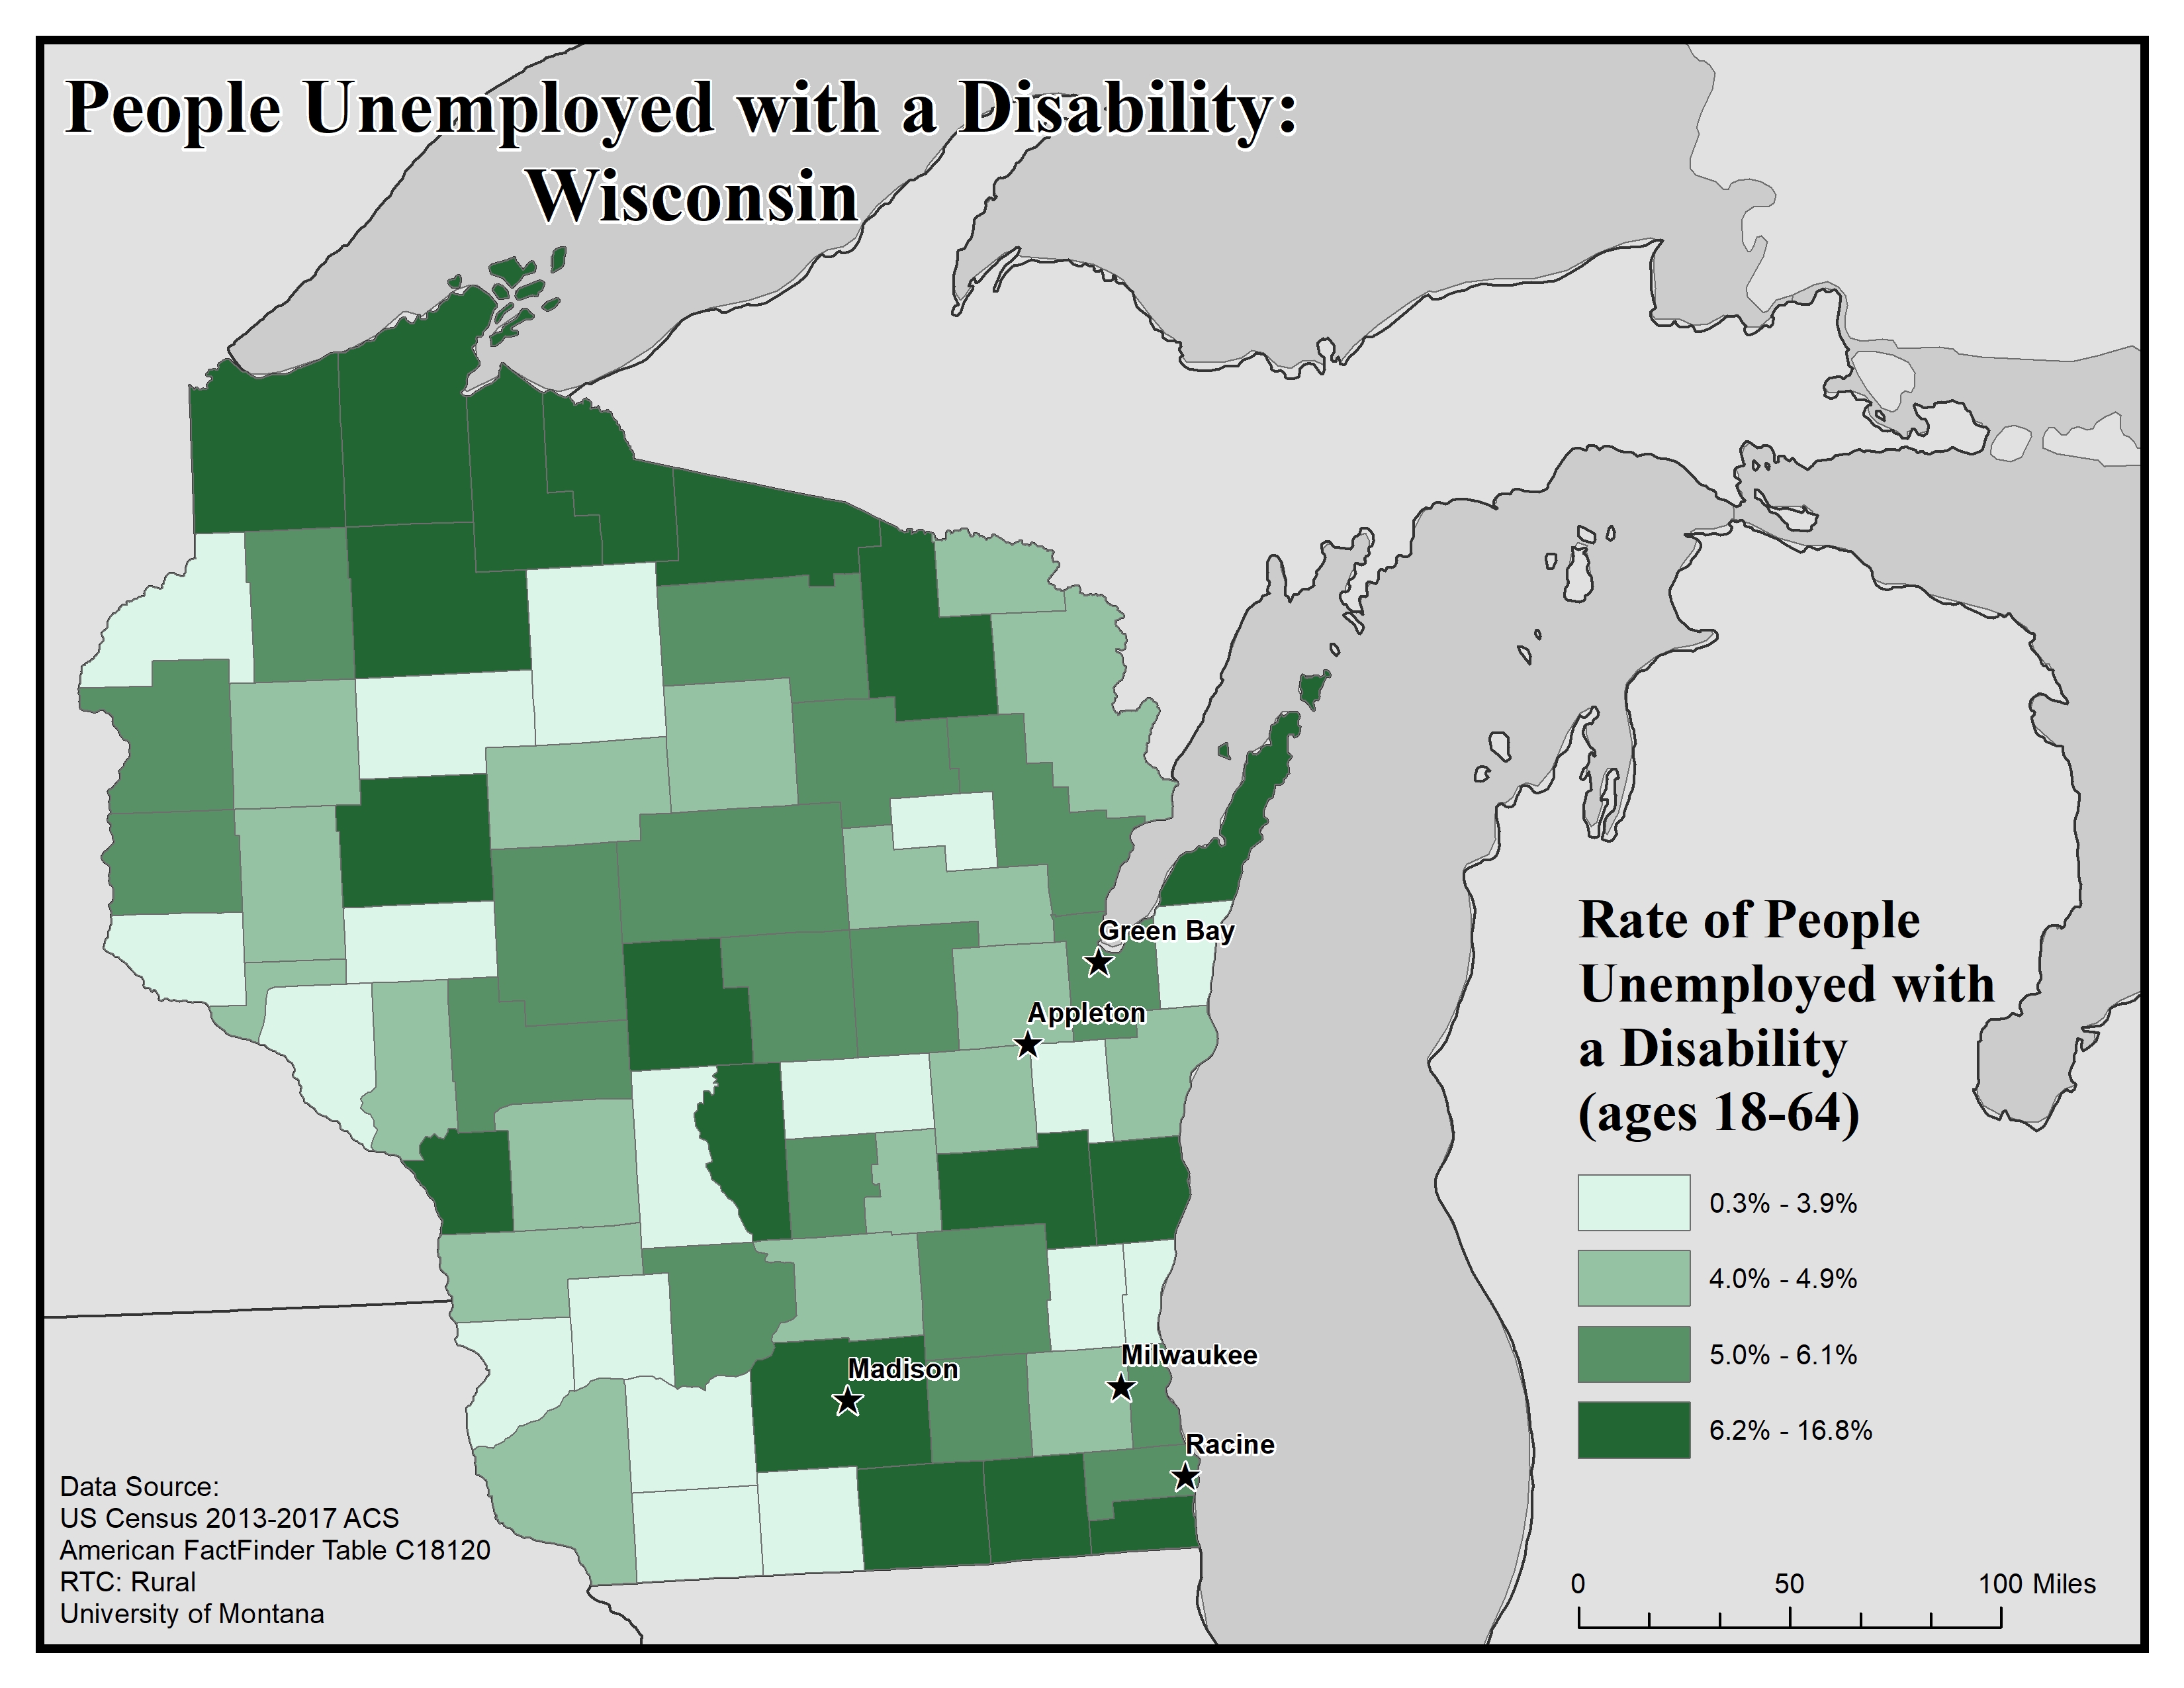
This map of Wisconsin shows unemployment rates among people with disabilities. The data includes people ages 18 to 64. Rates are broken into four categories from 0.3% to 16.8%.
The five largest urban areas (Racine, Milwaukee, Madison, Appleton, and Green Bay) are labeled on the map to show if there are any differences between rates in urban compared to rural areas. Rates are varied across the state though many of the counties in the highest bracket of 6.2% to 16.8% are in the far northern and far south-eastern parts of the state.
Appleton and Milwaukee are in counties with the second lowest rate of 4.0% to 4.9%. Racine and Green Bay are in counties with the second highest rate of 5.0% to 6.1%. Madison is in a county with the highest rate of 6.2% to 16.8%.
Map produced February 2020 based on 2013-2017 American Community Survey data.
- Click on the map for a larger, downloadable version.
- To browse or download the data used to make this map, use our Disability Data Lookup Tool.
-
This map explores American Community Survey (ACS) 5-year data (Table C18120) employment estimates by disability type.
The ACS asks a set of disability indicator questions to determine disability. If a respondent can answer “yes” to any disability question they are classified as having a disability. The data below are for ages 18-64.

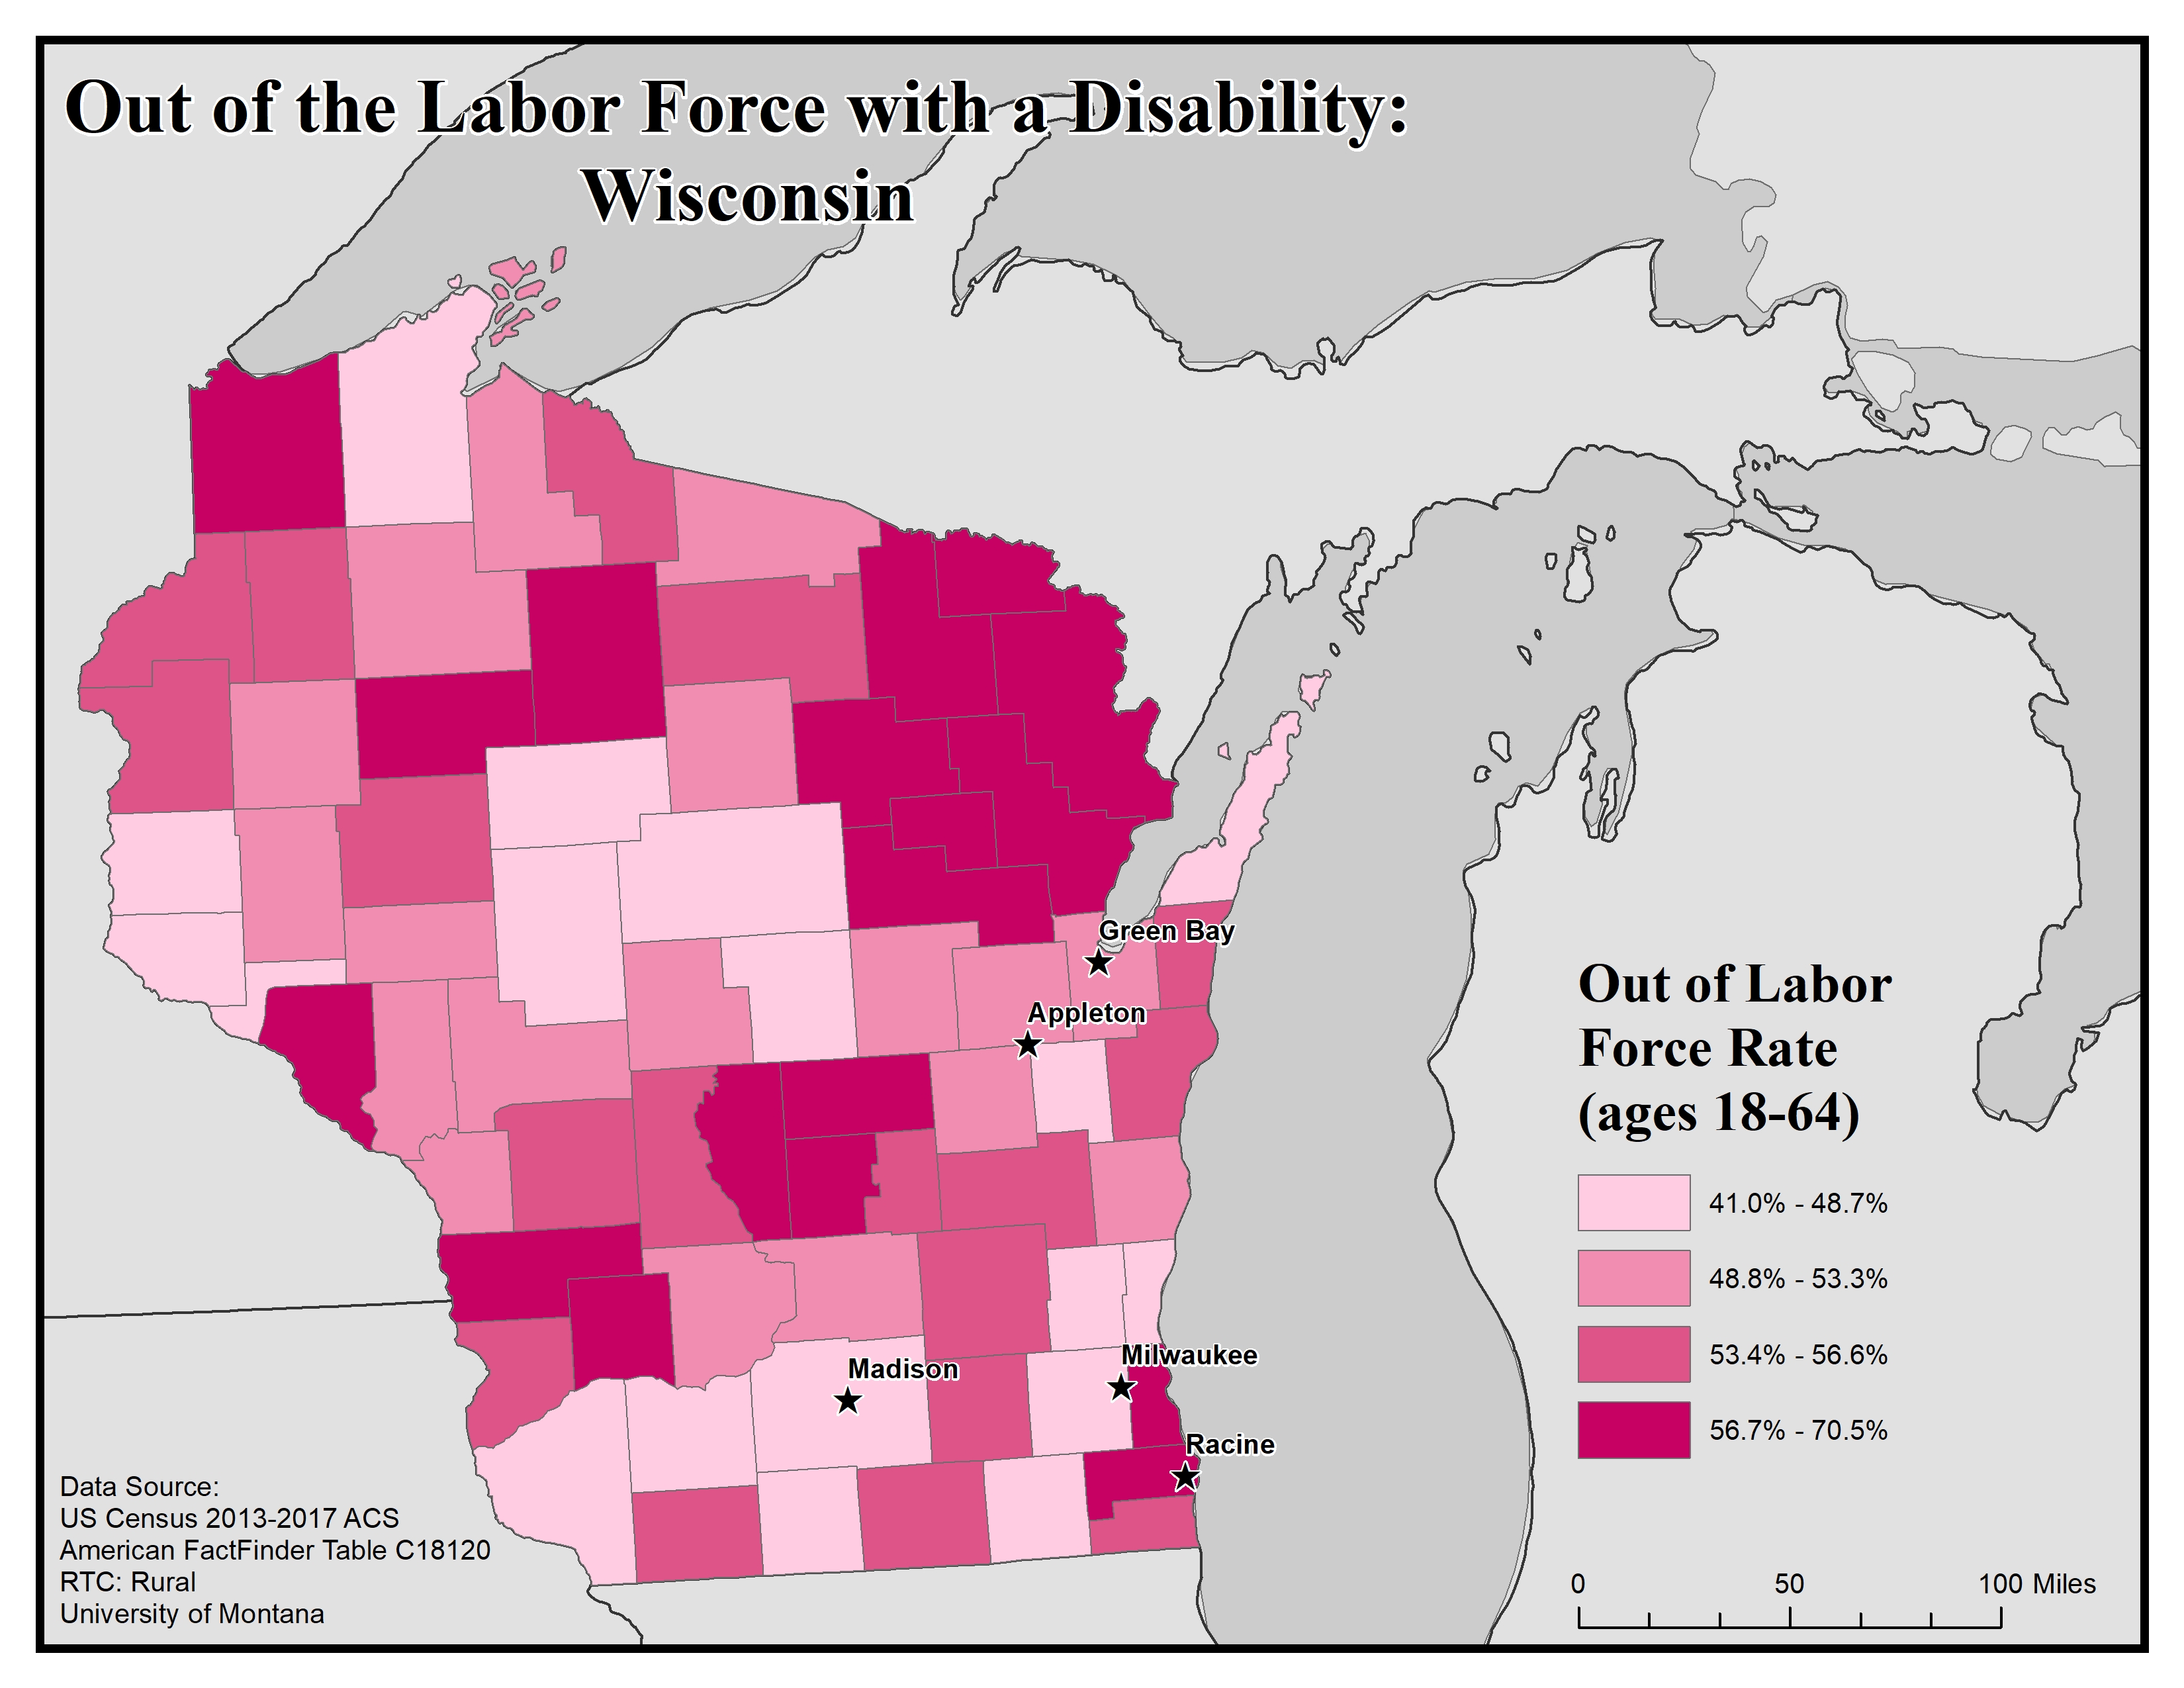
This map of Wisconsin shows out of labor force rates among people with disabilities. The data includes people ages 18 to 64. Rates are broken into four categories from 41.0 to 70.5%.
The five largest urban areas (Racine, Milwaukee, Madison, Appleton, and Green Bay) are labeled on the map to show if there are any differences between rates in urban compared to rural areas.
Rates are varied across the state, though there is a cluster of counties with the highest rate (56.7 to 70.5%) in the northeastern part of the state, bordering Michigan. Racine is in a county with the highest rate, of 56.7 to 70.5%. Appleton and Green Bay are in counties with the second-lowest rate, of 48.8 to 53.3%. Madison and Milwaukee are in counties with the lowest rate, of 41.0 to 48.7%.
Map produced February 2020 based on 2013-2017 American Community Survey data.
- Click on the map for a larger, downloadable version.
- To browse or download the data used to make this map, use our Disability Data Lookup Tool.
Disability Rates by Functional Limitation: Wisconsin
-
This map explores the American Community Survey (ACS) 5-year data (Table S1810) on disability estimates by county.
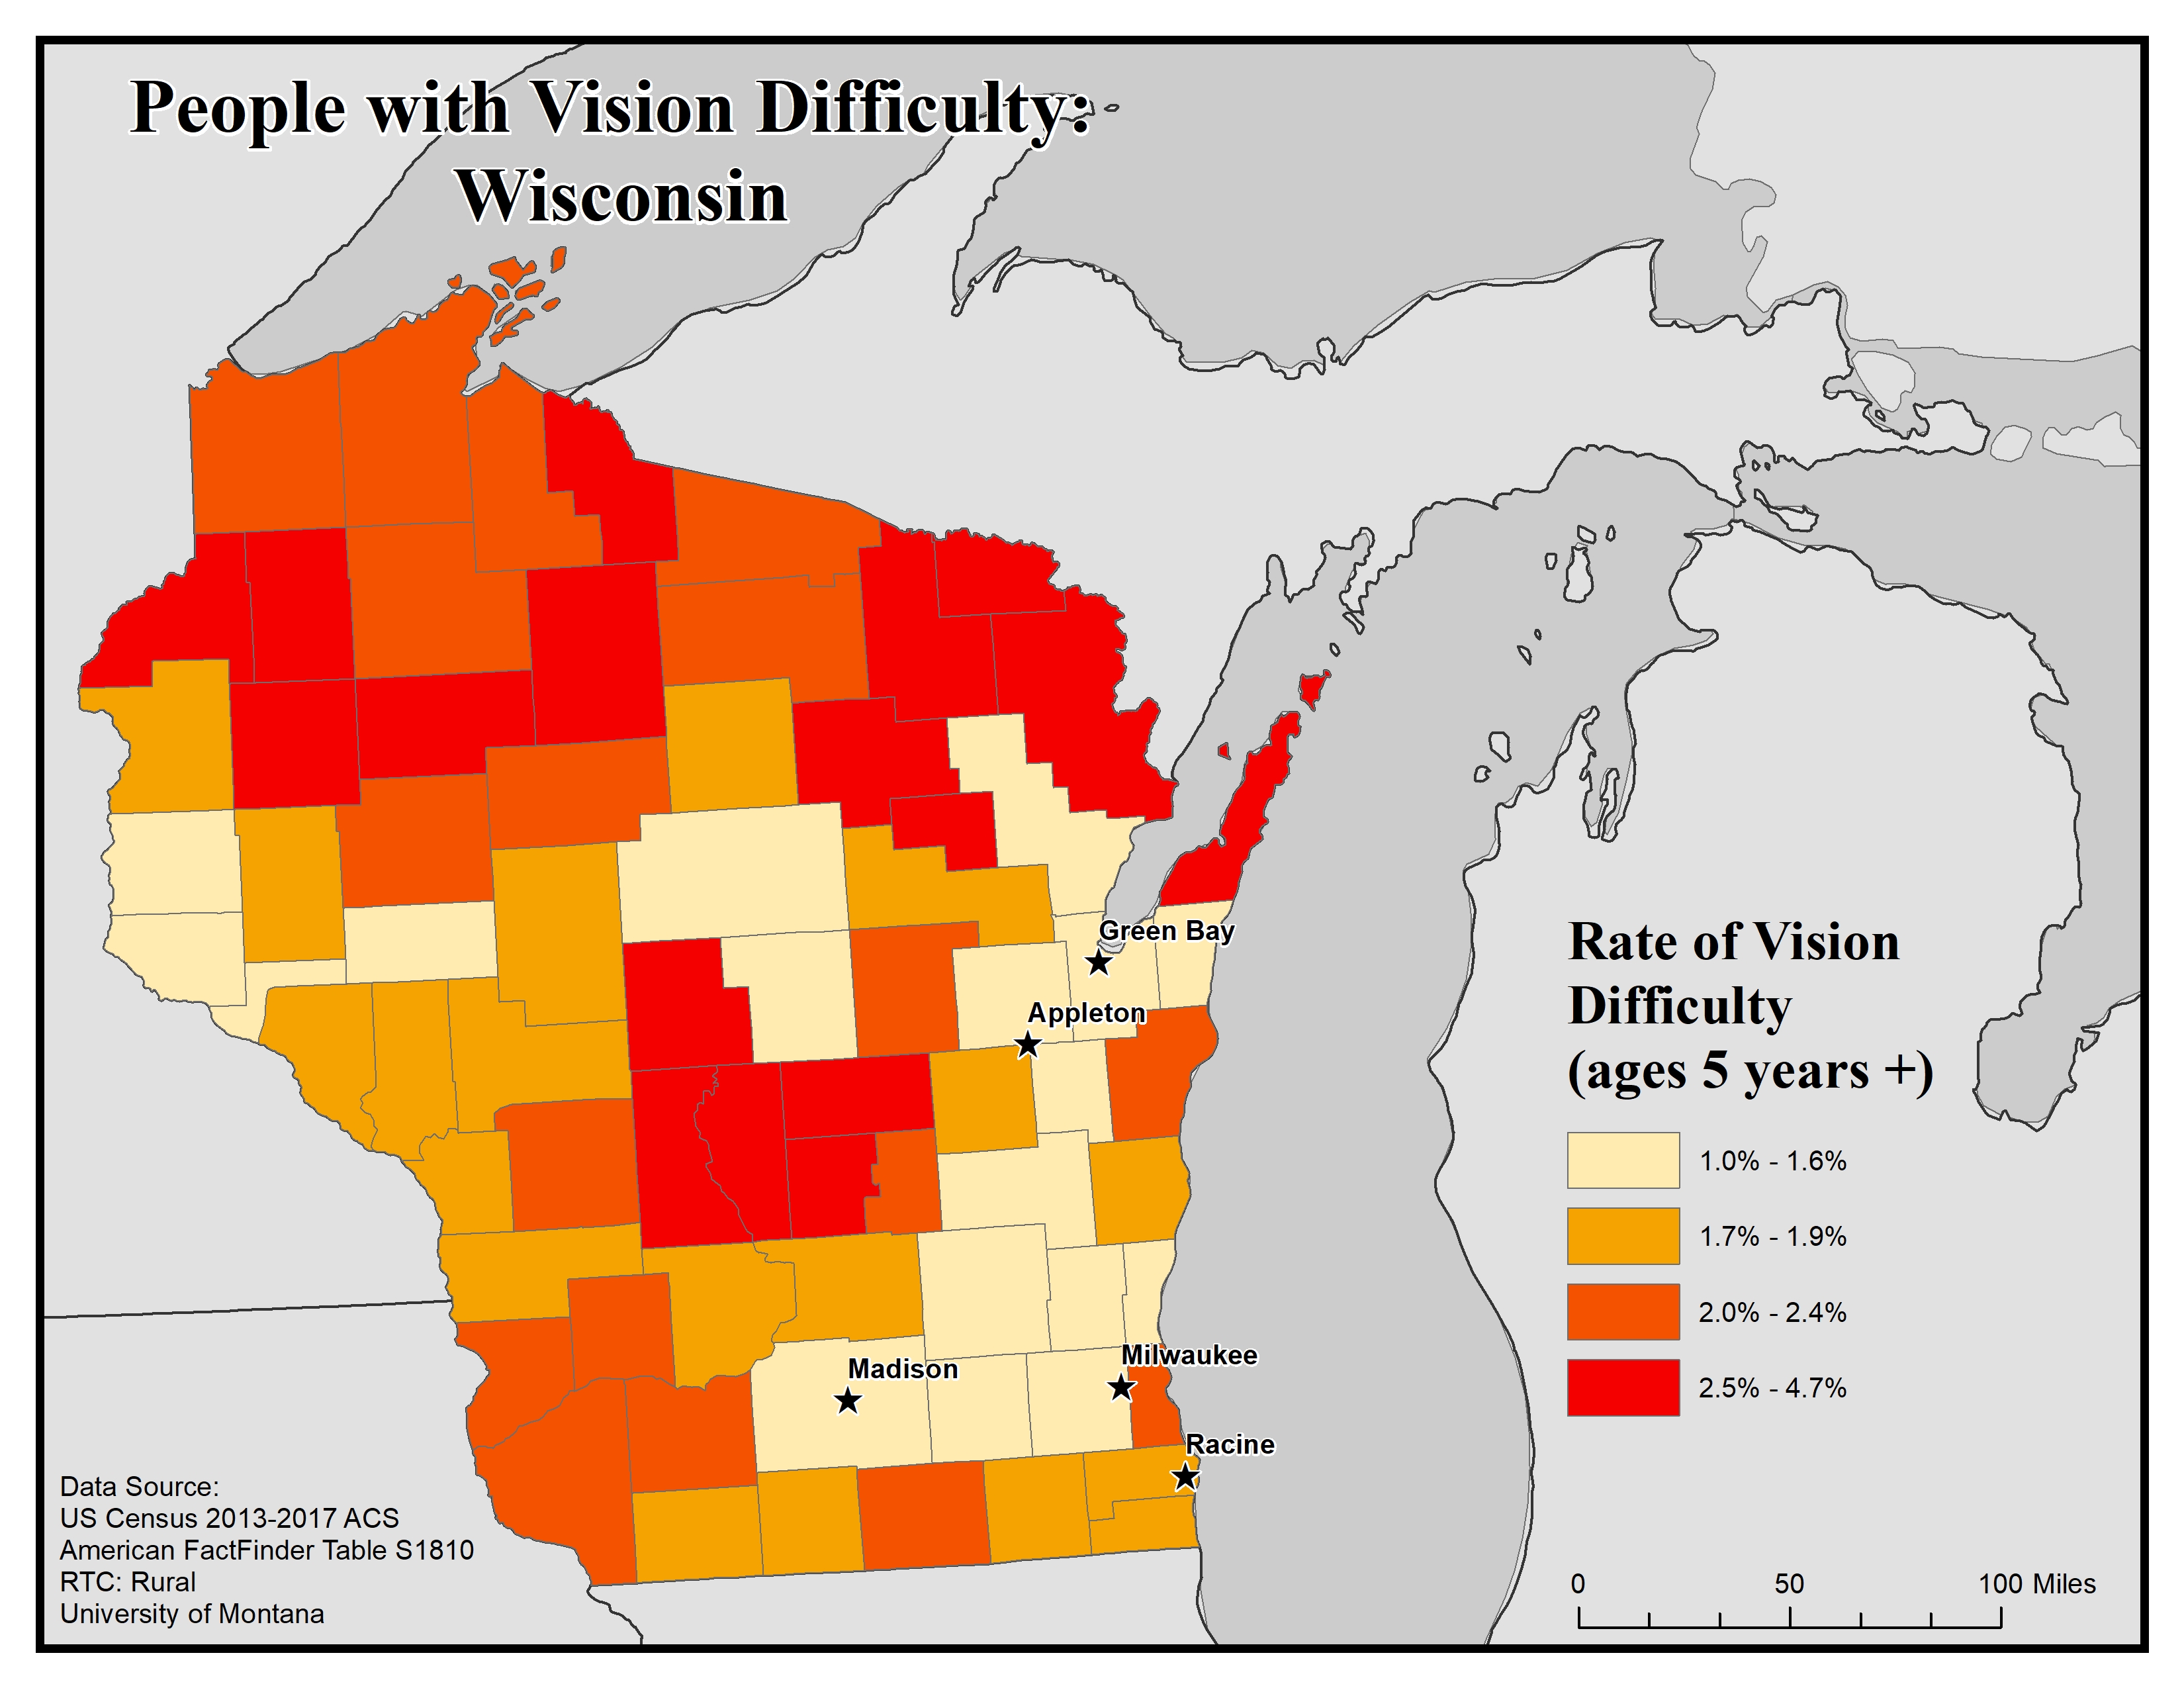
For vision difficulty the ACS asks if a respondent is blind or has serious difficulty seeing, even when wearing glasses. If they answer “yes” they are classified as having a vision difficulty. This data is for all ages.
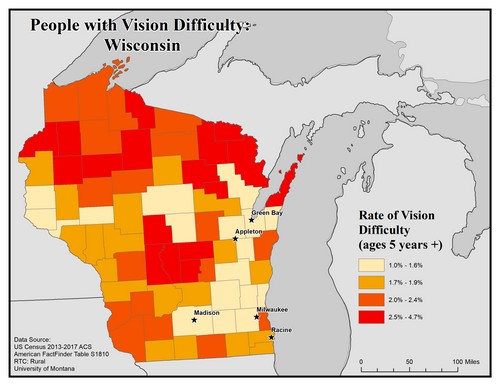
This map of the state of Wisconsin shows rates of people with vision difficulty for ages 5 and older by county. Rates are broken into four categories from 1.0% to 4.7%.
The five largest urban areas (Racine, Milwaukee, Madison, Appleton, and Green Bay) are labeled on the map to show if there are any differences between rates in urban compared to rural areas. Counties in the north have higher rates, along with a few central counties, of 2.5% to 4.7%.
Racine is in a county with the second lowest rate of 1.7% to 1.9%, while Milwaukee, Green Bay, Appleton, and Madison are in counties of the lowest rate of 1.0% to 1.6%.
Map produced February 2020 based on 2013-2017 American Community Survey data.
- Click on the map for a larger, downloadable version.
- To browse or download the data used to make this map, use our Disability Data Lookup Tool.
-
This map explores the American Community Survey (ACS) 5-year data (Table S1810) on disability estimates by county.
For hearing difficulty the ACS asks if a respondent is deaf or has serious difficulty hearing. If they answer “yes” they are classified as having a hearing difficulty. This data is for all ages.
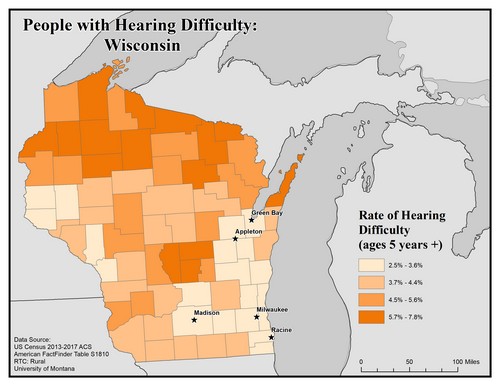
This map of the state of Wisconsin shows rates of people with hearing difficulty for ages 5 and older by county. Rates are broken into four categories from 2.5% to 5.7%.
The five largest urban areas (Racine, Milwaukee, Madison, Appleton, and Green Bay) are labeled on the map to show if there are any differences between rates in urban compared to rural areas. Counties in the north have higher rates, along with a few central counties, of 5.7% to 7.8%.
All five cities are in counties with the lowest rate of 2.5% to 3.6%.
Map produced February 2020 based on 2013-2017 American Community Survey data.
- Click on the map for a larger, downloadable version.
- To browse or download the data used to make this map, use our Disability Data Lookup Tool.
-
This map explores the American Community Survey (ACS) 5-year data (Table S1810) on disability estimates by county.
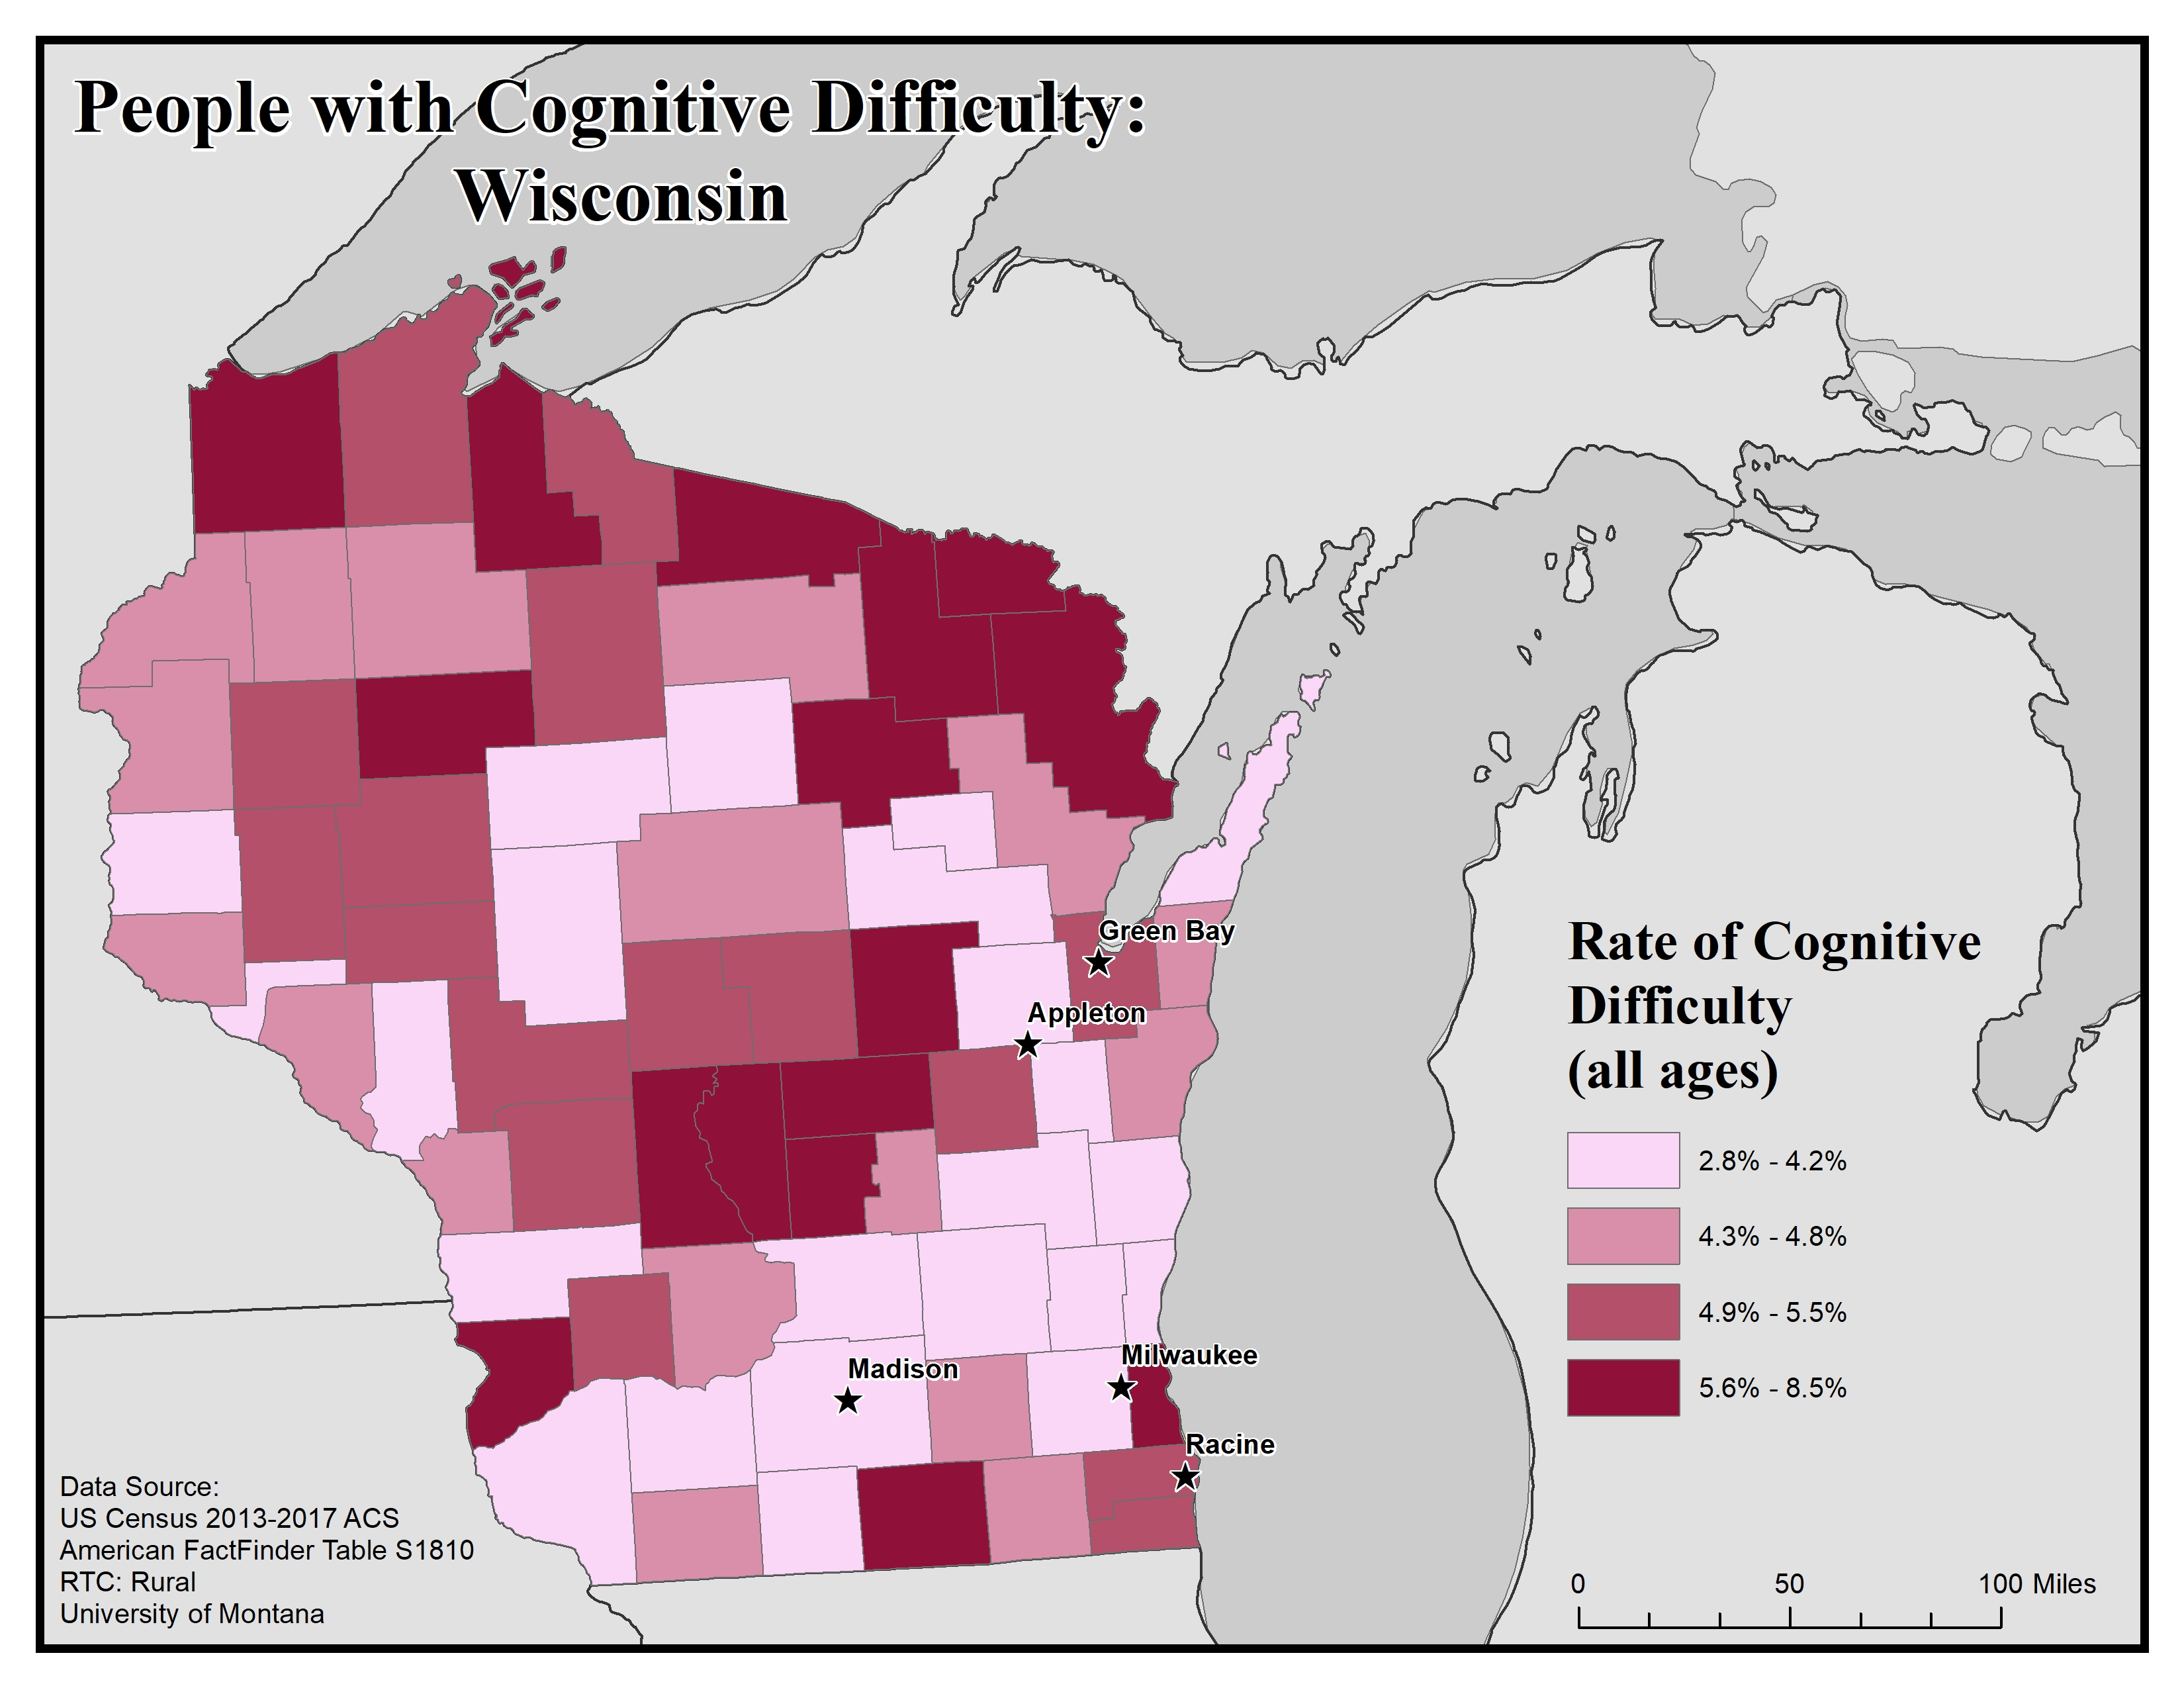
For cognitive difficulty the ACS asks because of a physical, mental, or emotional problem, does the respondent have difficulty remembering, concentrating, or making decisions. If they answer “yes” they are classified as having a cognitive difficulty. This data is for ages 5 and up.
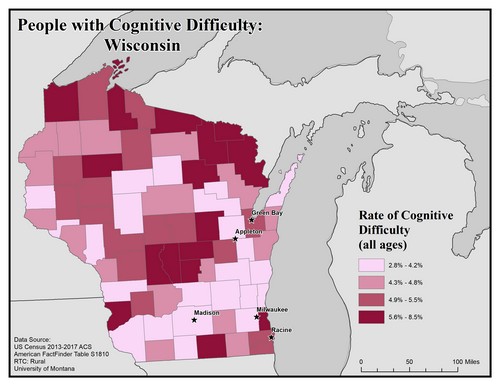
This map of the state of Wisconsin shows rates of people with cognitive difficulty by county. Rates are broken into four categories from 2.8 to 8.5%
The five largest urban areas (Racine, Milwaukee, Madison, Appleton, and Green Bay) are labeled on the map to show if there are any differences between rates in urban compared to rural areas. Overall, there are higher rates of cognitive difficulty in rural counties than in urban ones. Many of the counties are in the north, but some are in other areas of the state. Racine and Green Bay are in counties with the second-highest rate, of 4.9 to 5.5%. Milwaukee, Madison, and Appleton are in counties with the lowest rate, of 2.8 to 4.2%.
Map produced February 2020 based on 2013-2017 American Community Survey data.
- Click on the map for a larger, downloadable version.
- To browse or download the data used to make this map, use our Disability Data Lookup Tool.
-
This map explores the American Community Survey (ACS) 5-year data (Table S1810) on disability estimates by county.
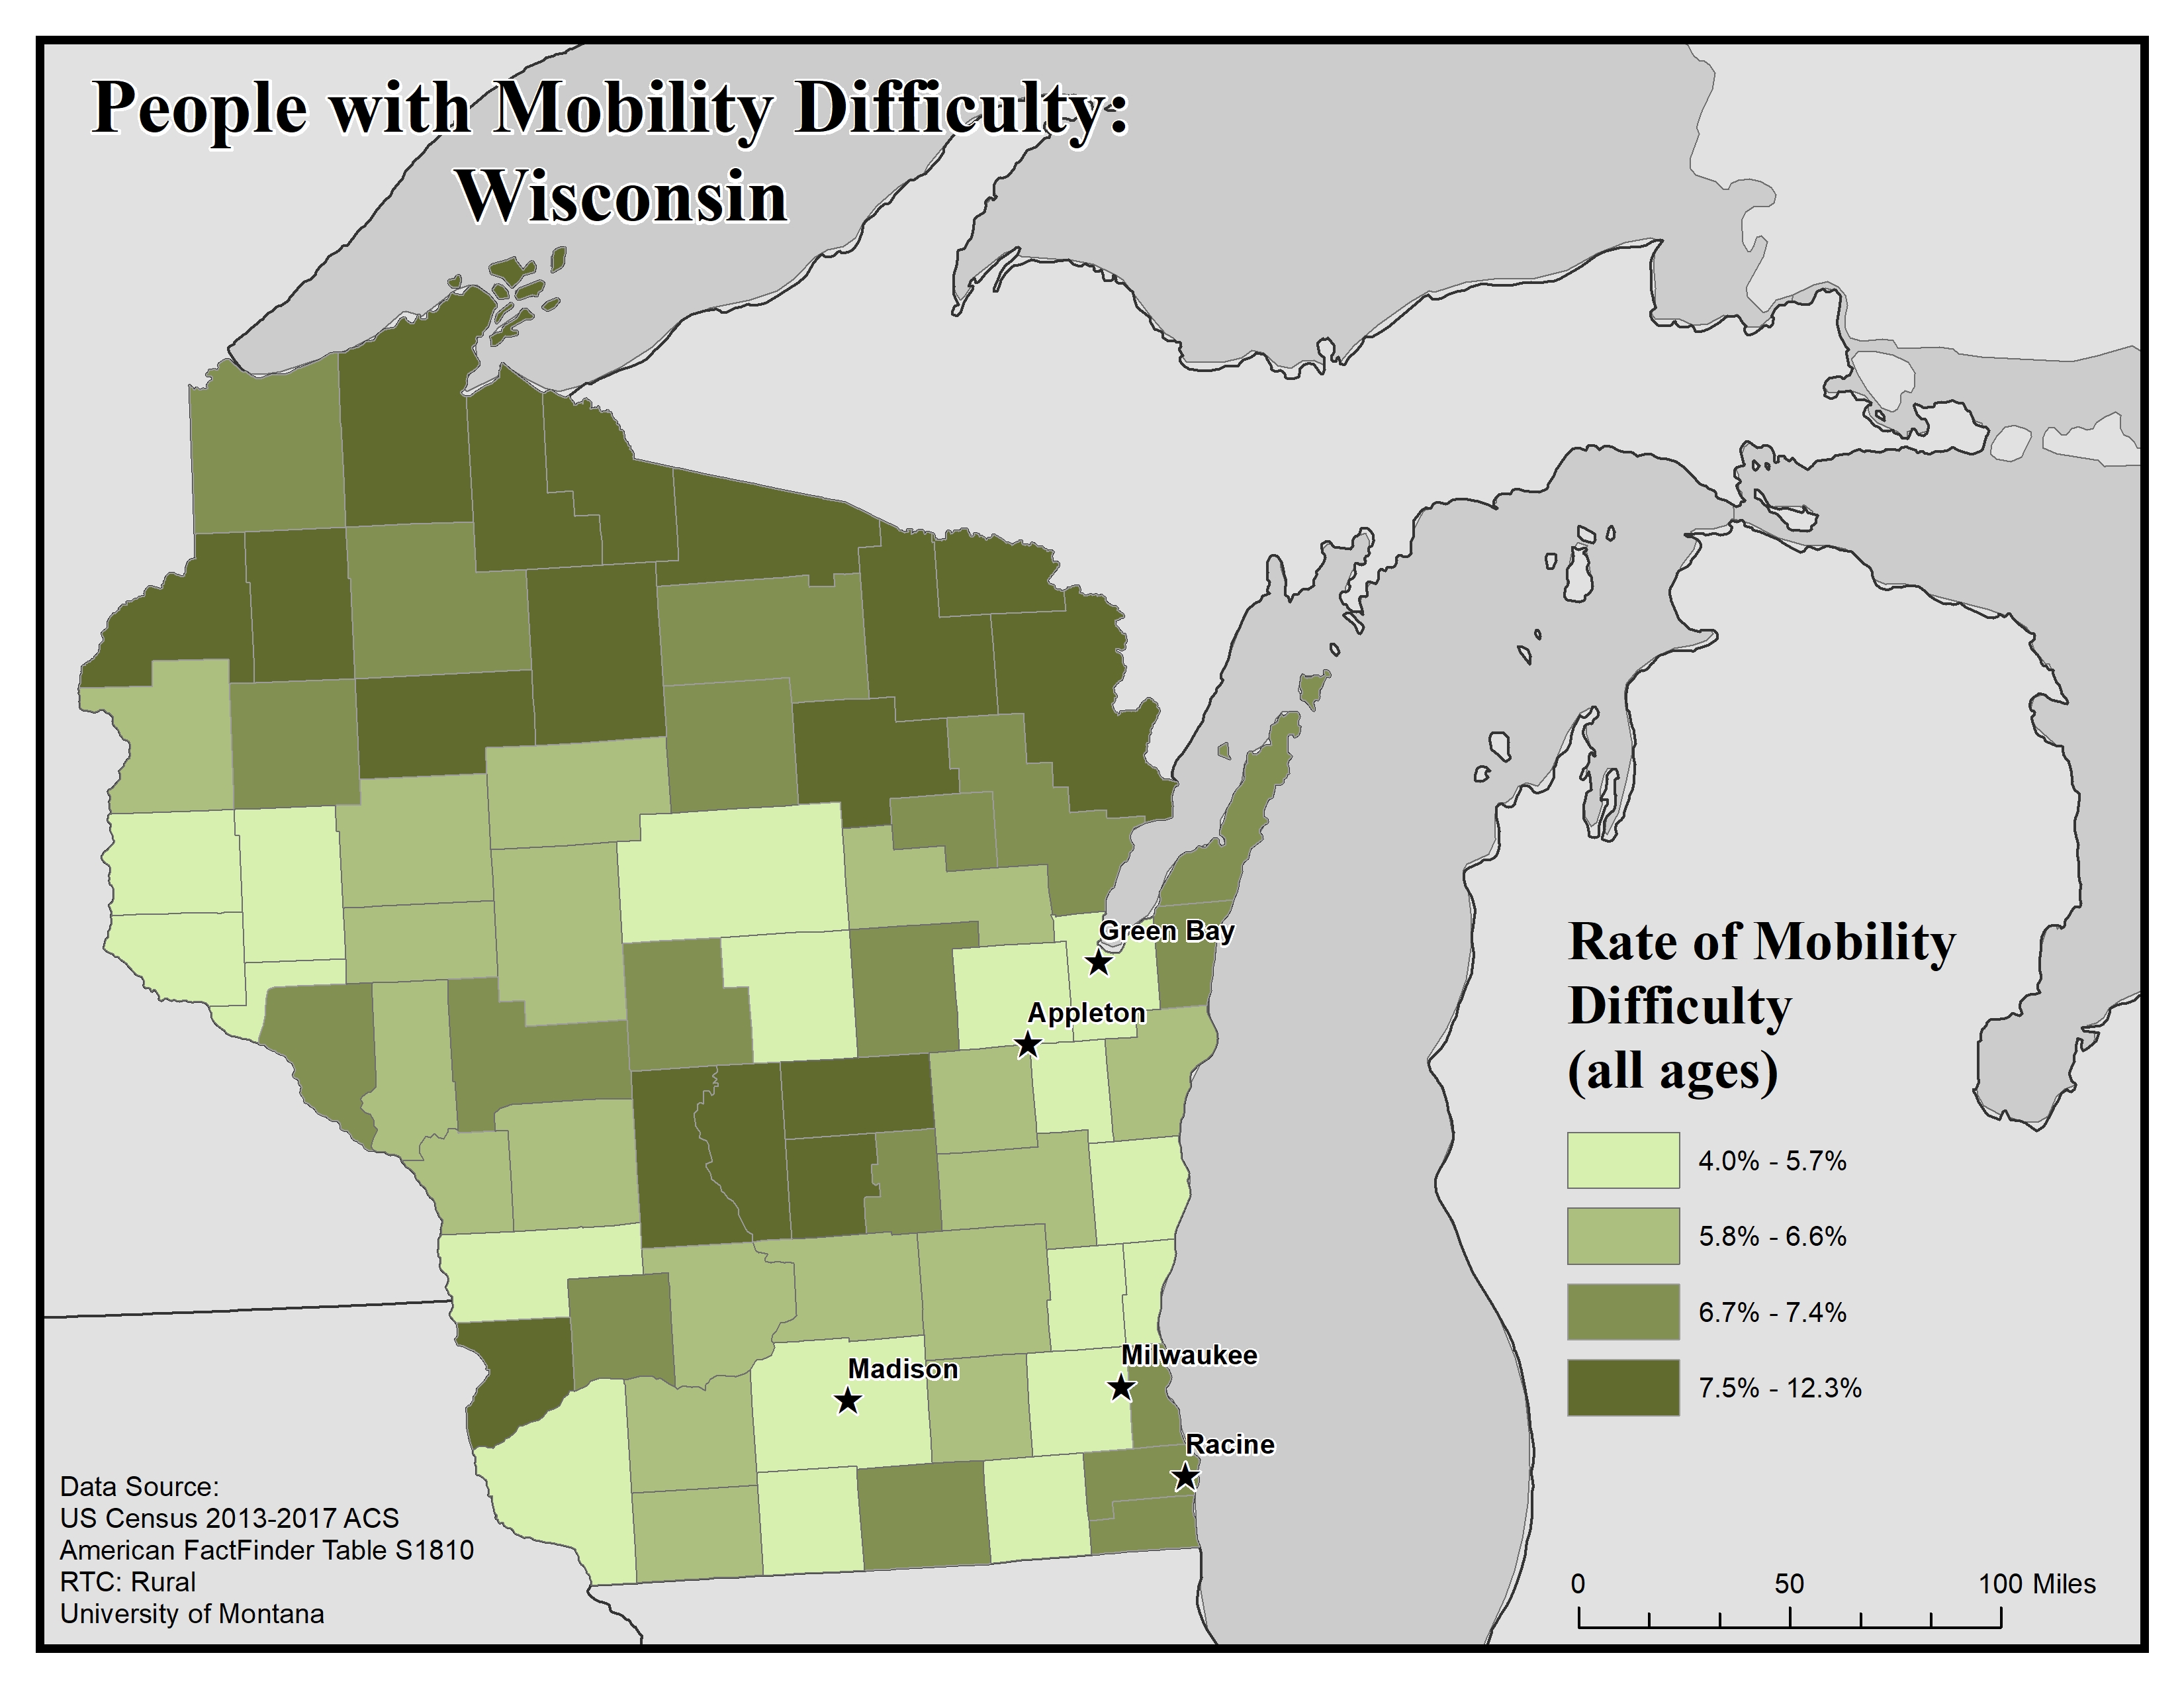
For ambulatory (i.e. mobility) difficulty the ACS asks if a respondent has serious difficulty walking or climbing stairs. If they answer “yes” they are classified as having a mobility difficulty. This data is for ages 5 and up.
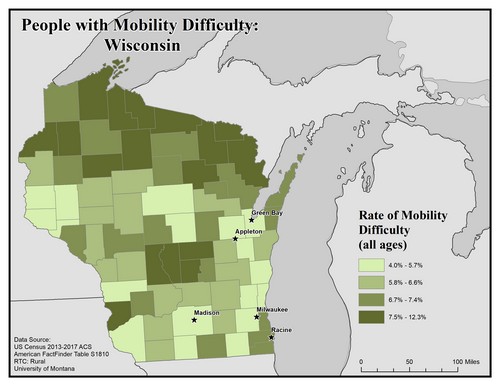
This map of the state of Wisconsin shows rates of people with mobility difficulty for all ages by county. Rates are broken into four categories from 4.0% to 12.3%.
Overall, there are higher rates of mobility difficulty in rural counties than in urban ones. Counties in the north have higher rates, along with a few central counties, of 7.5% to 12.3%.
The five largest urban areas (Racine, Milwaukee, Madison, Appleton, and Green Bay) are labeled on the map to show if there are any differences between rates of people with mobility difficulty in urban compared to rural areas. Racine is in a county with the second highest rate of 6.7% to 7.4%, while Appleton, Green Bay, Milwaukee and Madison are in counties with the lowest rate of 4.0% to 5.7%.
Map produced February 2020 based on 2013-2017 American Community Survey data.
- Click on the map for a larger, downloadable version.
- To browse or download the data used to make this map, use our Disability Data Lookup Tool.
-
This map explores the American Community Survey (ACS) 5-year data (Table S1810) on disability estimates by county.
For self-care difficulty the ACS asks if a respondent has difficulty bathing or dressing. If they answer “yes” they are classified as having a self-care difficulty. This data is for ages 5 and up.
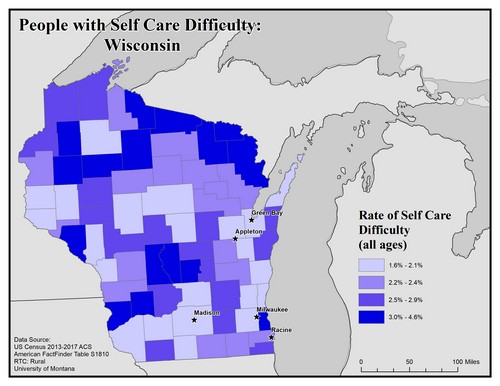
This map of the state of Wisconsin shows rates of people with self care difficulty by county. Rates are broken into four categories from 1.6% to 4.6%.
Overall, there are higher rates of mobility difficulty in rural counties than in urban ones. Counties in the north have higher rates, along with a few central counties, of 3.0% to 4.6%.
The five largest urban areas (Racine, Milwaukee, Madison, Appleton, and Green Bay) are labeled on the map to show if there are any differences between rates in urban compared to rural areas. Racine is in a county with the second lowest rate of 2.2% to 2.4%, while Green Bay, Appleton, Milwaukee and Madison are in counties with the lowest rate of 1.6% to 2.1%.
Map produced February 2020 based on 2013-2017 American Community Survey data.
- Click on the map for a larger, downloadable version.
- To browse or download the data used to make this map, use our Disability Data Lookup Tool.
-
This map explores the American Community Survey (ACS) 5-year data (Table S1810) on disability estimates by county.
For independent living difficulty the ACS asks because of a physical, mental, or emotional problem, does the respondent have difficulty doing errands alone such as visiting a doctor’s office or shopping. If they answer “yes” they are classified as having an independent living difficulty. This data is for ages 18 and up.
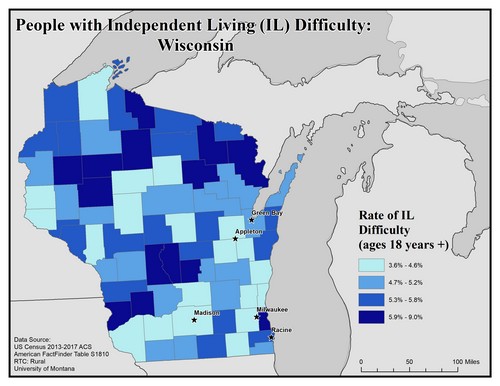
This map of the state of Wisconsin shows rates of independent living (IL) difficulty for people 18 years of age and older by county. Rates are broken into four categories from 3.6% to 9.0%.
The five largest urban areas (Racine, Milwaukee, Madison, Appleton, and Green Bay) are labeled on the map to show if there are any differences between rates of people with independent living difficulty in urban compared to rural areas. None of these five cities are in counties with the top rate, but the rates are mixed throughout the state.
Racine is in a county with the second highest rate, 5.3% to 5.8%. Green Bay is in a county with the second lowest rate, 4.7% to 5.2%. Appleton, Madison, and Milwaukee are in counties with the lowest rate of 3.6% to 4.6%.
Map produced February 2020 based on 2013-2017 American Community Survey data.
- Click on the map for a larger, downloadable version.
- To browse or download the data used to make this map, use our Disability Data Lookup Tool.