The maps on this page explore the American Community Survey 5-year data (Table S1810) on disability by county.
The ACS does not directly measure disability. Instead, it uses a set of disability indicator questions related to difficulty and functional impairment to identify individuals who may experience a disability. If a respondent can answer “yes” to any disability question they are classified as having a disability.
Disability Rates: Arkansas
-
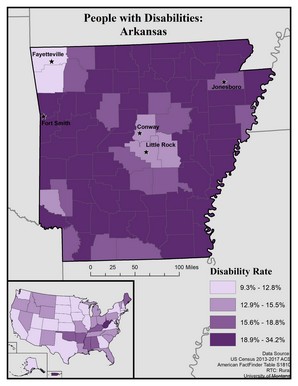
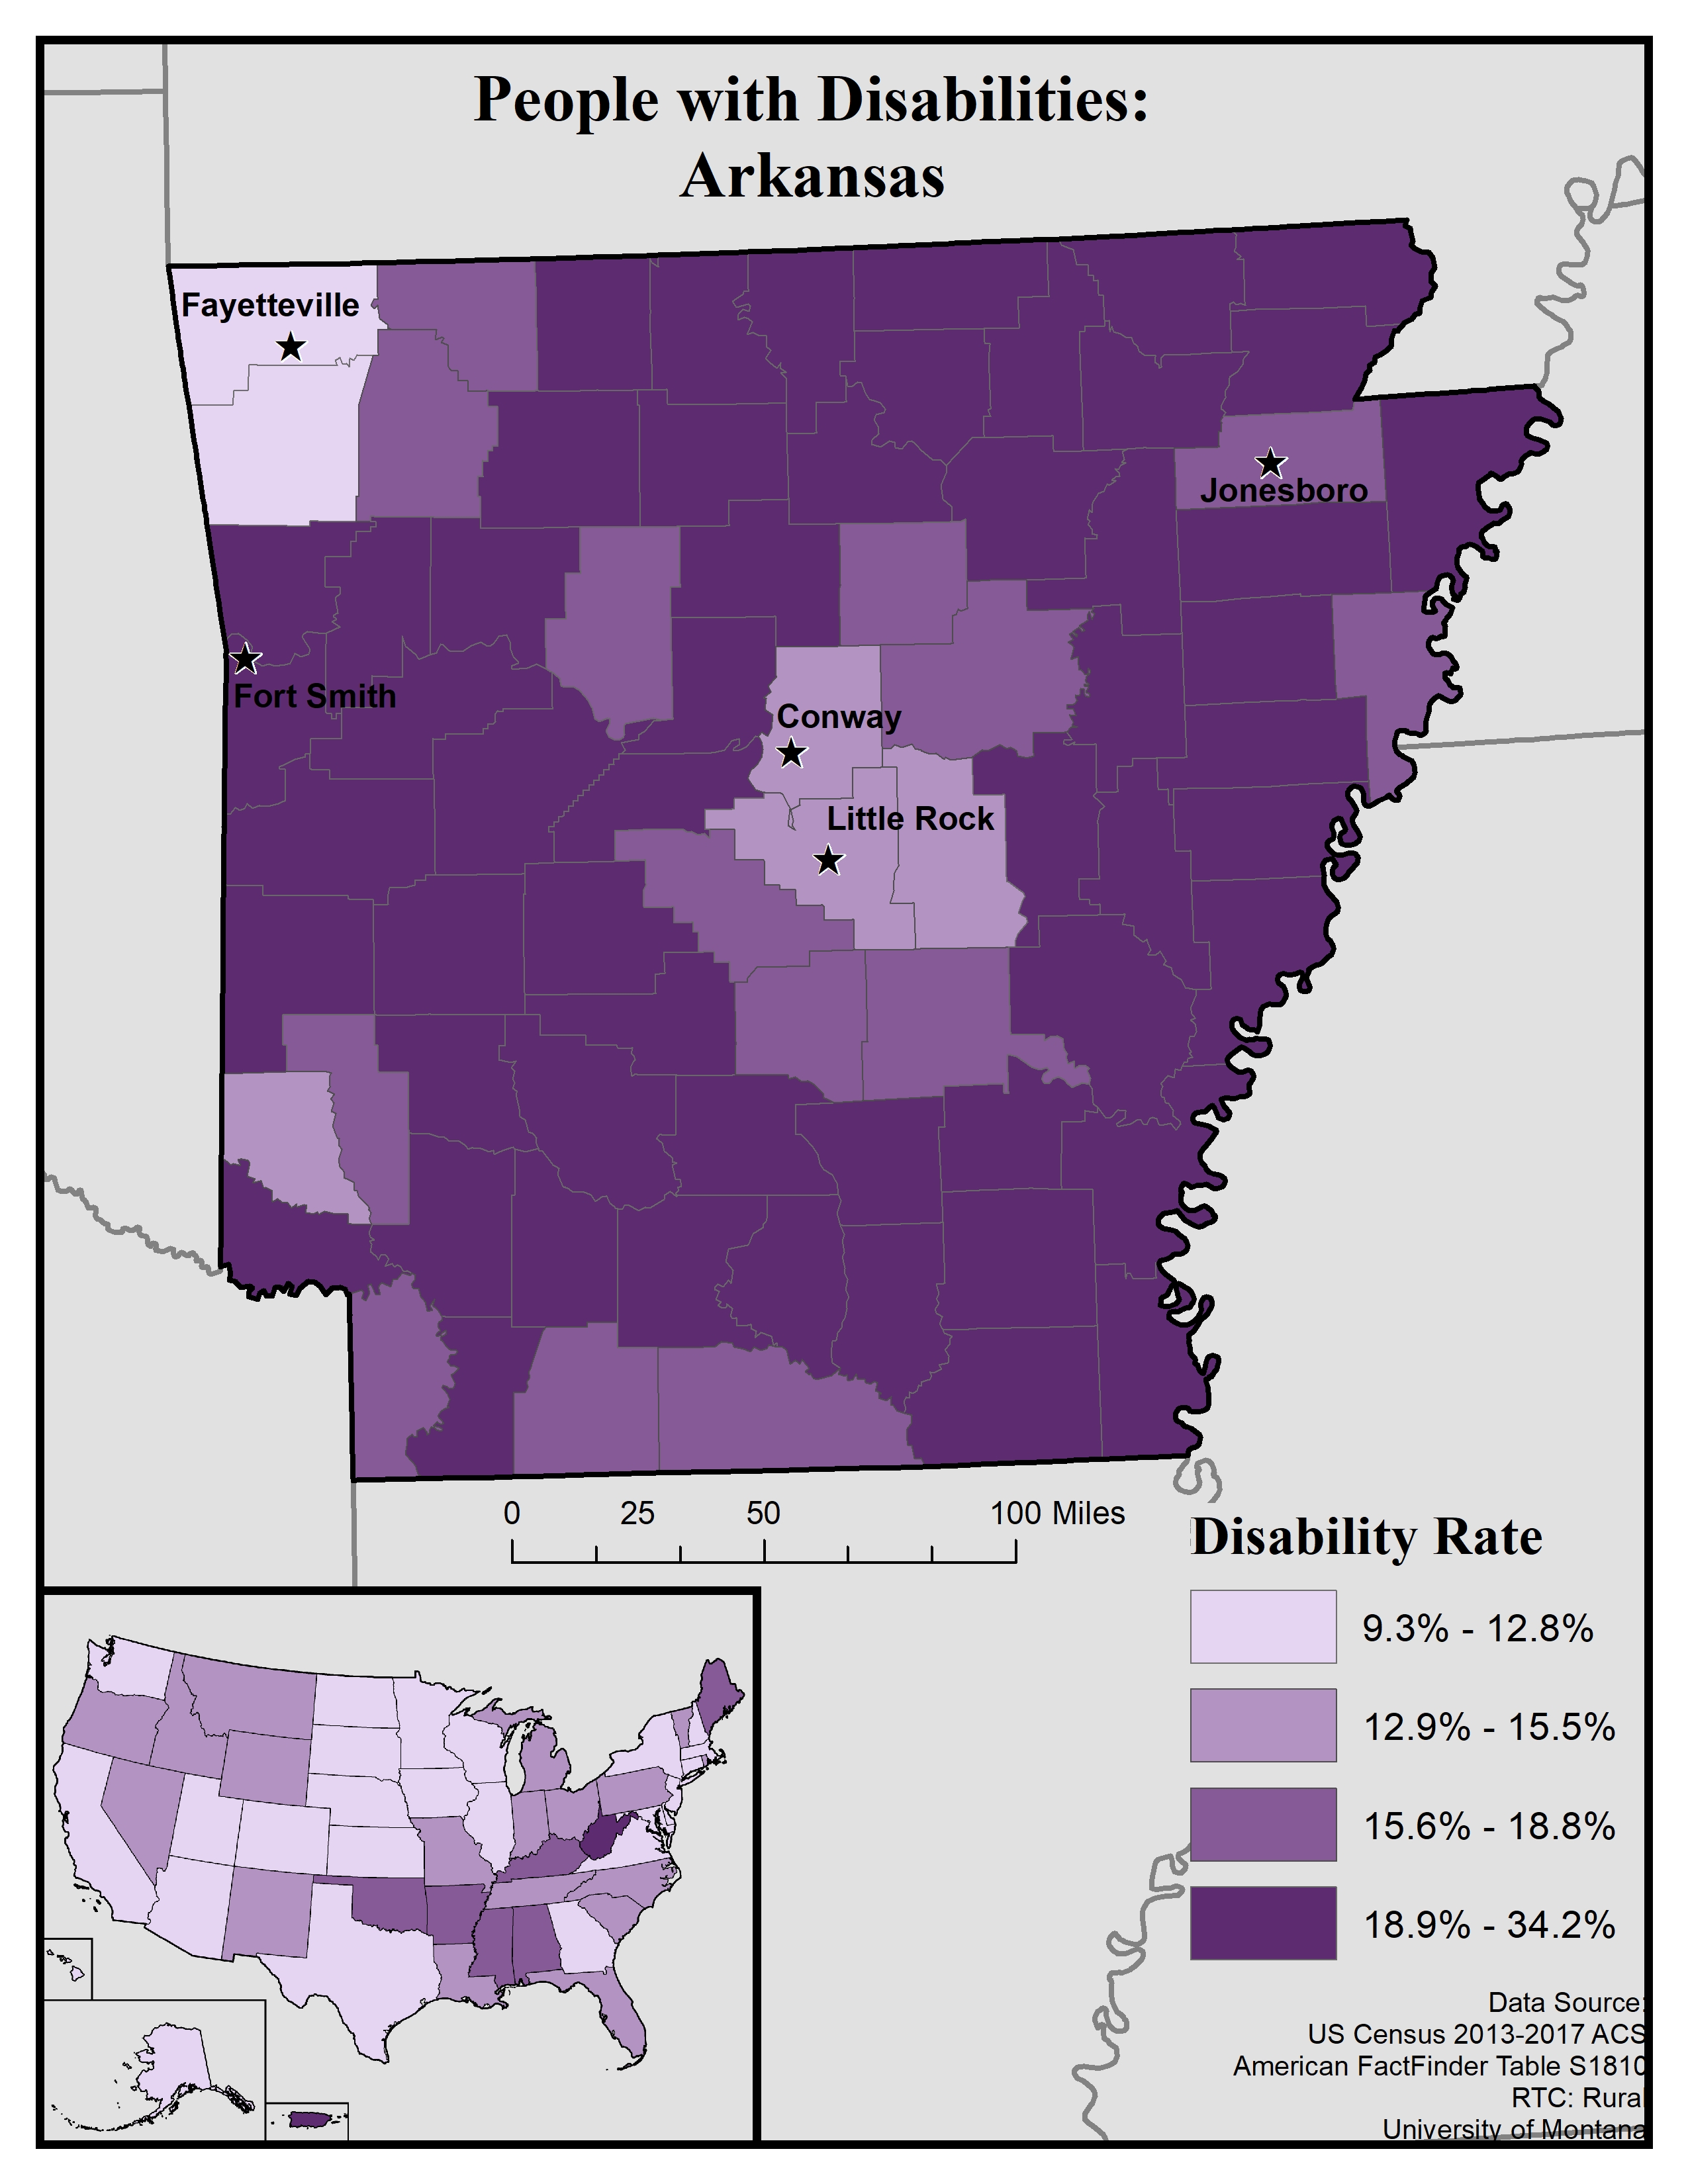
This map of the state of Arkansas shows general rates of disability by county. Disability rates are broken into four levels: 9.3 to 12.8%, 12.9 to 15.5%, 15.6 to 18.8%, and 18.9 to 34.2%.
Rates of people with disabilities are very high in most counties in Arkansas. Of the 75 counties in Arkansas, 55 have rates of 18.9 to 34.2%. Fourteen counties have the second-highest rates of 15.6 to 18.8%. Four counties have rates of 12.9 to 15.5%. Only two counties have the lowest rates, of 9.3 to 12.8%. These two counties are in the northwestern corner of the state: Benton and Washington. All rural counties have high disability rates. The counties with the lowest rates are all urban areas.
In the lower corner there is an inset map of the United States showing how overall general disability rates in Arkansas compare to other states. Overall, Arkansas has higher rates of disability than most other states. Only West Virginia has a higher overall rate of disability.
Map produced July 2019 based on 2013-2017 American Community Survey data.
- Click on the map for a larger, downloadable version.
- To browse or download the data used to make this map, use our Disability Data Lookup Tool.
-
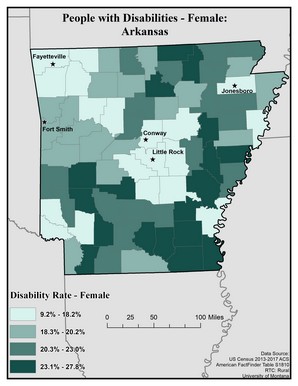
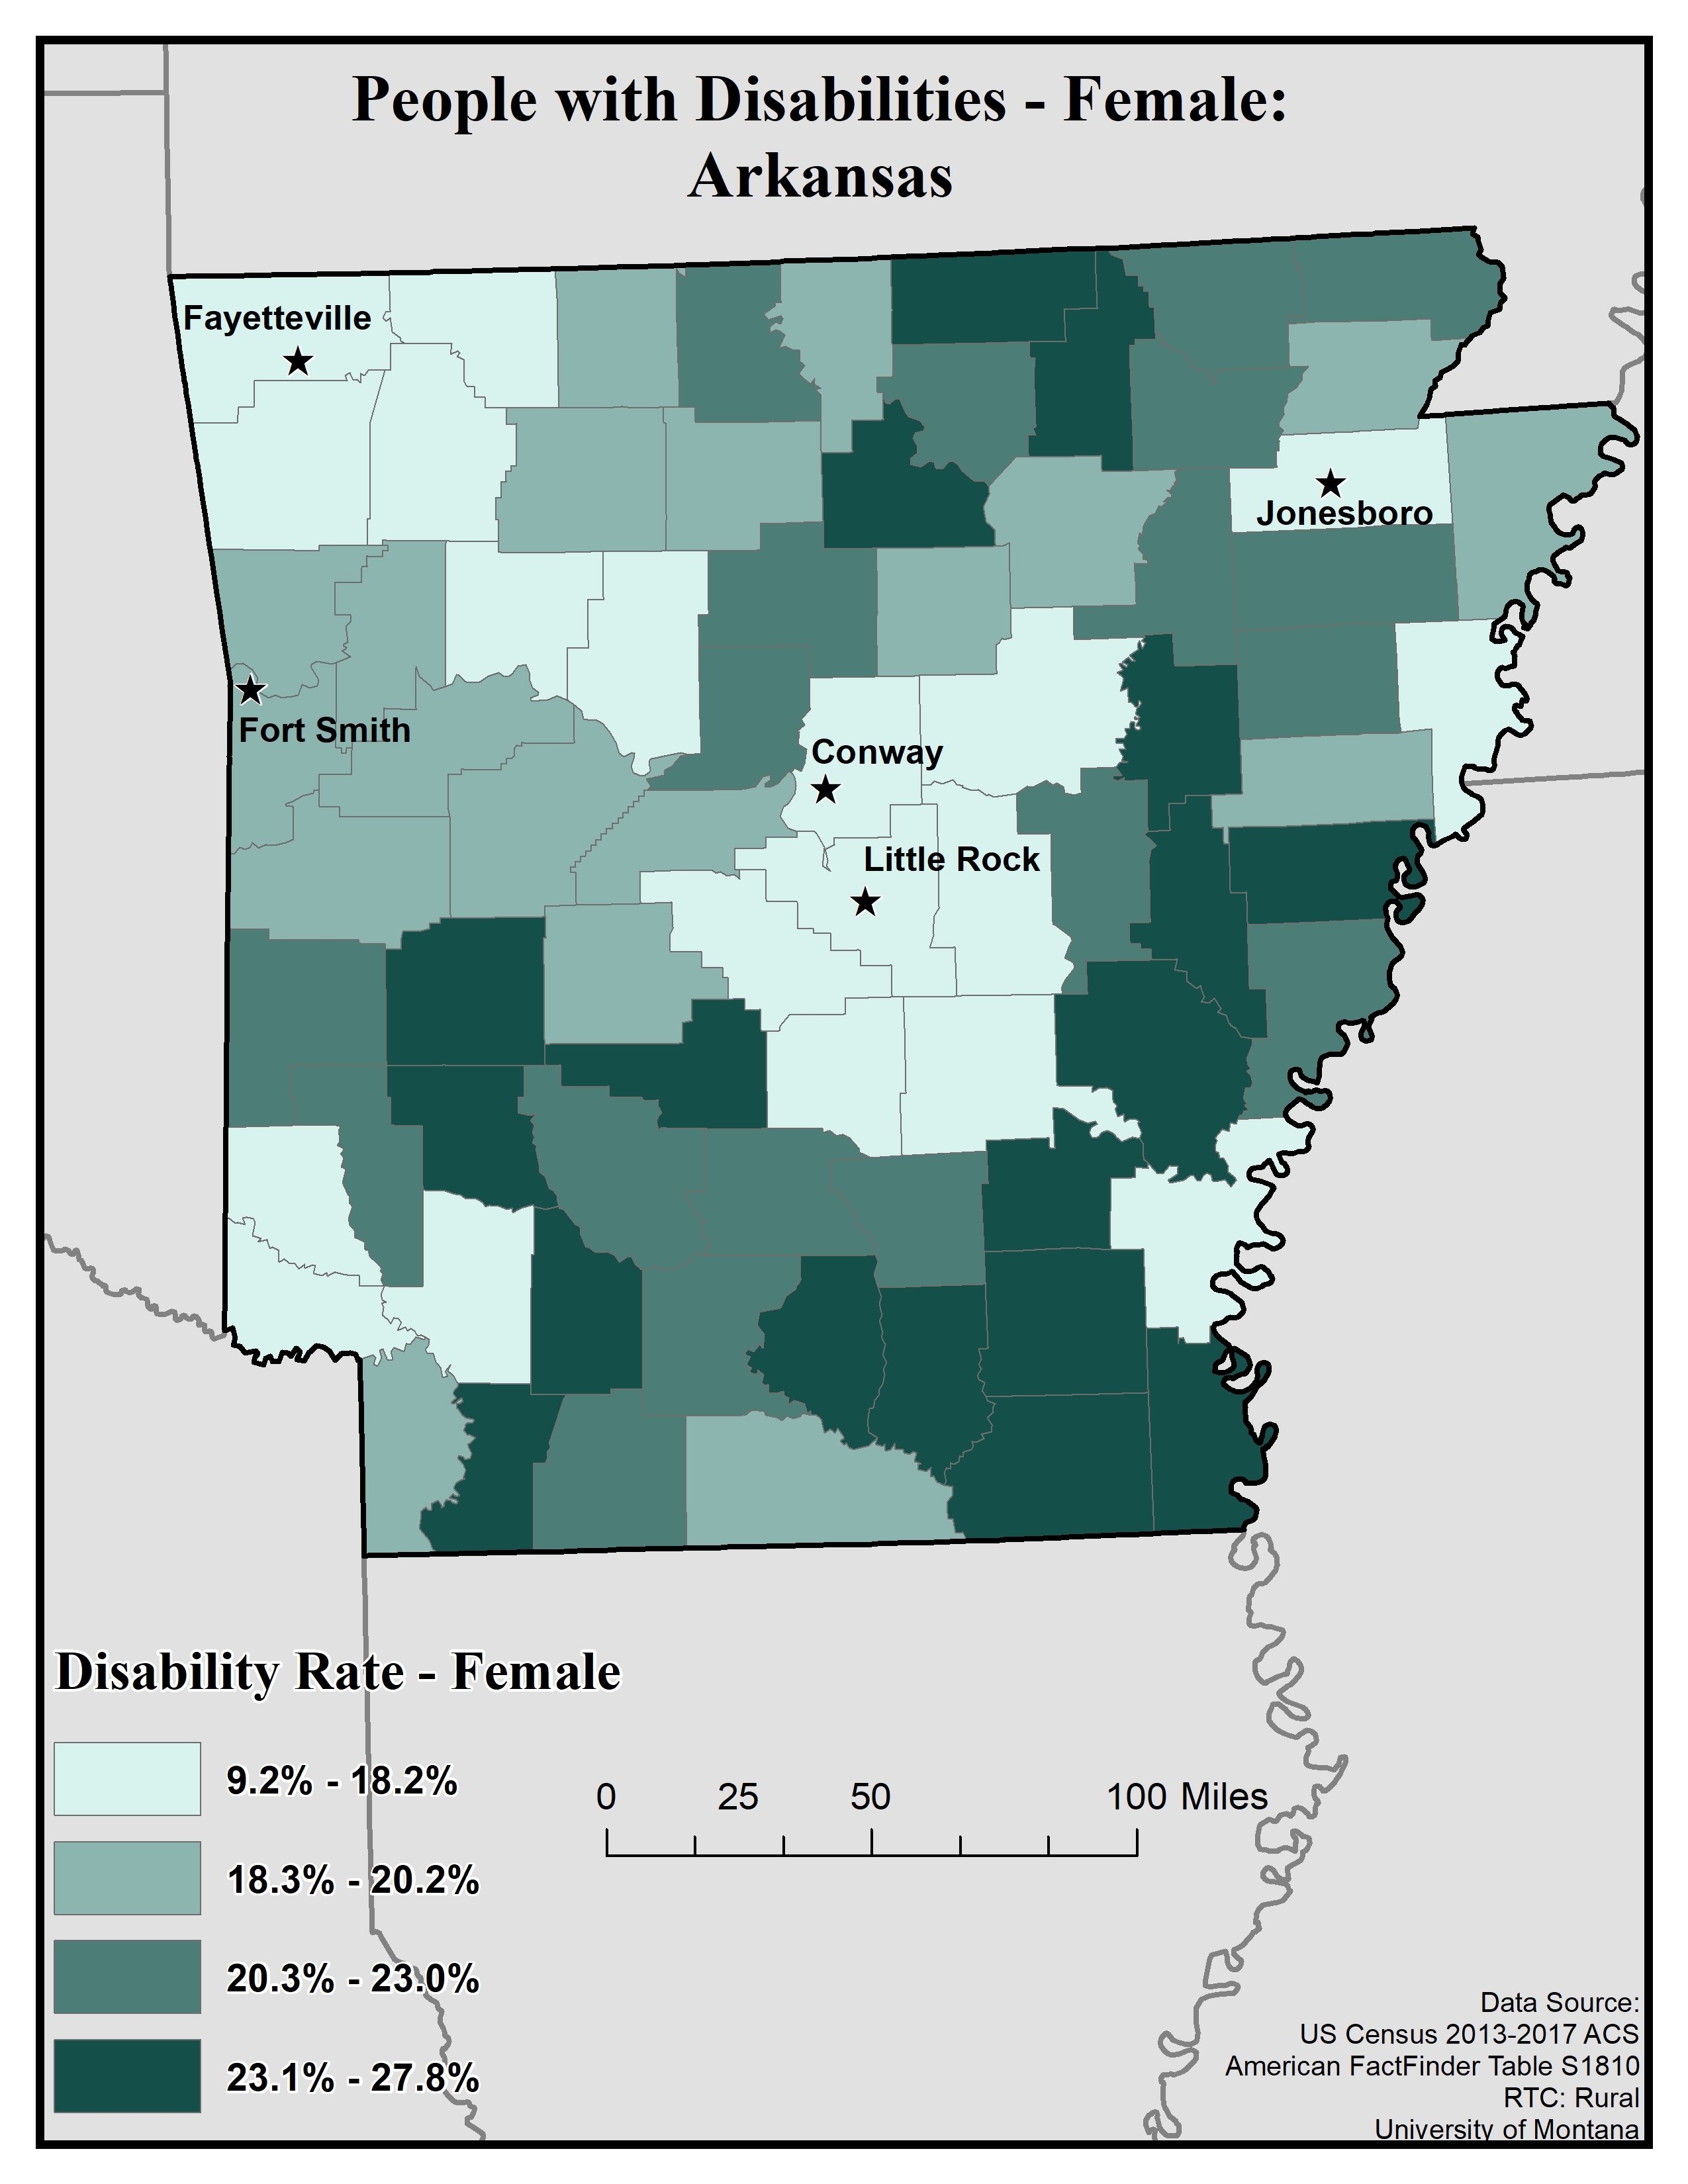
This map of the state of Arkansas shows disability rates among females by county. Rates are broken into four categories: 9.2 to 18.2%, 18.3 to 20.2%, 20.3 to 23.0%, and 23.1 to 27.8%.
The five largest urban areas (Fayetteville, Fort Smith, Conway, Little Rock, and Jonesboro) are labeled on the map to show if there are any differences between rates in urban areas compared to rural ones.
Overall, rates are higher in rural counties than urban ones. Fayetteville, Conway, Little Rock, and Jonesboro are in counties with the lowest rates, of 9.2 to 18.2%. Fort Smith is in a county with rates of 18.3 to 20.2%, the second-lowest rate. There are areas of high rates (23.1 to 27.8%) in the rural counties along the southern border, and areas of the highest and second-highest (20.3 to 23.0%) in the rural counties along the eastern and northern borders of the state.
Map produced November 2019 based on 2013-2017 American Community Survey data.
- Click on the map for a larger, downloadable version.
- To browse or download the data used to make this map, use our Disability Data Lookup Tool.
- For information on how biological sex is used and defined in the ACS, see “American Community Survey and Puerto Rico Community Survey 2017 Subject Definitions” page 125.
-
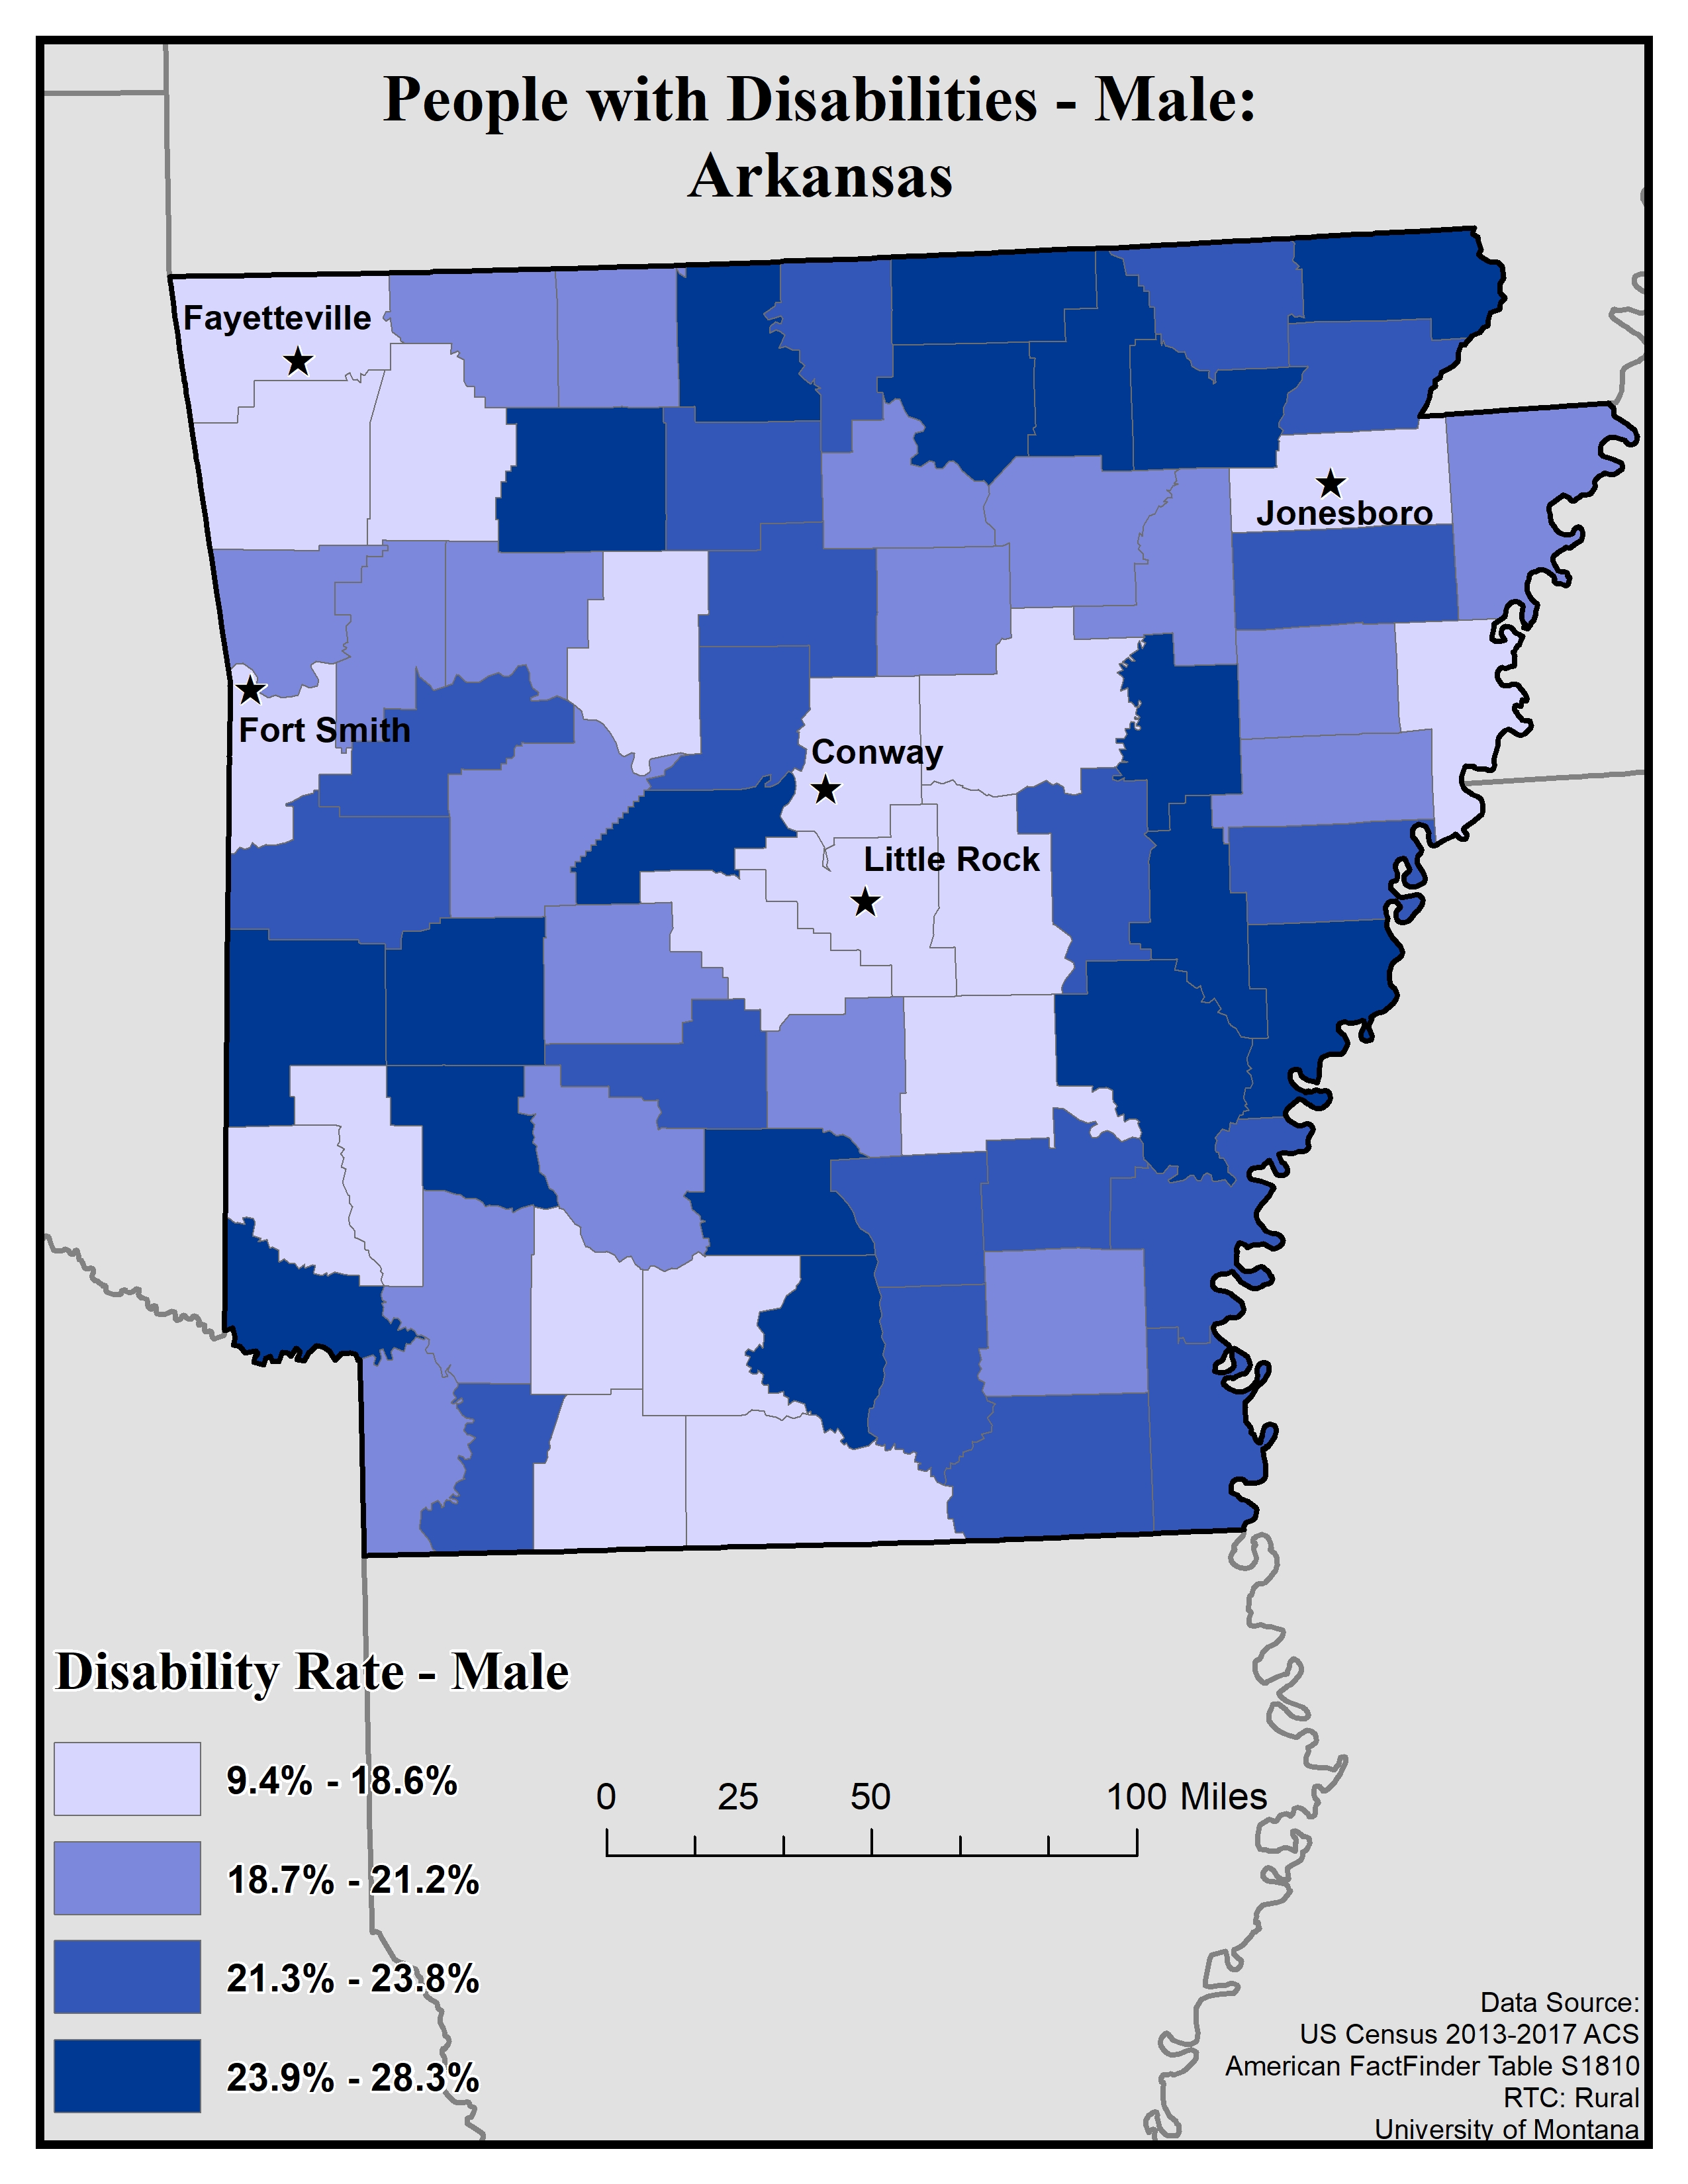
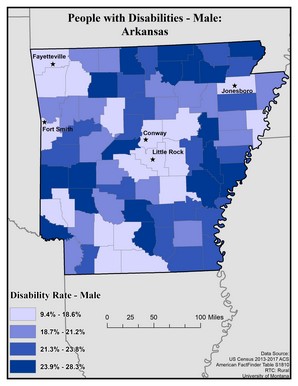 This map of the state of Arkansas shows disability rates among males by county. Rates are broken into four categories: 9.4 to 18.6%, 18.7 to 21.2%, 21.3 to 23.8%, and 23.9 to 28.3%.
The five largest urban areas (Fayetteville, Fort Smith, Conway, Little Rock, and Jonesboro) are labeled on the map to show if there are any differences between rates in urban areas compared to rural ones. Overall, rates are higher in rural counties than urban ones, though rates are varied across the state. Fayetteville, Fort Smith, Conway, Little Rock, and Jonesboro are in counties with the lowest rates, of 9.4 to 18.6%. There are areas of high rates (23.9 to 28.3%) in the rural counties along the northern border, as well as in rural counties scattered around the state.
Map produced November 2019 based on 2013-2017 American Community Survey data.
- Click on the map for a larger, downloadable version.
- To browse or download the data used to make this map, use our Disability Data Lookup Tool.
- For information on how biological sex is used and defined in the ACS, see “American Community Survey and Puerto Rico Community Survey 2017 Subject Definitions” page 125.
-
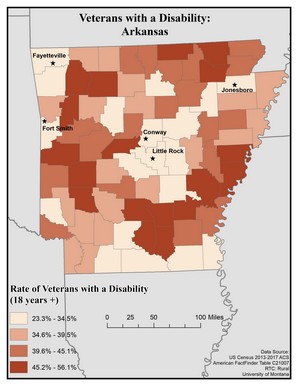 This map of the state of Arkansas shows disability rates among veterans (18 years and older) by county. Rates are broken into four categories: 23.3 to 34.5%, 34.6 to 39.5%, 39.6 to 45.1%, and 45.2 to 56.1%.
The five largest urban areas (Fayetteville, Fort Smith, Conway, Little Rock, and Jonesboro) are labeled to show if there are any differences between rates in urban vs rural areas. Rates are variable across the state, though they tend to be higher in rural versus urban counties. Rates are lowest (23.3 to 34.5%) in the center of the state, around each of the five labeled urban areas, and along the southern border of the state.
Map produced November 2019 based on 2013-2017 American Community Survey data.
- Click on the map for a larger, downloadable version.
- To browse or download the data used to make this map, use our Disability Data Lookup Tool.
-

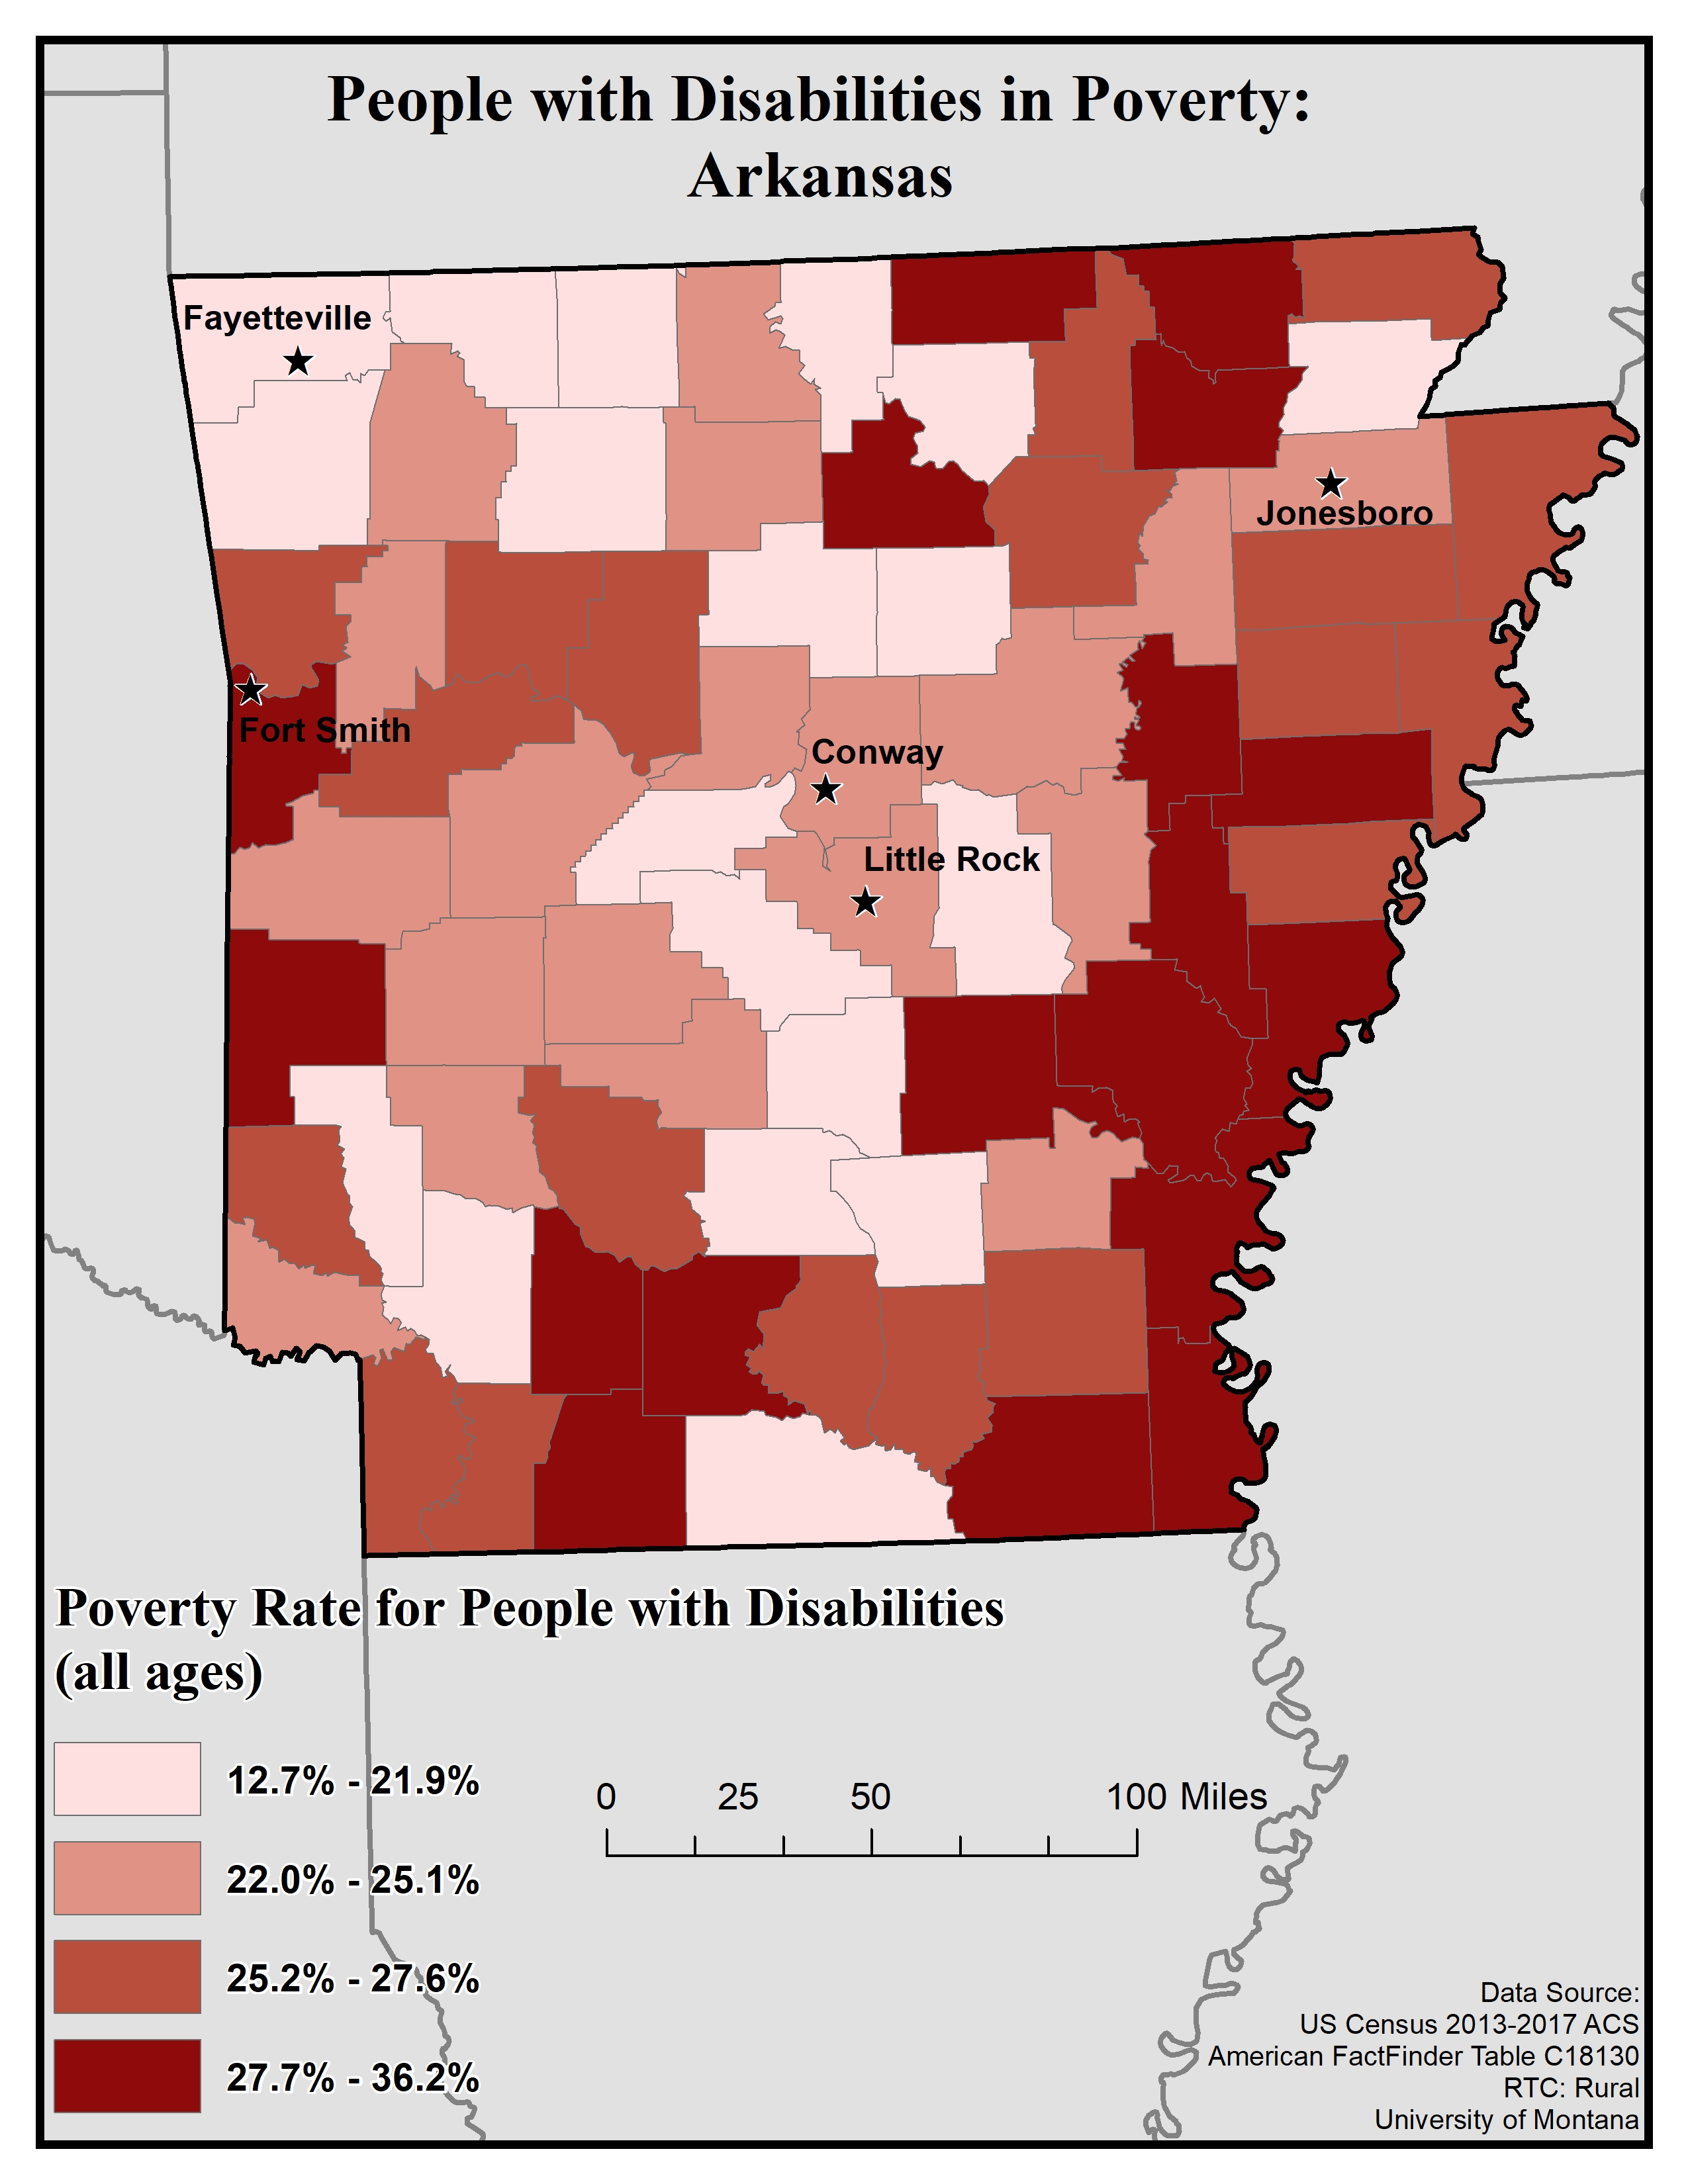
This map of the state of Arkansas shows poverty rates among people with disabilities by county. Poverty rates are broken into four levels: 12.7 to 21.9%, 22.0 to 25.1%, 25.2 to 27.6%, and 27.7 to 36.2%.
Of the 75 counties in Arkansas, 18 have the highest poverty rates among people with disabilities, at 27.7 to 36.2%, and 19 have the second-highest rates, of 25.2 to 27.6%. 19 counties have rates of 22.0 to 25.1%, and the remaining 19 counties have rates of 12.7 to 21.9%.
Overall, rates of poverty among people with disabilities tend to be higher in rural areas.
Map produced July 2019 based on 2013-2017 American Community Survey data.
- Click on the map for a larger, downloadable version.
- To browse or download the data used to make this map, use our Disability Data Lookup Tool.

Employment: Arkansas
-
This map explores American Community Survey (ACS) 5-year data (Table C18120) employment estimates by disability type.
The ACS asks a set of disability indicator questions to determine disability. If a respondent can answer “yes” to any disability question they are classified as having a disability. The data below are for ages 18-64.
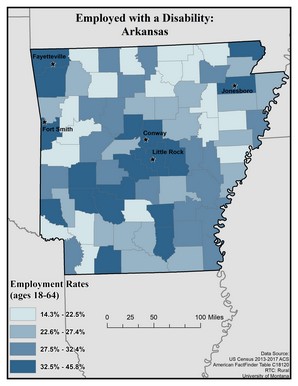
This map of Arkansas shows employment rates among people with disabilities. The data includes people ages 18 to 64. Rates are broken into four categories: 14.3 to 22.5%, 22.6 to 27.4%, 27.5 to 32.4%, and 32.5 to 45.8%.
Overall, there are higher employment rates for people with disabilities in urban counties than rural ones. However, this is somewhat variable across the state.
The five largest urban areas (Fayetteville, Fort Smith, Conway, Little Rock, and Jonesboro) are labeled on the map to show if there are any differences between rates in urban compared to rural areas. Rates in the counties containing Fayetteville, Fort Smith, Conway, Little Rock, and Jonesboro are in the highest category, of 32.5 to 45.8%.
Counties with the lowest rates, of 14.3 to 22.5%, are scattered across the state, and most counties have rates of the second-highest rate (22.6 to 27.4%) or higher.
Map produced November 2019 based on 2013-2017 American Community Survey data.
- Click on the map for a larger, downloadable version.
- To browse or download the data used to make this map, use our Disability Data Lookup Tool.
-
This map explores American Community Survey (ACS) 5-year data (Table C18120) employment estimates by disability type.
The ACS asks a set of disability indicator questions to determine disability. If a respondent can answer “yes” to any disability question they are classified as having a disability. The data below are for ages 18-64.
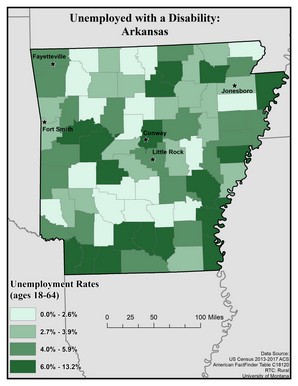
This map of Arkansas shows unemployment rates among people with disabilities. The data includes people ages 18 to 64. Rates are broken into four categories: 0.0 to 2.6%, 2.7 to 3.9%, 4.0 to 5.9%, and 6.0 to 13.2%.
The five largest urban areas (Fayetteville, Fort Smith, Conway, Little Rock, and Jonesboro) are labeled on the map to show if there are any differences between rates in urban compared to rural areas. Overall, rates are scattered across the state, though higher rates of unemployment tend to be found in more rural counties. Fort Smith and Jonesboro are in counties with the second-lowest rate of 2.7 to 3.9%, Fayetteville and Little Rock are in counties with the second-highest rate of 4.0 to 5.9%, and Conway is in a county with the highest rate of unemployment for people with disabilities, at 6.0 to 13.2%.
Note: It is important to consider unemployment rates in addition to out of the labor force rates. This map only shows people with disabilities who are in the labor force.
Map produced November 2019 based on 2013-2017 American Community Survey data.
- Click on the map for a larger, downloadable version.
- To browse or download the data used to make this map, use our Disability Data Lookup Tool.
-
This map explores American Community Survey (ACS) 5-year data (Table C18120) employment estimates by disability type.
The ACS asks a set of disability indicator questions to determine disability. If a respondent can answer “yes” to any disability question they are classified as having a disability. The data below are for ages 18-64.
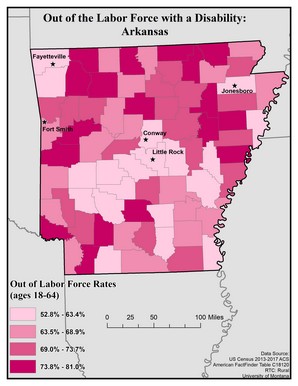
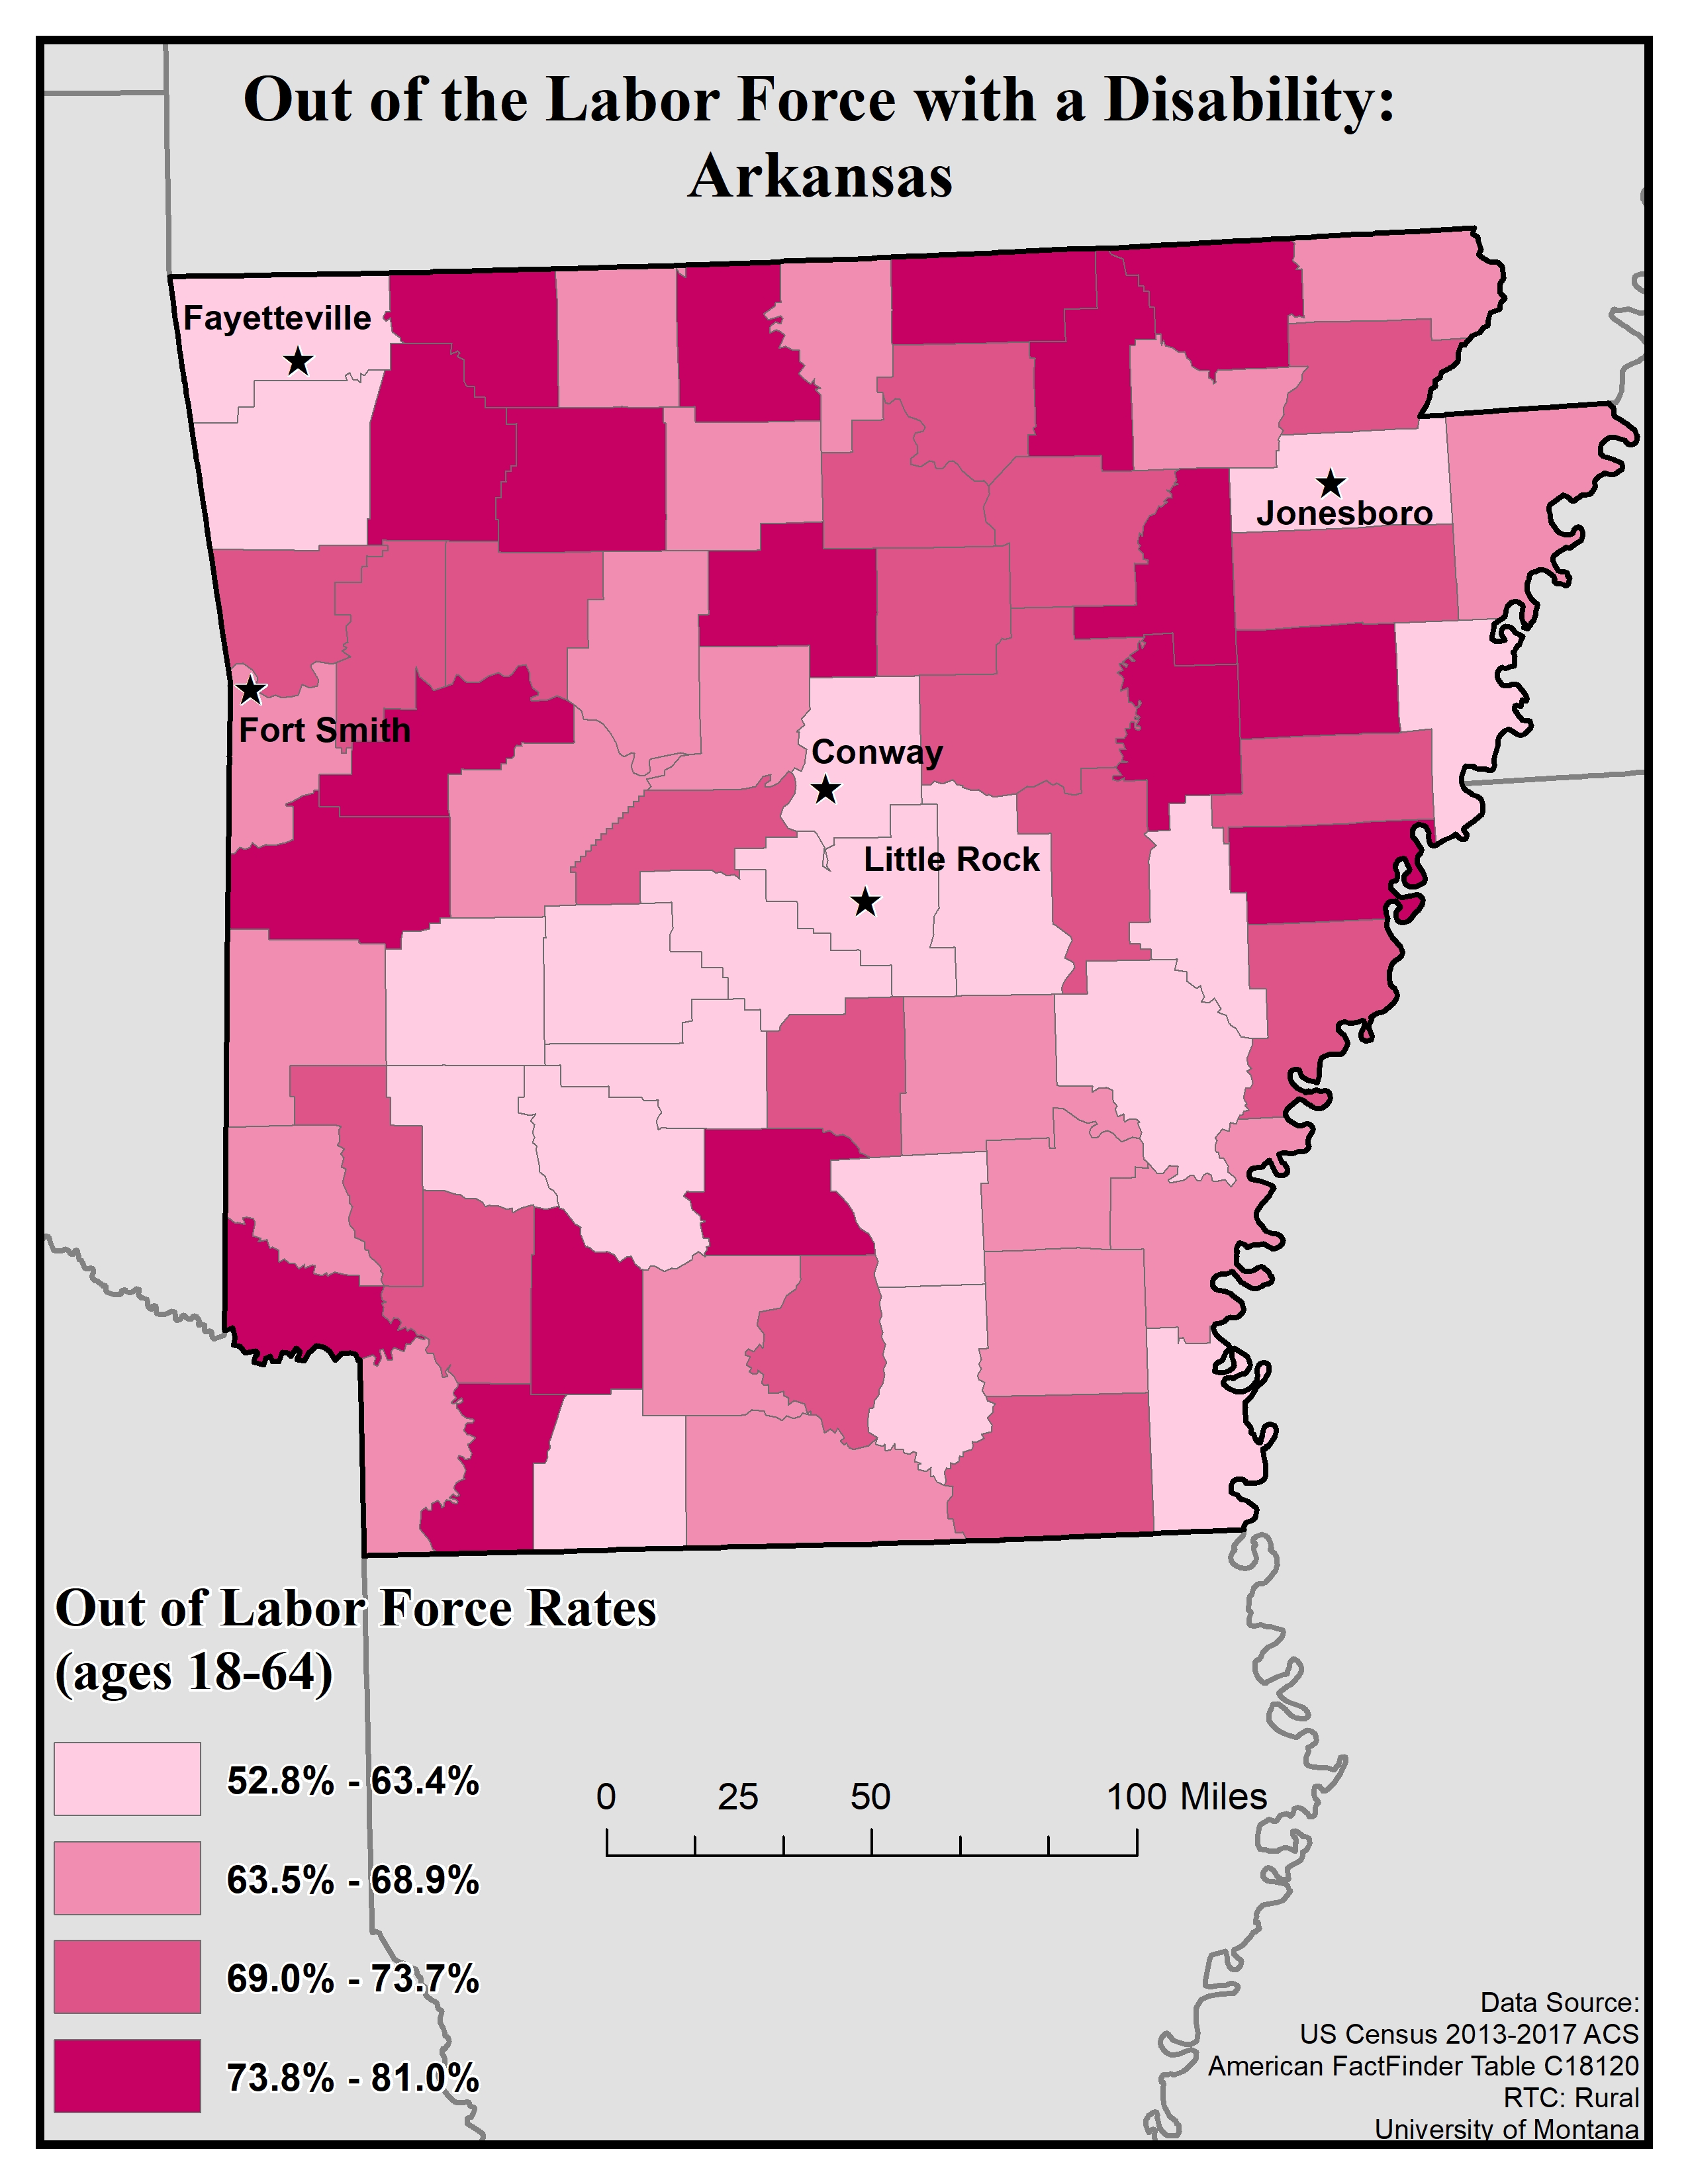
This map of Arkansas shows rates of people with disabilities who are out of the labor force. The data includes people ages 18 to 64. Rates are broken into four categories: 52.8 to 63.4%, 63.5 to 68.9%, 69.0 to 73.7%, and 73.8 to 81.0%.
The five largest urban areas (Fayetteville, Fort Smith, Conway, Little Rock, and Jonesboro) are labeled on the map to show if there are any differences between rates in urban compared to rural areas.
Overall, rates are scattered across the state, though higher rates of people with disabilities out of the labor force tend to be found in more rural counties. There also seem to be higher rates in the northern half of the state. Fayetteville, Conway, Little Rock, and Jonesboro are in counties with the lowest rate, of 52.8 to 63.4%. Fort Smith is in a county with the second-highest rate, of 63.5 to 68.9%.
Map produced November 2019 based on 2013-2017 American Community Survey data.
- Click on the map for a larger, downloadable version.
- To browse or download the data used to make this map, use our Disability Data Lookup Tool.


Disability Rates by Functional Limitation: Arkansas
-
This map explores the American Community Survey (ACS) 5-year data (Table S1810) on disability estimates by county.
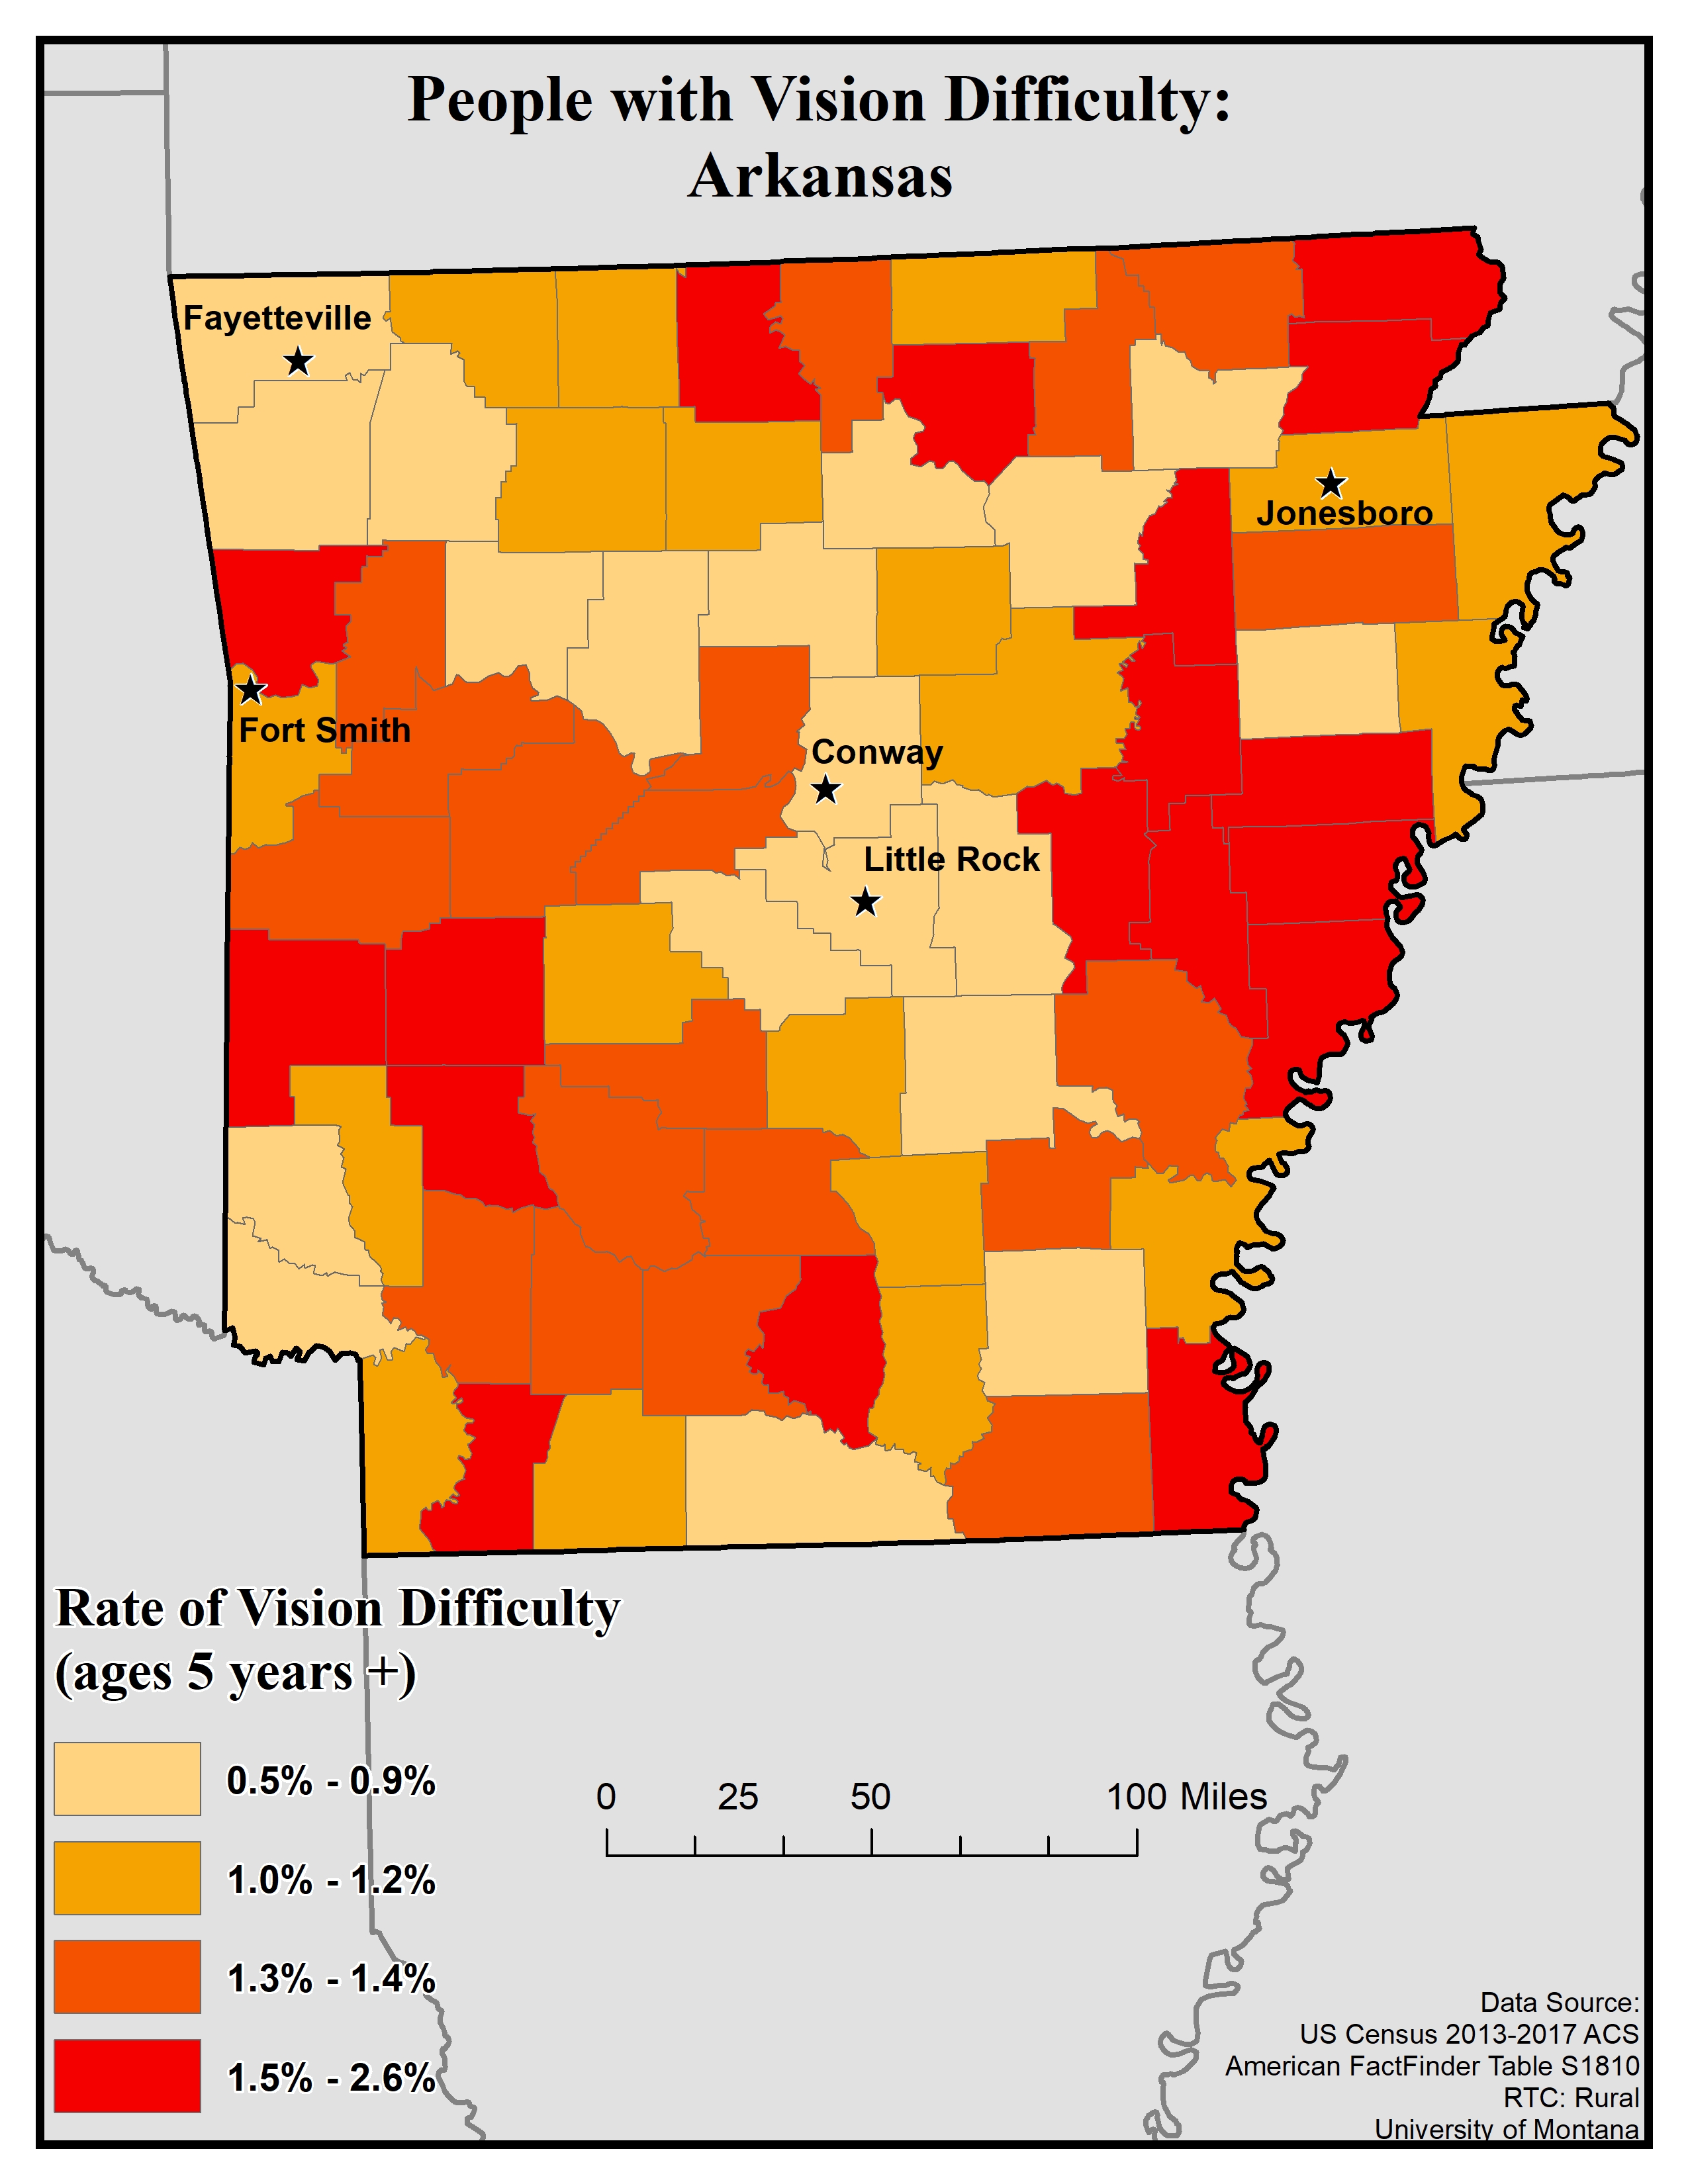
For vision difficulty the ACS asks if a respondent is blind or has serious difficulty seeing, even when wearing glasses. If they answer “yes” they are classified as having a vision difficulty. This data is for all ages.
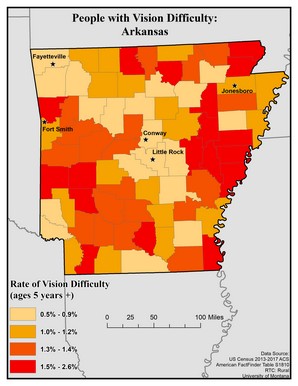
This map of the state of Arkansas shows rates of people with vision difficulty for ages 5 and older by county. Rates are broken into four categories: 0.5 to 0.9%, 1.0 to 1.2%, 1.3 to 1.4%, and 1.5 to 2.6%.
The five largest urban areas (Fayetteville, Fort Smith, Conway, Little Rock, and Jonesboro) are labeled on the map to show if there are any differences between rates in urban areas compared to rural ones. Overall, there are higher rates in rural counties than urban ones. All of the counties with the highest rates, of 1.5 to 2.6%, are in rural counties. Fayetteville, Conway, and Little Rock are in counties with the lowest rates, of 0.5 to 0.9%. Fort Smith and Jonesboro are in counties with the second-lowest rate, of 1.0 to 1.2%. East of Little Rock is an area of rural counties with the highest rates (1.5 to 2.6%). There are large areas of counties with the second-highest rates, of 1.3 to 1.4%, in the rural counties between Fort Smith and Conway/Little Rock areas, as well as south-west of Little Rock, towards the southern border of the state.
Map produced November 2019 based on 2013-2017 American Community Survey data.
- Click on the map for a larger, downloadable version.
- To browse or download the data used to make this map, use our Disability Data Lookup Tool.
-
This map explores the American Community Survey (ACS) 5-year data (Table S1810) on disability estimates by county.
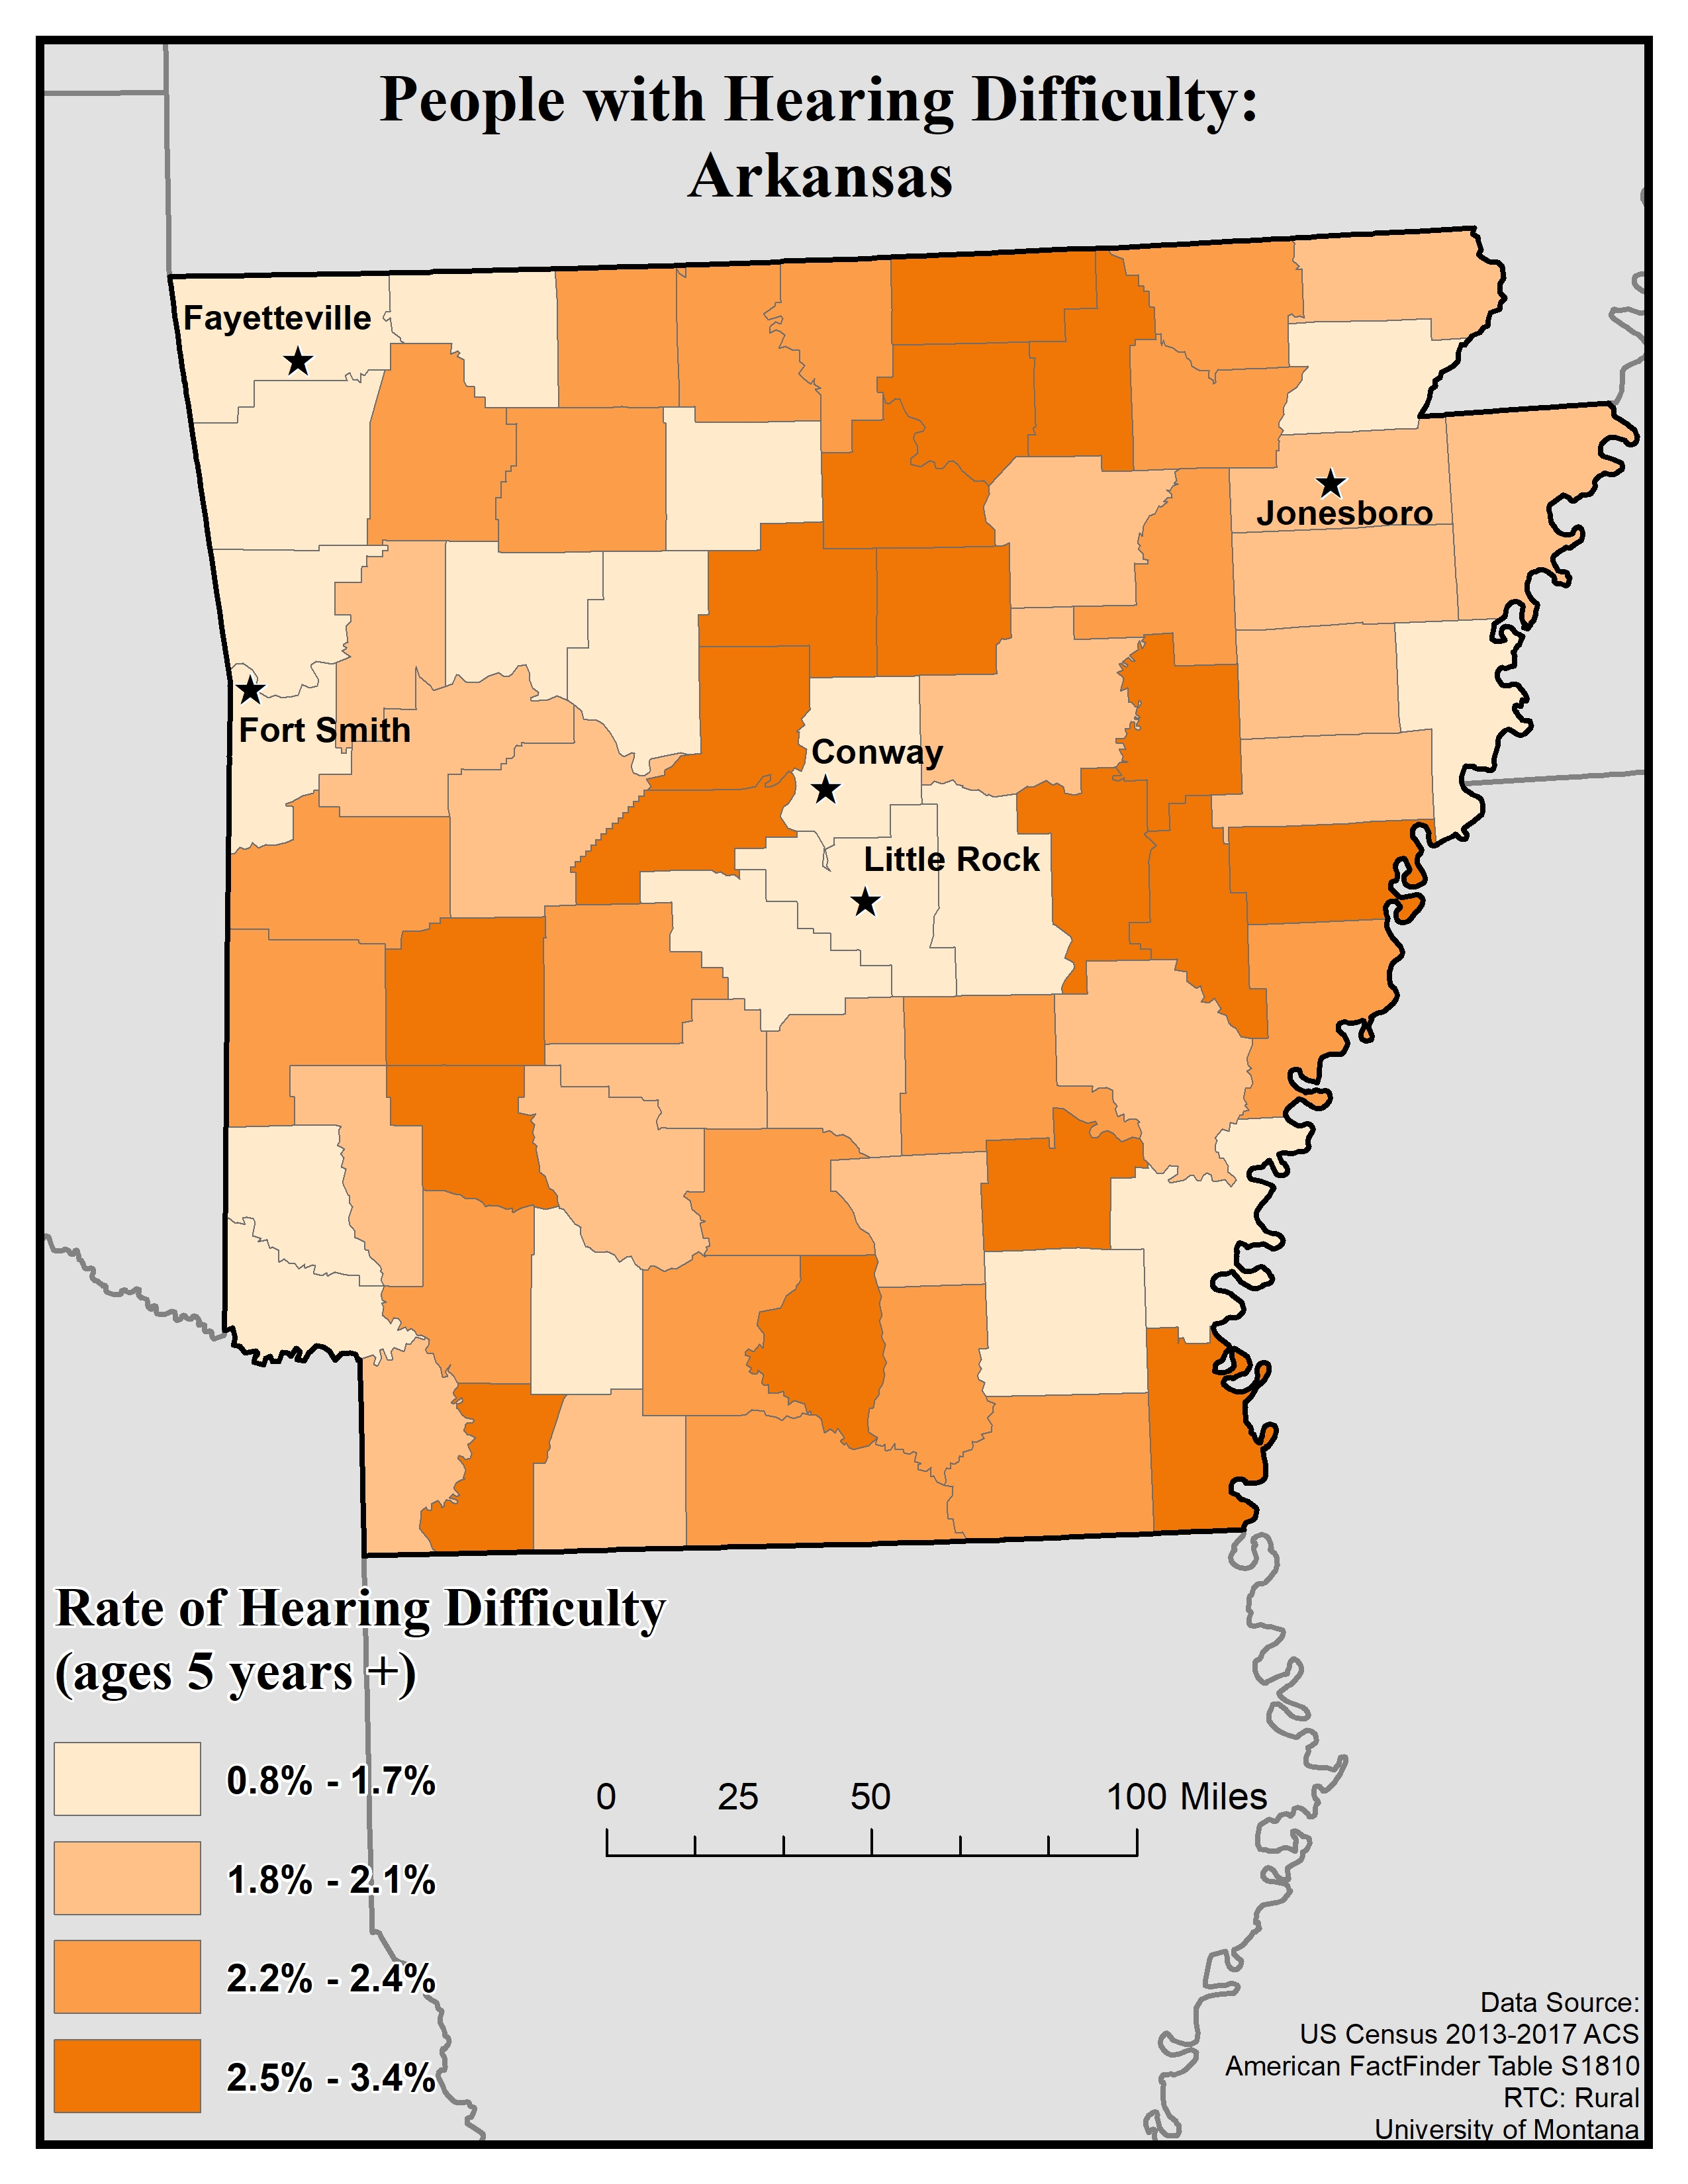
For hearing difficulty the ACS asks if a respondent is deaf or has serious difficulty hearing. If they answer “yes” they are classified as having a hearing difficulty. This data is for all ages.
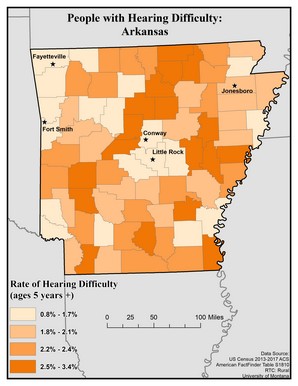
This map of the state of Arkansas shows rates of people with vision difficulty for ages 5 and older by county. Rates are broken into four categories: 0.8 to 1.7%, 1.8 to 2.1%, 2.2 to 2.4%, and 2.5 to 3.4%.
The five largest urban areas (Fayetteville, Fort Smith, Conway, Little Rock, and Jonesboro) are labeled on the map to show if there are any differences between rates in urban areas compared to rural ones. Overall, there are higher rates in rural counties than urban ones, though rates are varied across the state. All of the counties with the highest rates, of 2.5 to 3.4%, are in rural counties. Fayetteville, Fort Smith, Conway, and Little Rock are in counties with the lowest rates, of 0.8 to 1.7%. Jonesboro is in a county with the second-lowest rate, of 1.8 to 2.1%.
Map produced November 2019 based on 2013-2017 American Community Survey data.
- Click on the map for a larger, downloadable version.
- To browse or download the data used to make this map, use our Disability Data Lookup Tool.
-
This map explores the American Community Survey (ACS) 5-year data (Table S1810) on disability estimates by county.
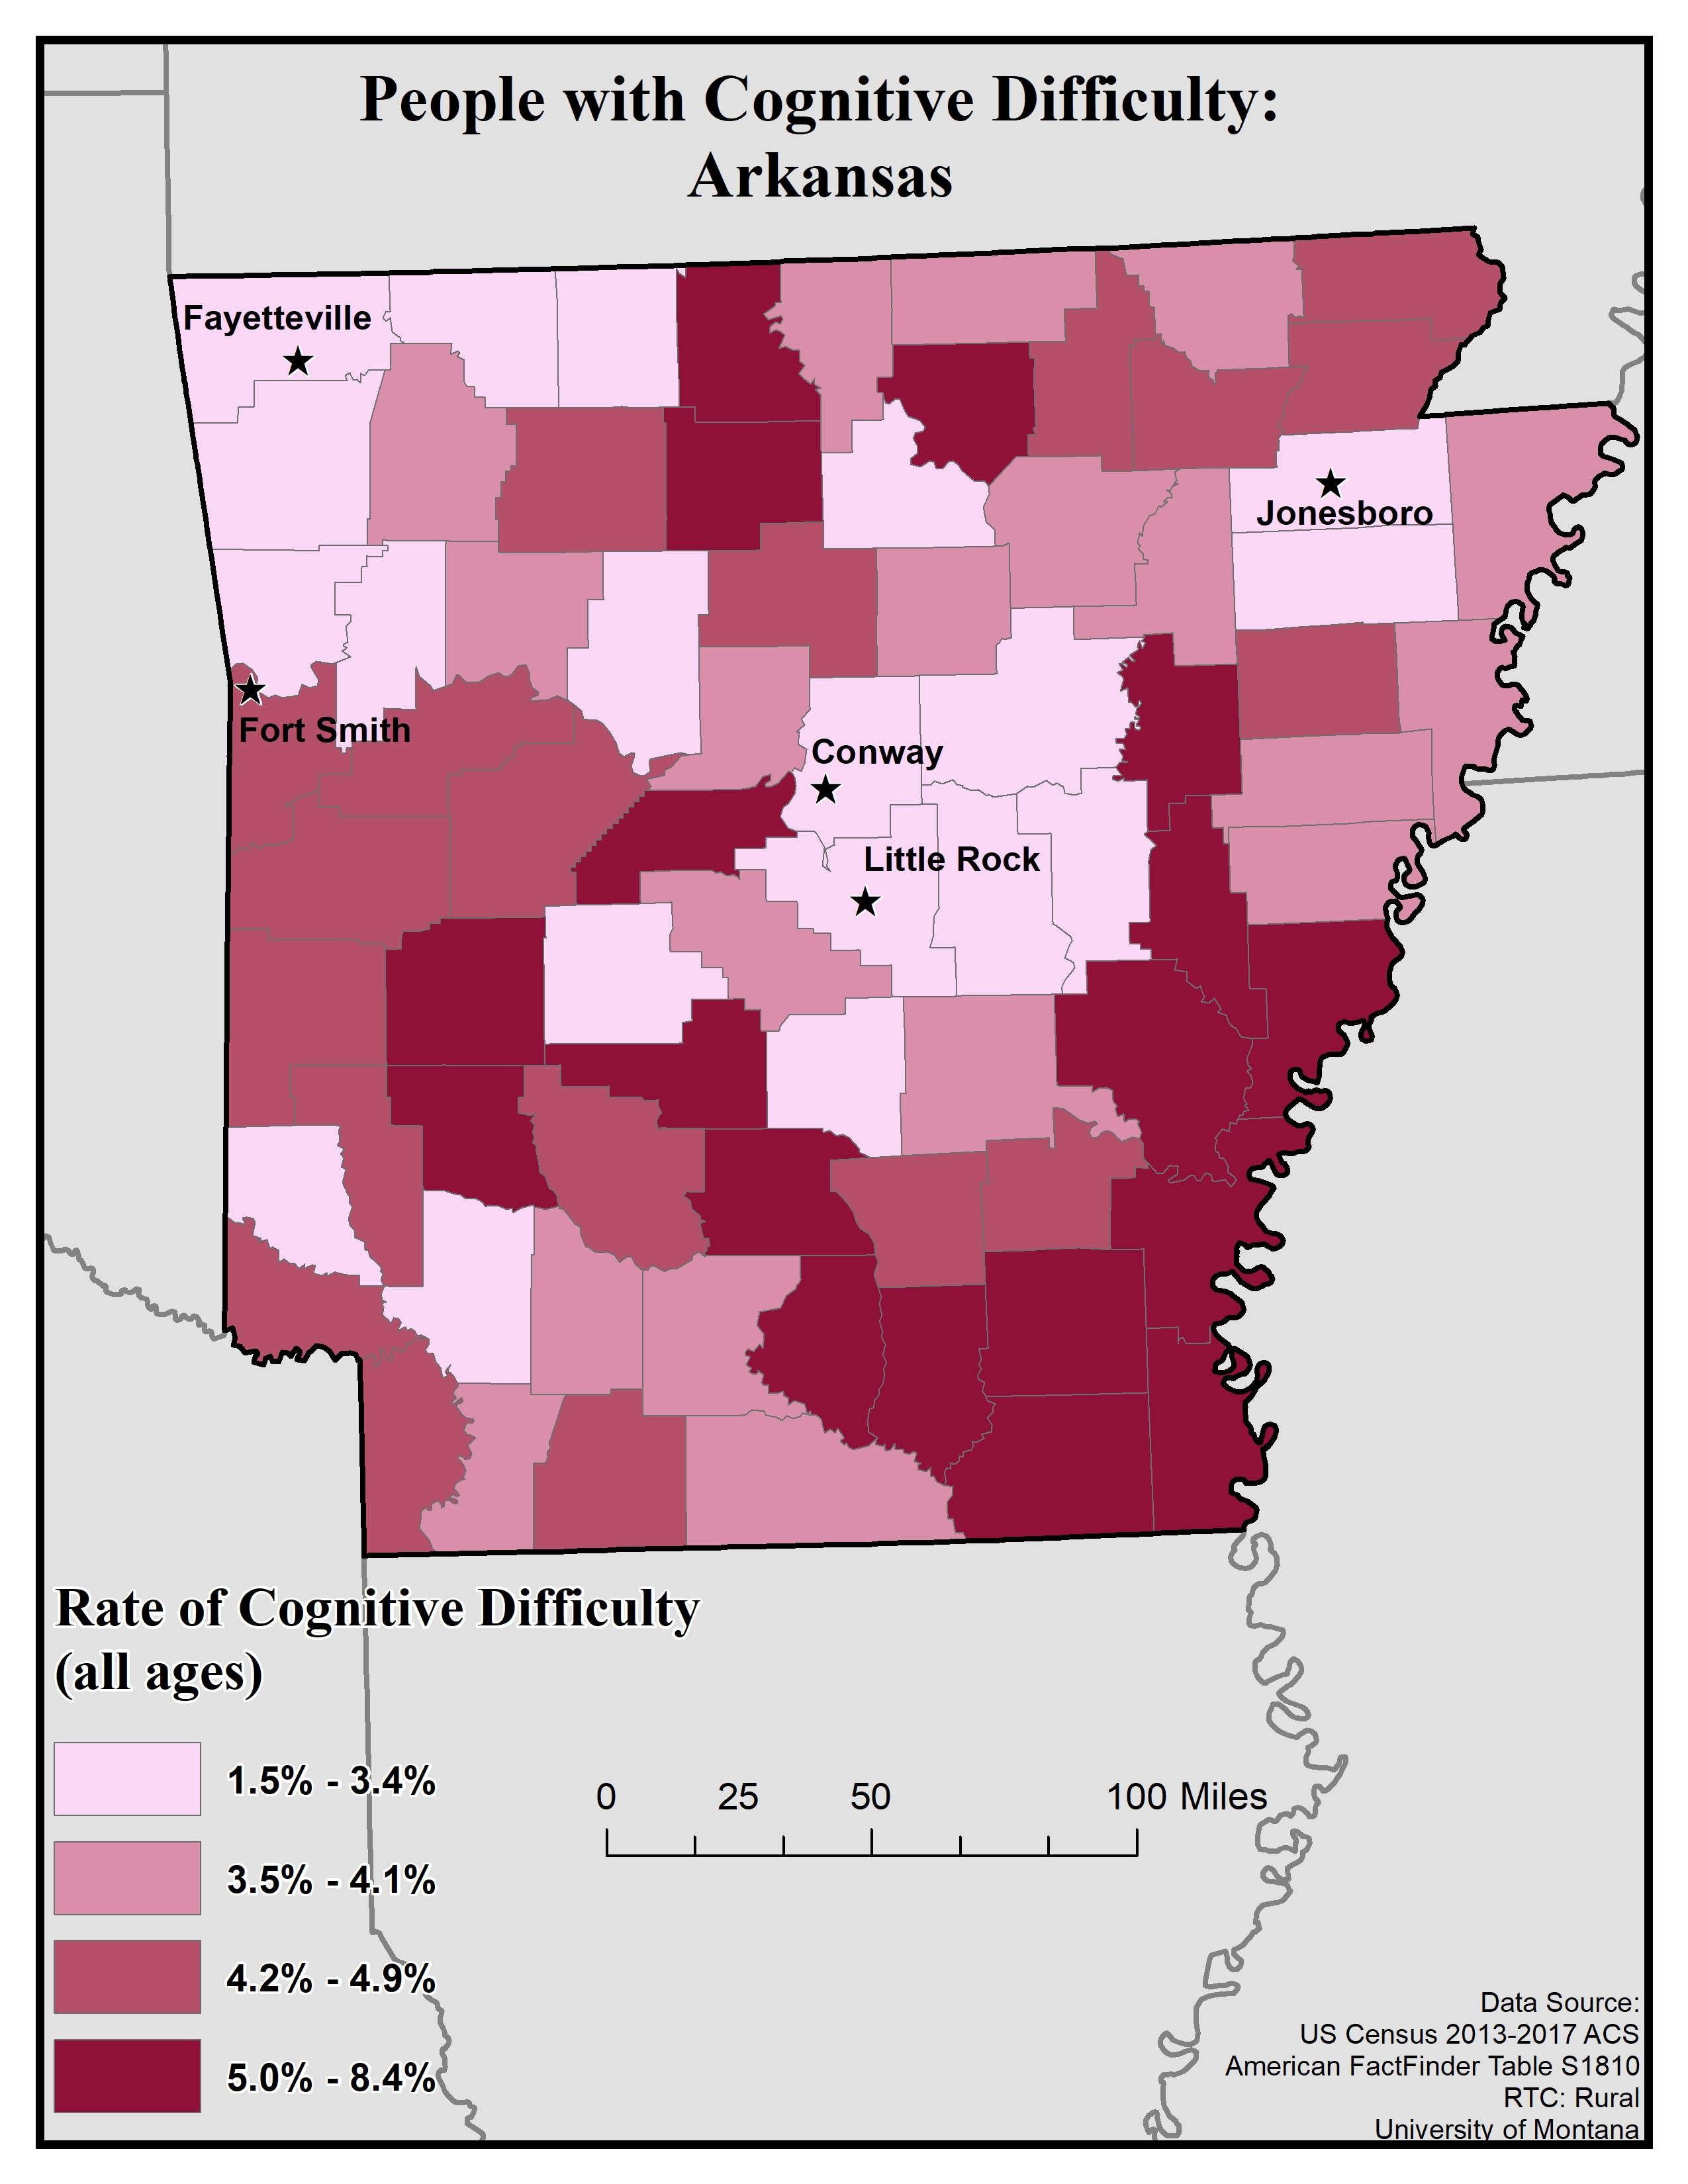
For cognitive difficulty the ACS asks because of a physical, mental, or emotional problem, does the respondent have difficulty remembering, concentrating, or making decisions. If they answer “yes” they are classified as having a cognitive difficulty. This data is for ages 5 and up.

This map of the state of Arkansas shows rates of people with cognitive difficulty by county. Rates are broken into four categories: 1.5 to 3.4%, 3.5 to 4.1%, 4.2 to 4.9%, and 5.0 to 8.4%.
The five largest urban areas (Fayetteville, Fort Smith, Conway, Little Rock, and Jonesboro) are labeled on the map to show if there are any differences between rates in urban areas compared to rural ones. Overall, there are higher rates in rural counties than urban ones, though rates are somewhat varied across the state. Fayetteville, Conway, Little Rock, and Jonesboro are in counties with the lowest rates, of 1.5 to 3.4%. Fort Smith is in a county with the second-highest rate, of 4.5 to 4.9%. The counties south of Fort Smith also have rates of 4.5 to 4.9%. There is an area of counties with the highest rate, of 5.0 to 8.4%, along the southeastern border of the state and in the southeastern corner of the state.
Map produced November 2019 based on 2013-2017 American Community Survey data.
- Click on the map for a larger, downloadable version.
- To browse or download the data used to make this map, use our Disability Data Lookup Tool.
-
This map explores the American Community Survey (ACS) 5-year data (Table S1810) on disability estimates by county.
For ambulatory (i.e. mobility) difficulty the ACS asks if a respondent has serious difficulty walking or climbing stairs. If they answer “yes” they are classified as having a mobility difficulty. This data is for ages 5 and up.
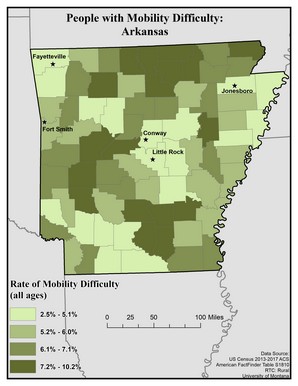 This map of the state of Arkansas shows rates of people with mobility difficulty by county. Rates are broken into four categories: 2.5 to 5.1%, 5.2 to 6.0%, 6.1 to 7.1%, and 7.2 to 10.2%.
 The five largest urban areas (Fayetteville, Fort Smith, Conway, Little Rock, and Jonesboro) are labeled on the map to show if there are any differences between rates in urban areas compared to rural ones. Overall, there are higher rates in rural counties than urban ones, though rates are somewhat varied across the state. Fayetteville, Conway, Little Rock, and Jonesboro are in counties with the lowest rates, of 2.5 to 5.1%. Fort Smith is in a county with the second-highest rate, of 5.2 to 6.0%. High rates (7.2 to 10.2%) can be found in counties along the northern border directly north of Conway, as well as in a few other counties around the state, most of which are rural.
Map produced July 2019 based on 2013-2017 American Community Survey data.
- Click on the map for a larger, downloadable version.
- To browse or download the data used to make this map, use our Disability Data Lookup Tool.
-
This map explores the American Community Survey (ACS) 5-year data (Table S1810) on disability estimates by county.
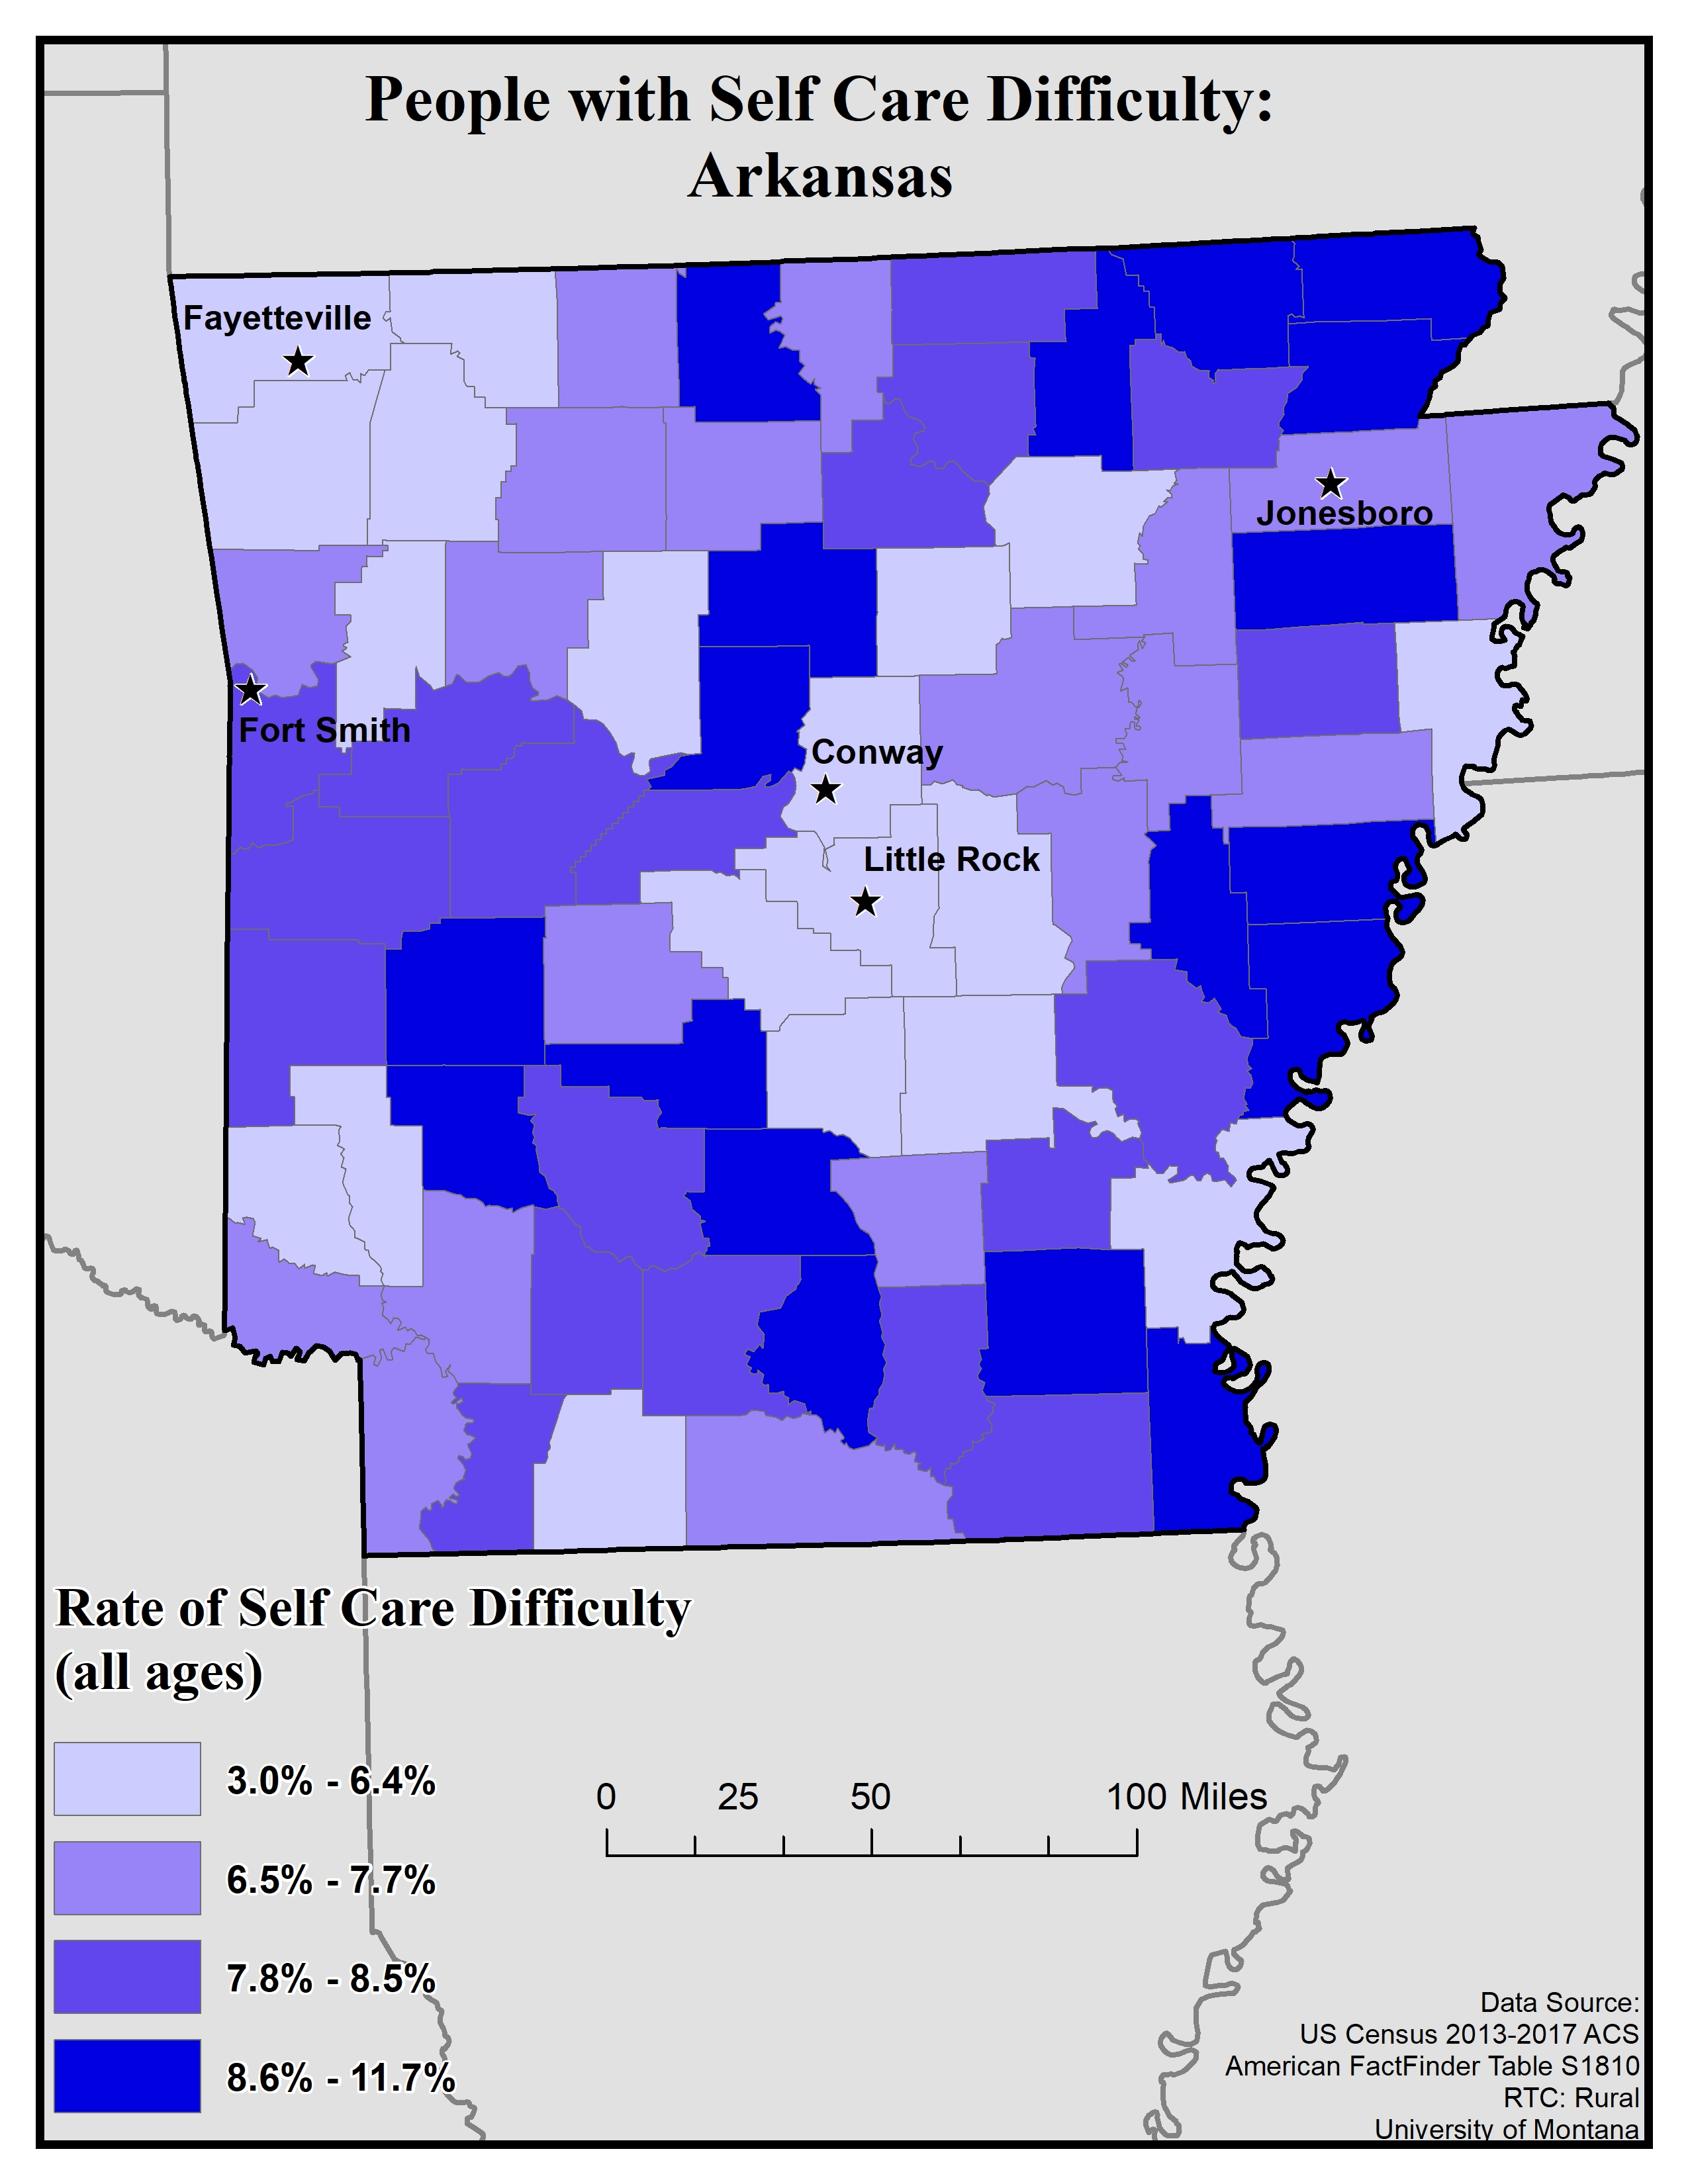
For self-care difficulty the ACS asks if a respondent has difficulty bathing or dressing. If they answer “yes” they are classified as having a self-care difficulty. This data is for ages 5 and up.
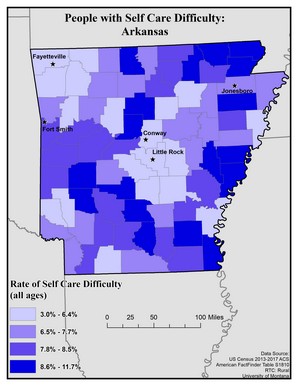
This map of the state of Arkansas shows rates of people with self care difficulty by county. Rates are broken into four categories: 3.0 to 6.4%, 6.5 to 7.7%, 7.8 to 8.5%, and 8.6 to 11.7%.
The five largest urban areas (Fayetteville, Fort Smith, Conway, Little Rock, and Jonesboro) are labeled on the map to show if there are any differences between rates in urban areas compared to rural ones. Overall, there are higher rates in rural counties than urban ones, though rates are somewhat varied across the state. Fayetteville, Conway, and Little Rock are in counties with the lowest rates, of 3.0 to 6.4%. Jonesboro is in a county with the second-lowest rate, of 6.5 to 7.7%, and Fort Smith is in a county with the second-highest rate, of 7.8 to 8.5%. There is an area of similar rates south of Fort Smith. The highest rates, of 8.6 to 11.7%, can be found in rural counties along the northern border as well as scattered across the state.
Map produced November 2019 based on 2013-2017 American Community Survey data.
- Click on the map for a larger, downloadable version.
- To browse or download the data used to make this map, use our Disability Data Lookup Tool.
-
This map explores the American Community Survey (ACS) 5-year data (Table S1810) on disability estimates by county.
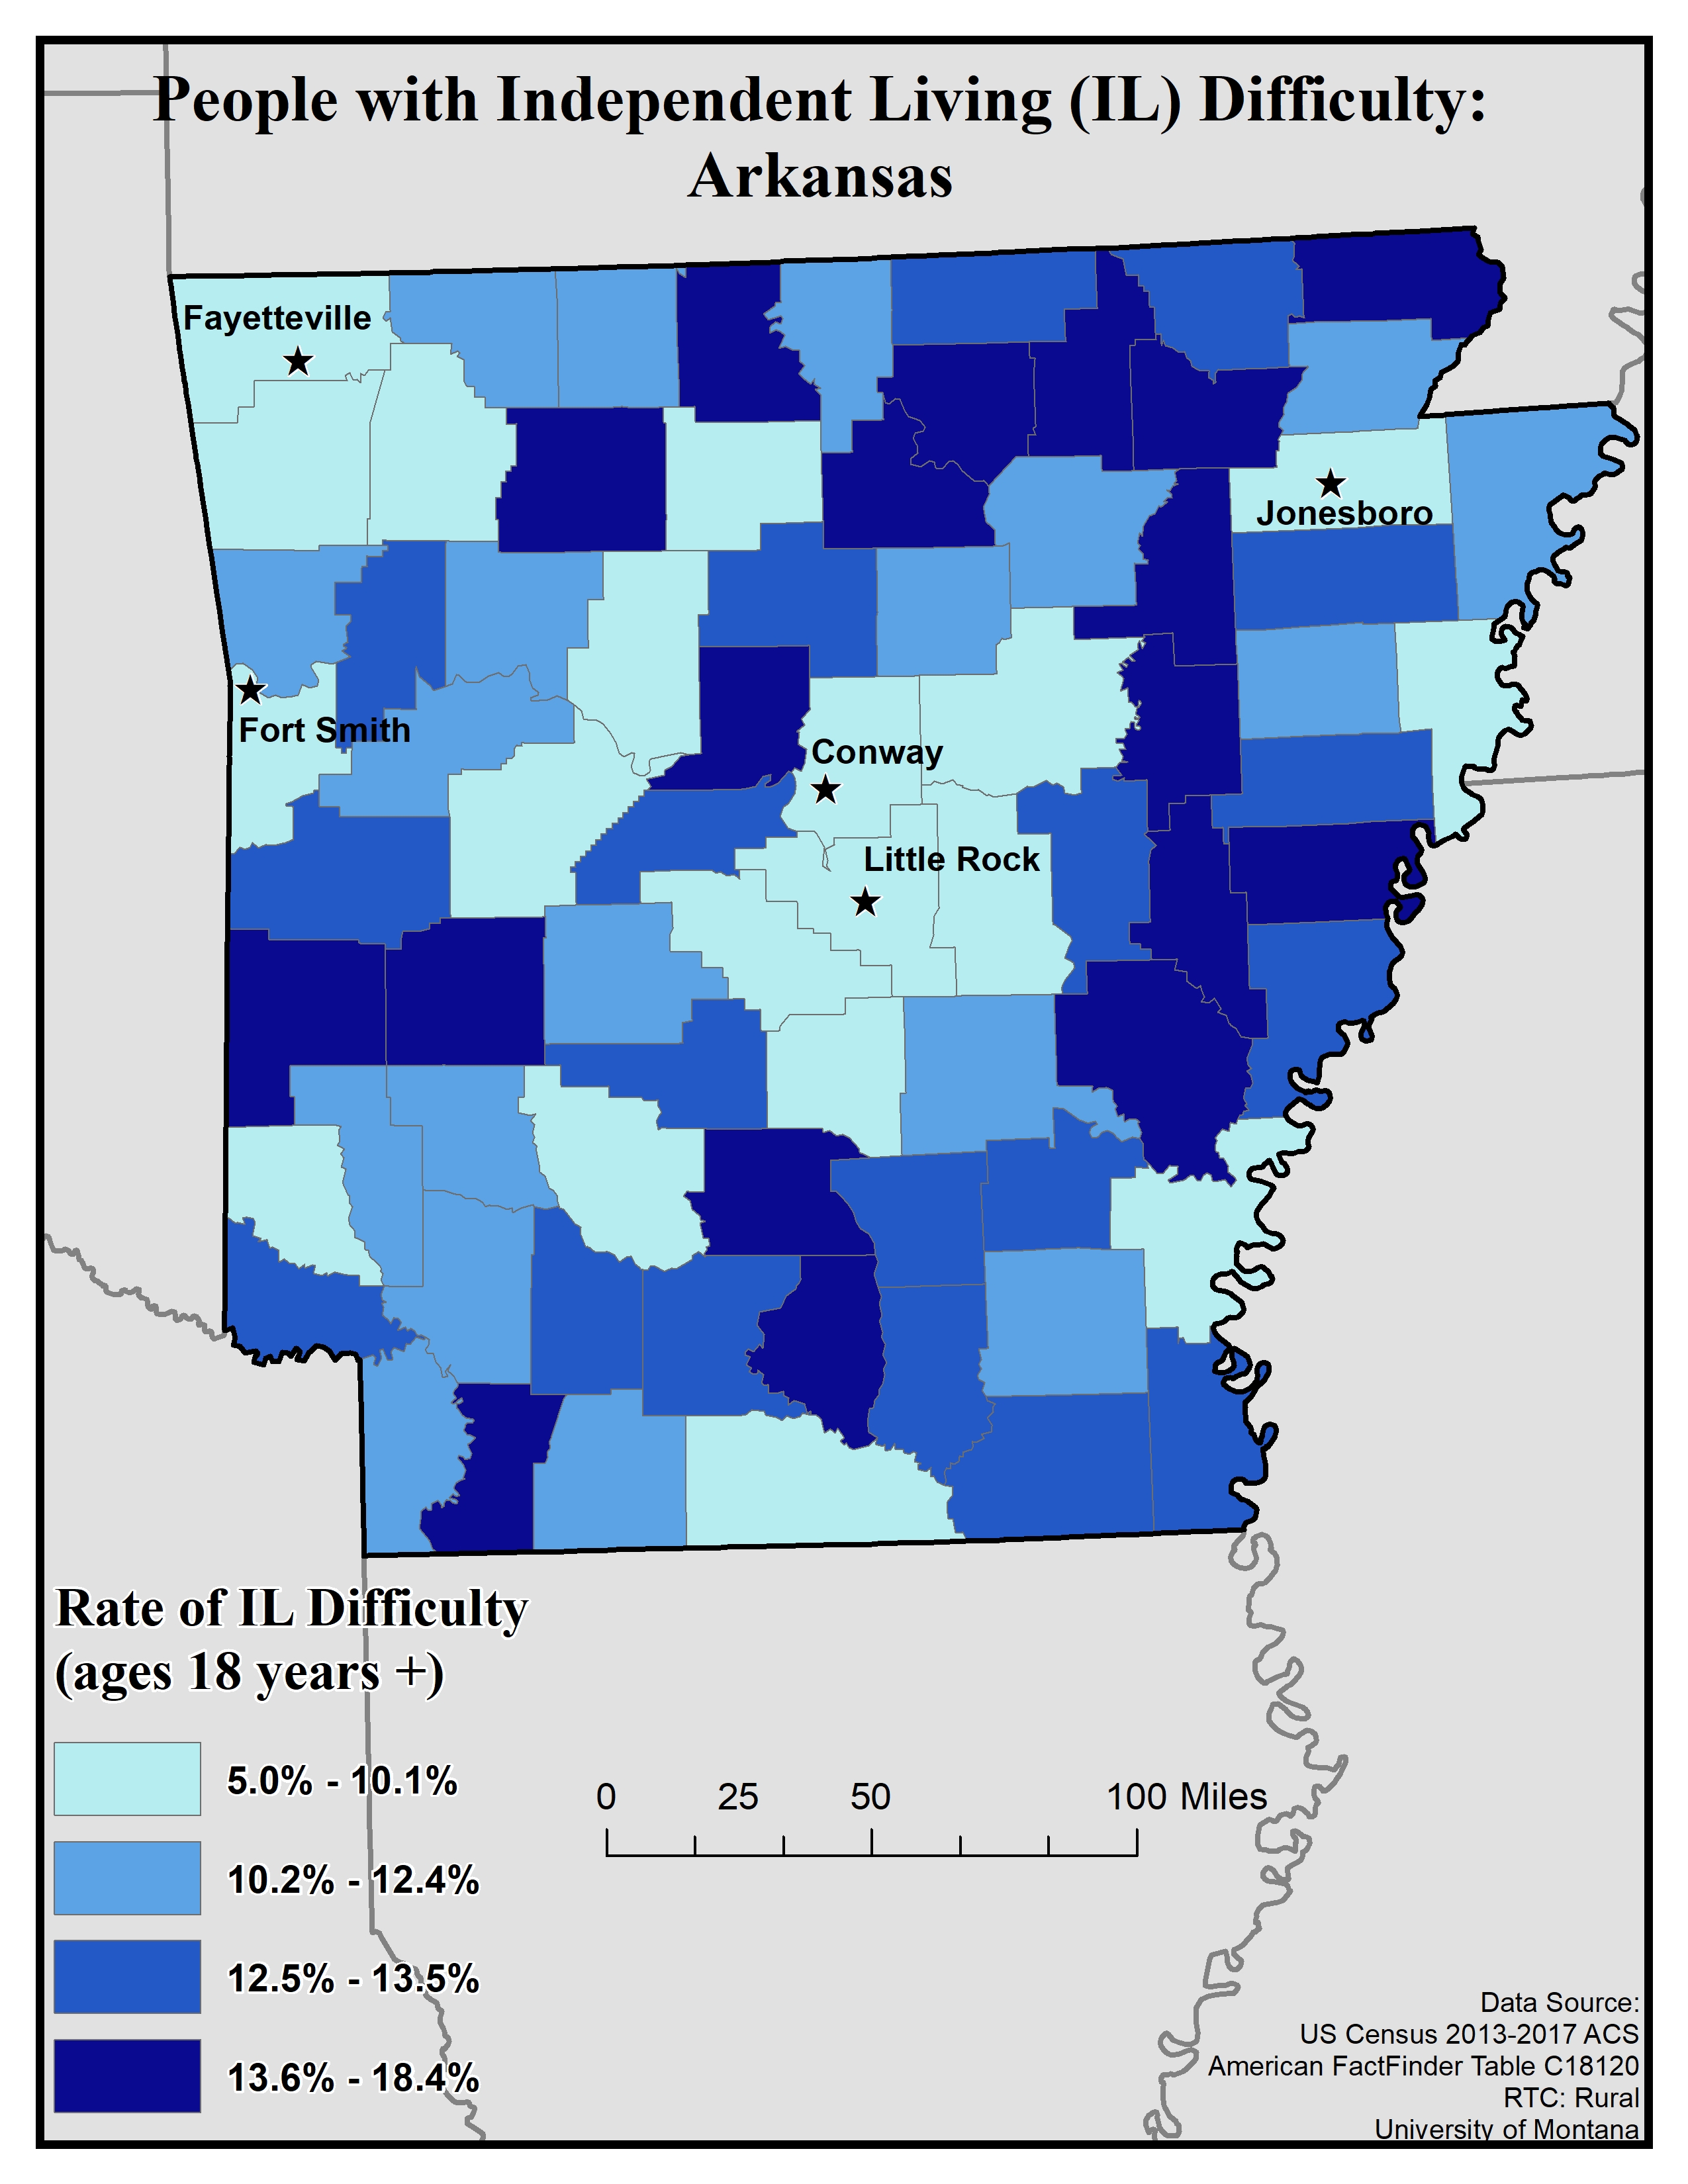
For independent living difficulty the ACS asks because of a physical, mental, or emotional problem, does the respondent have difficulty doing errands alone such as visiting a doctor’s office or shopping. If they answer “yes” they are classified as having an independent living difficulty. This data is for ages 18 and up.
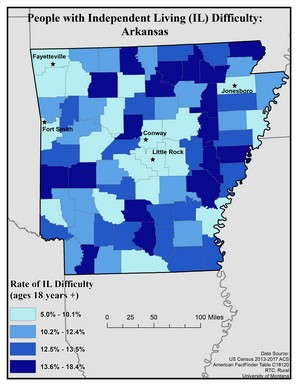
This map of the state of Arkansas shows rates of people with Independent Living (IL) difficulty by county. Rates are broken into four categories: 5.0 to 10.1%, 10.2 to 12.4%, 12.5 to 13.5%, and 13.6 to 18.4%.
The five largest urban areas (Fayetteville, Fort Smith, Conway, Little Rock, and Jonesboro) are labeled on the map to show if there are any differences between rates in urban areas compared to rural ones. Overall, there are higher rates in rural counties than urban ones, though rates are somewhat varied across the state. Fayetteville, Fort Smith, Conway, Little Rock, and Jonesboro are in counties with the lowest rates, of 5.0 to 10.1%.
Map produced November 2019 based on 2013-2017 American Community Survey data.
- Click on the map for a larger, downloadable version.
- To browse or download the data used to make this map, use our Disability Data Lookup Tool.