The maps on this page explore the American Community Survey 5-year data (Table S1810) on disability by county.
The ACS does not directly measure disability. Instead, it uses a set of disability indicator questions related to difficulty and functional impairment to identify individuals who may experience a disability. If a respondent can answer “yes” to any disability question they are classified as having a disability.
Disability Rates: Wyoming
-

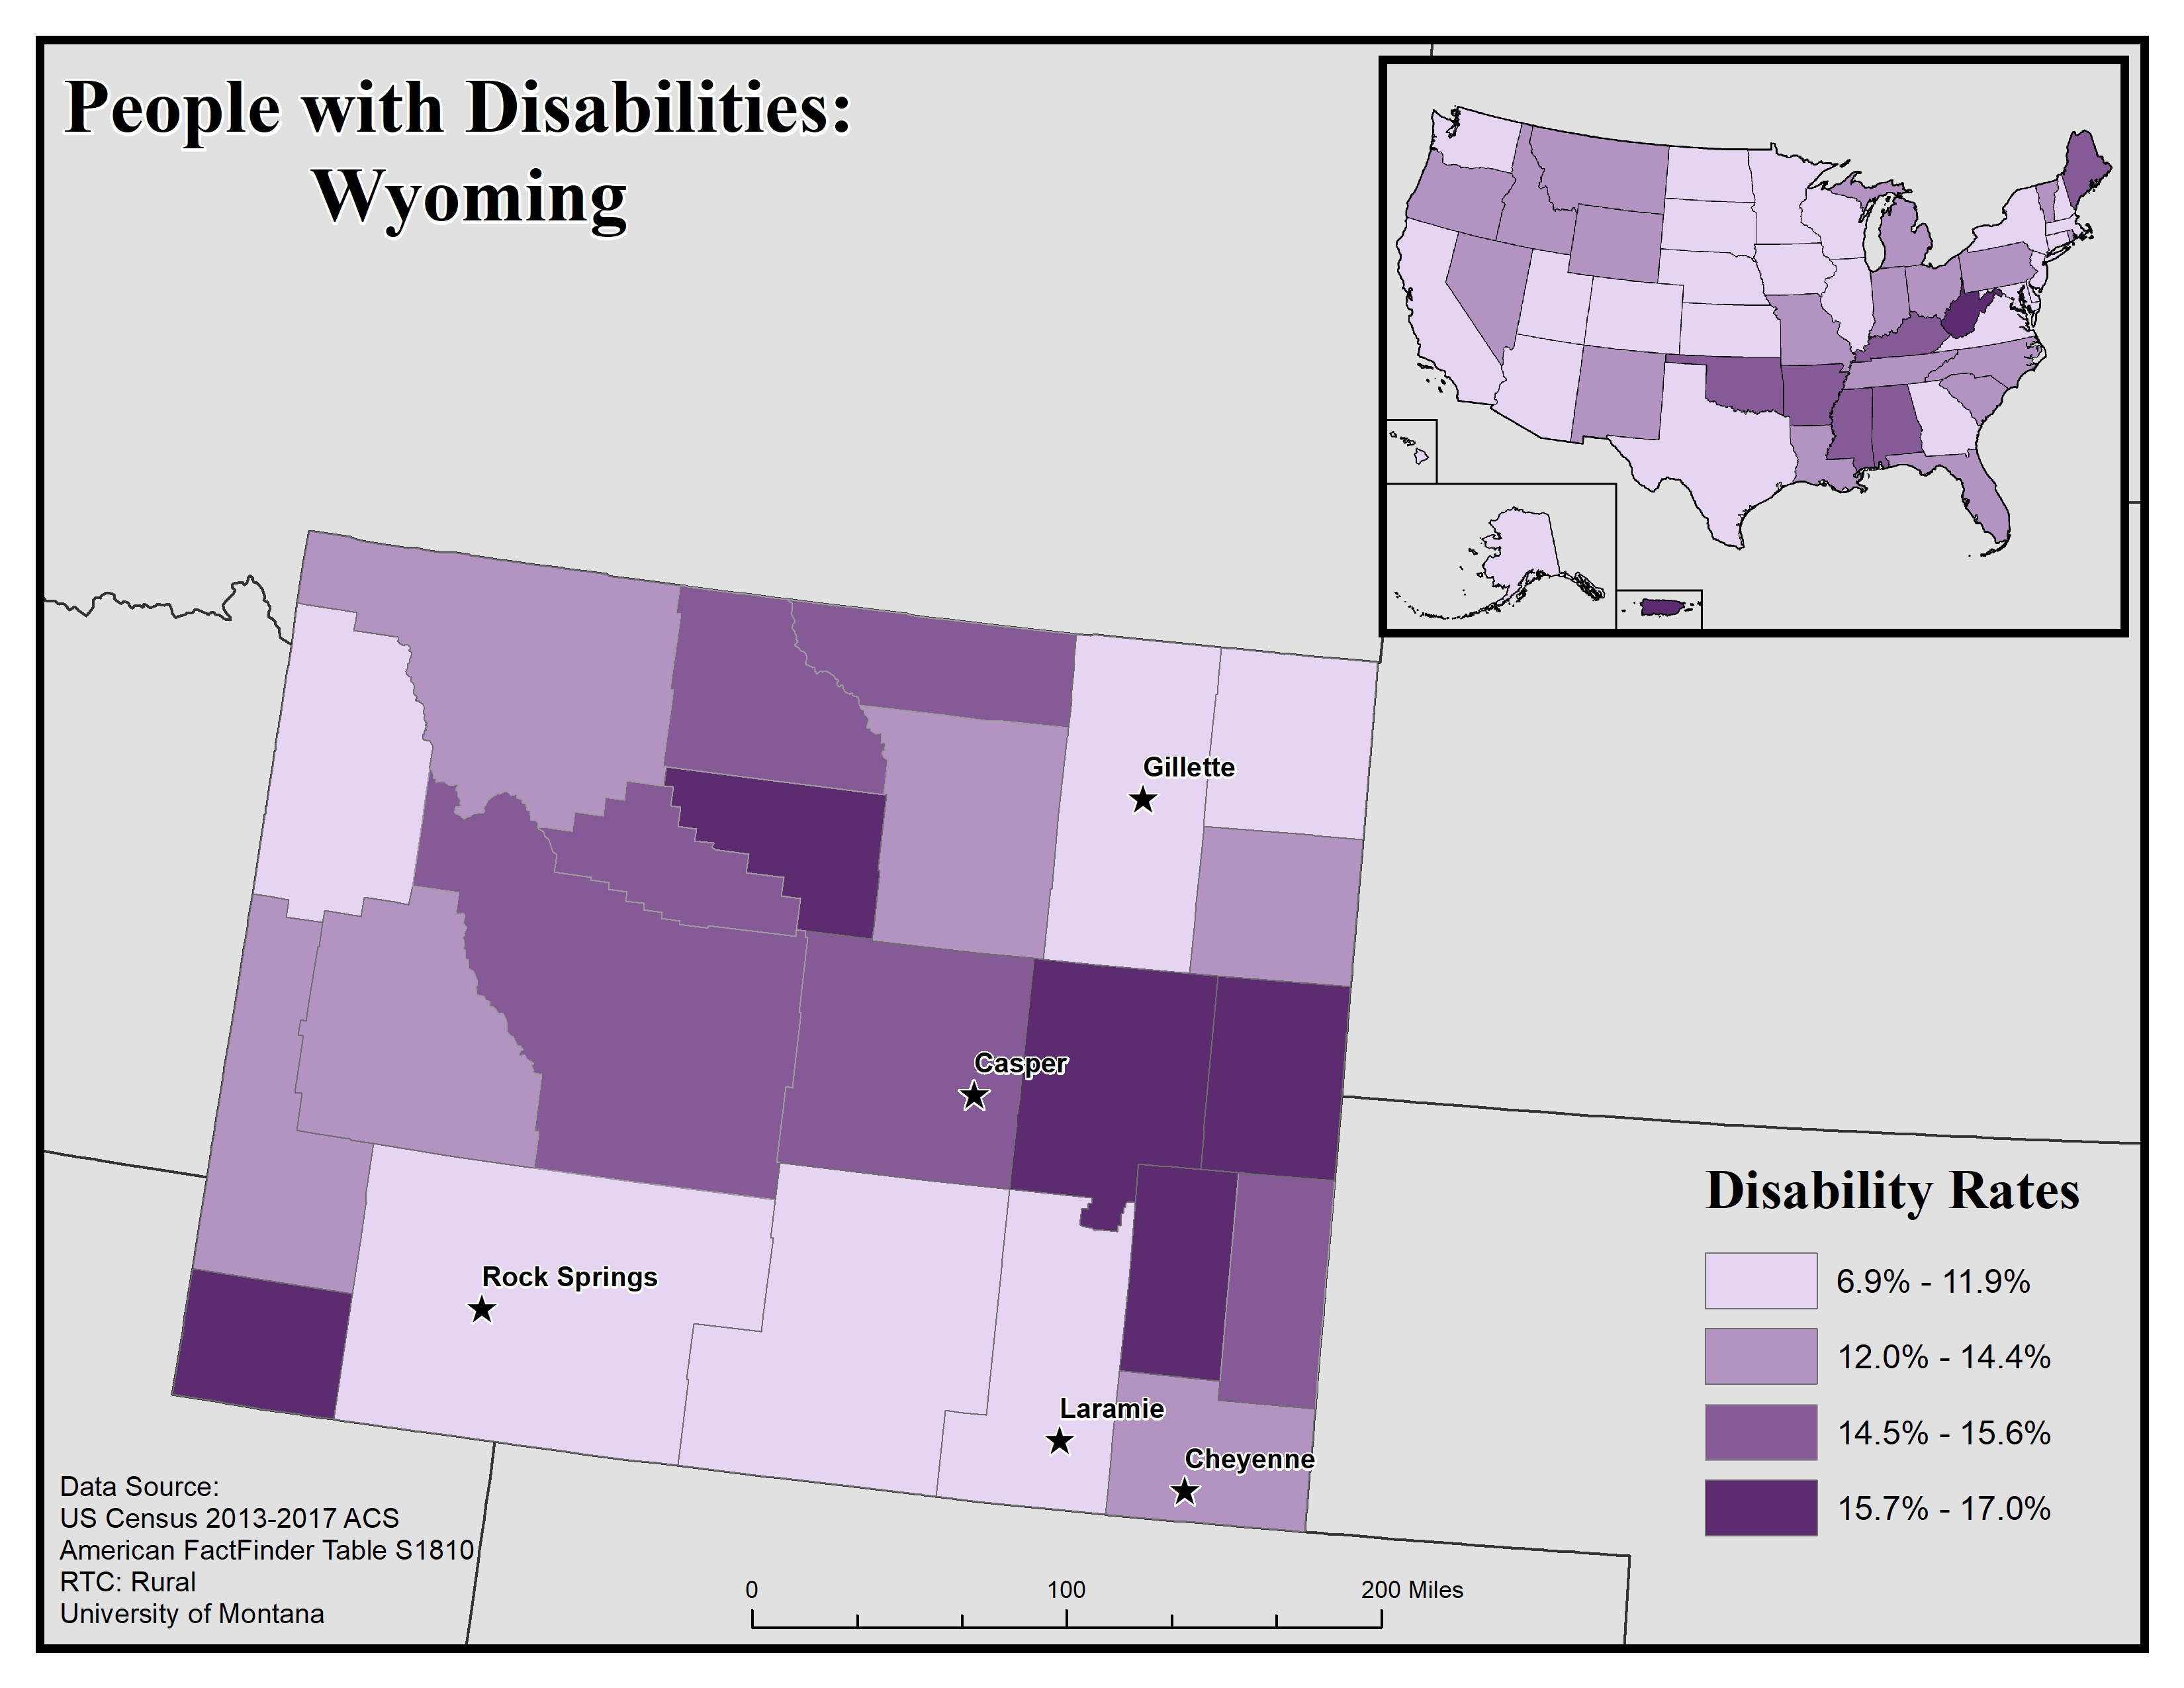
This map of Wyoming shows general rates of disability across the state at the county level. Disability rates are broken into four categories, from 6.9 to 17.0%
The five largest urban areas (Cheyenne, Laramie, Rock Springs, Casper, and Gillette) are labeled to show if there are any differences between disability rates in urban vs rural areas. Disability rates tend to be higher in rural areas than urban ones. The two lowest categories of 6.9 to 11.9% and 12.0 to 14.4% are mainly found in the counties surrounding each of the five largest urban areas and tend to occur in clusters across the state. The highest rates of 15.7 to 17.0% can be observed in several more rural counties in the state.
In the upper corner is an inset map of the United States showing how overall general disability rates in Wyoming compare to the rest of the country. Overall, general disability rates in Wyoming are in the second lowest category (out of four) compared to the rest of the U.S.
Map produced October 2019 based on 2013-2017 American Community Survey data.
- Click on the map for a larger, downloadable version.
- To browse or download the data used to make this map, use our Disability Data Lookup Tool.
-
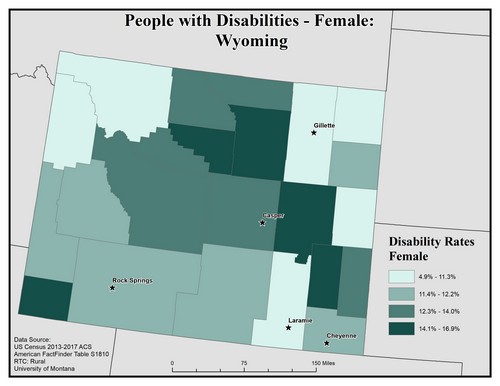
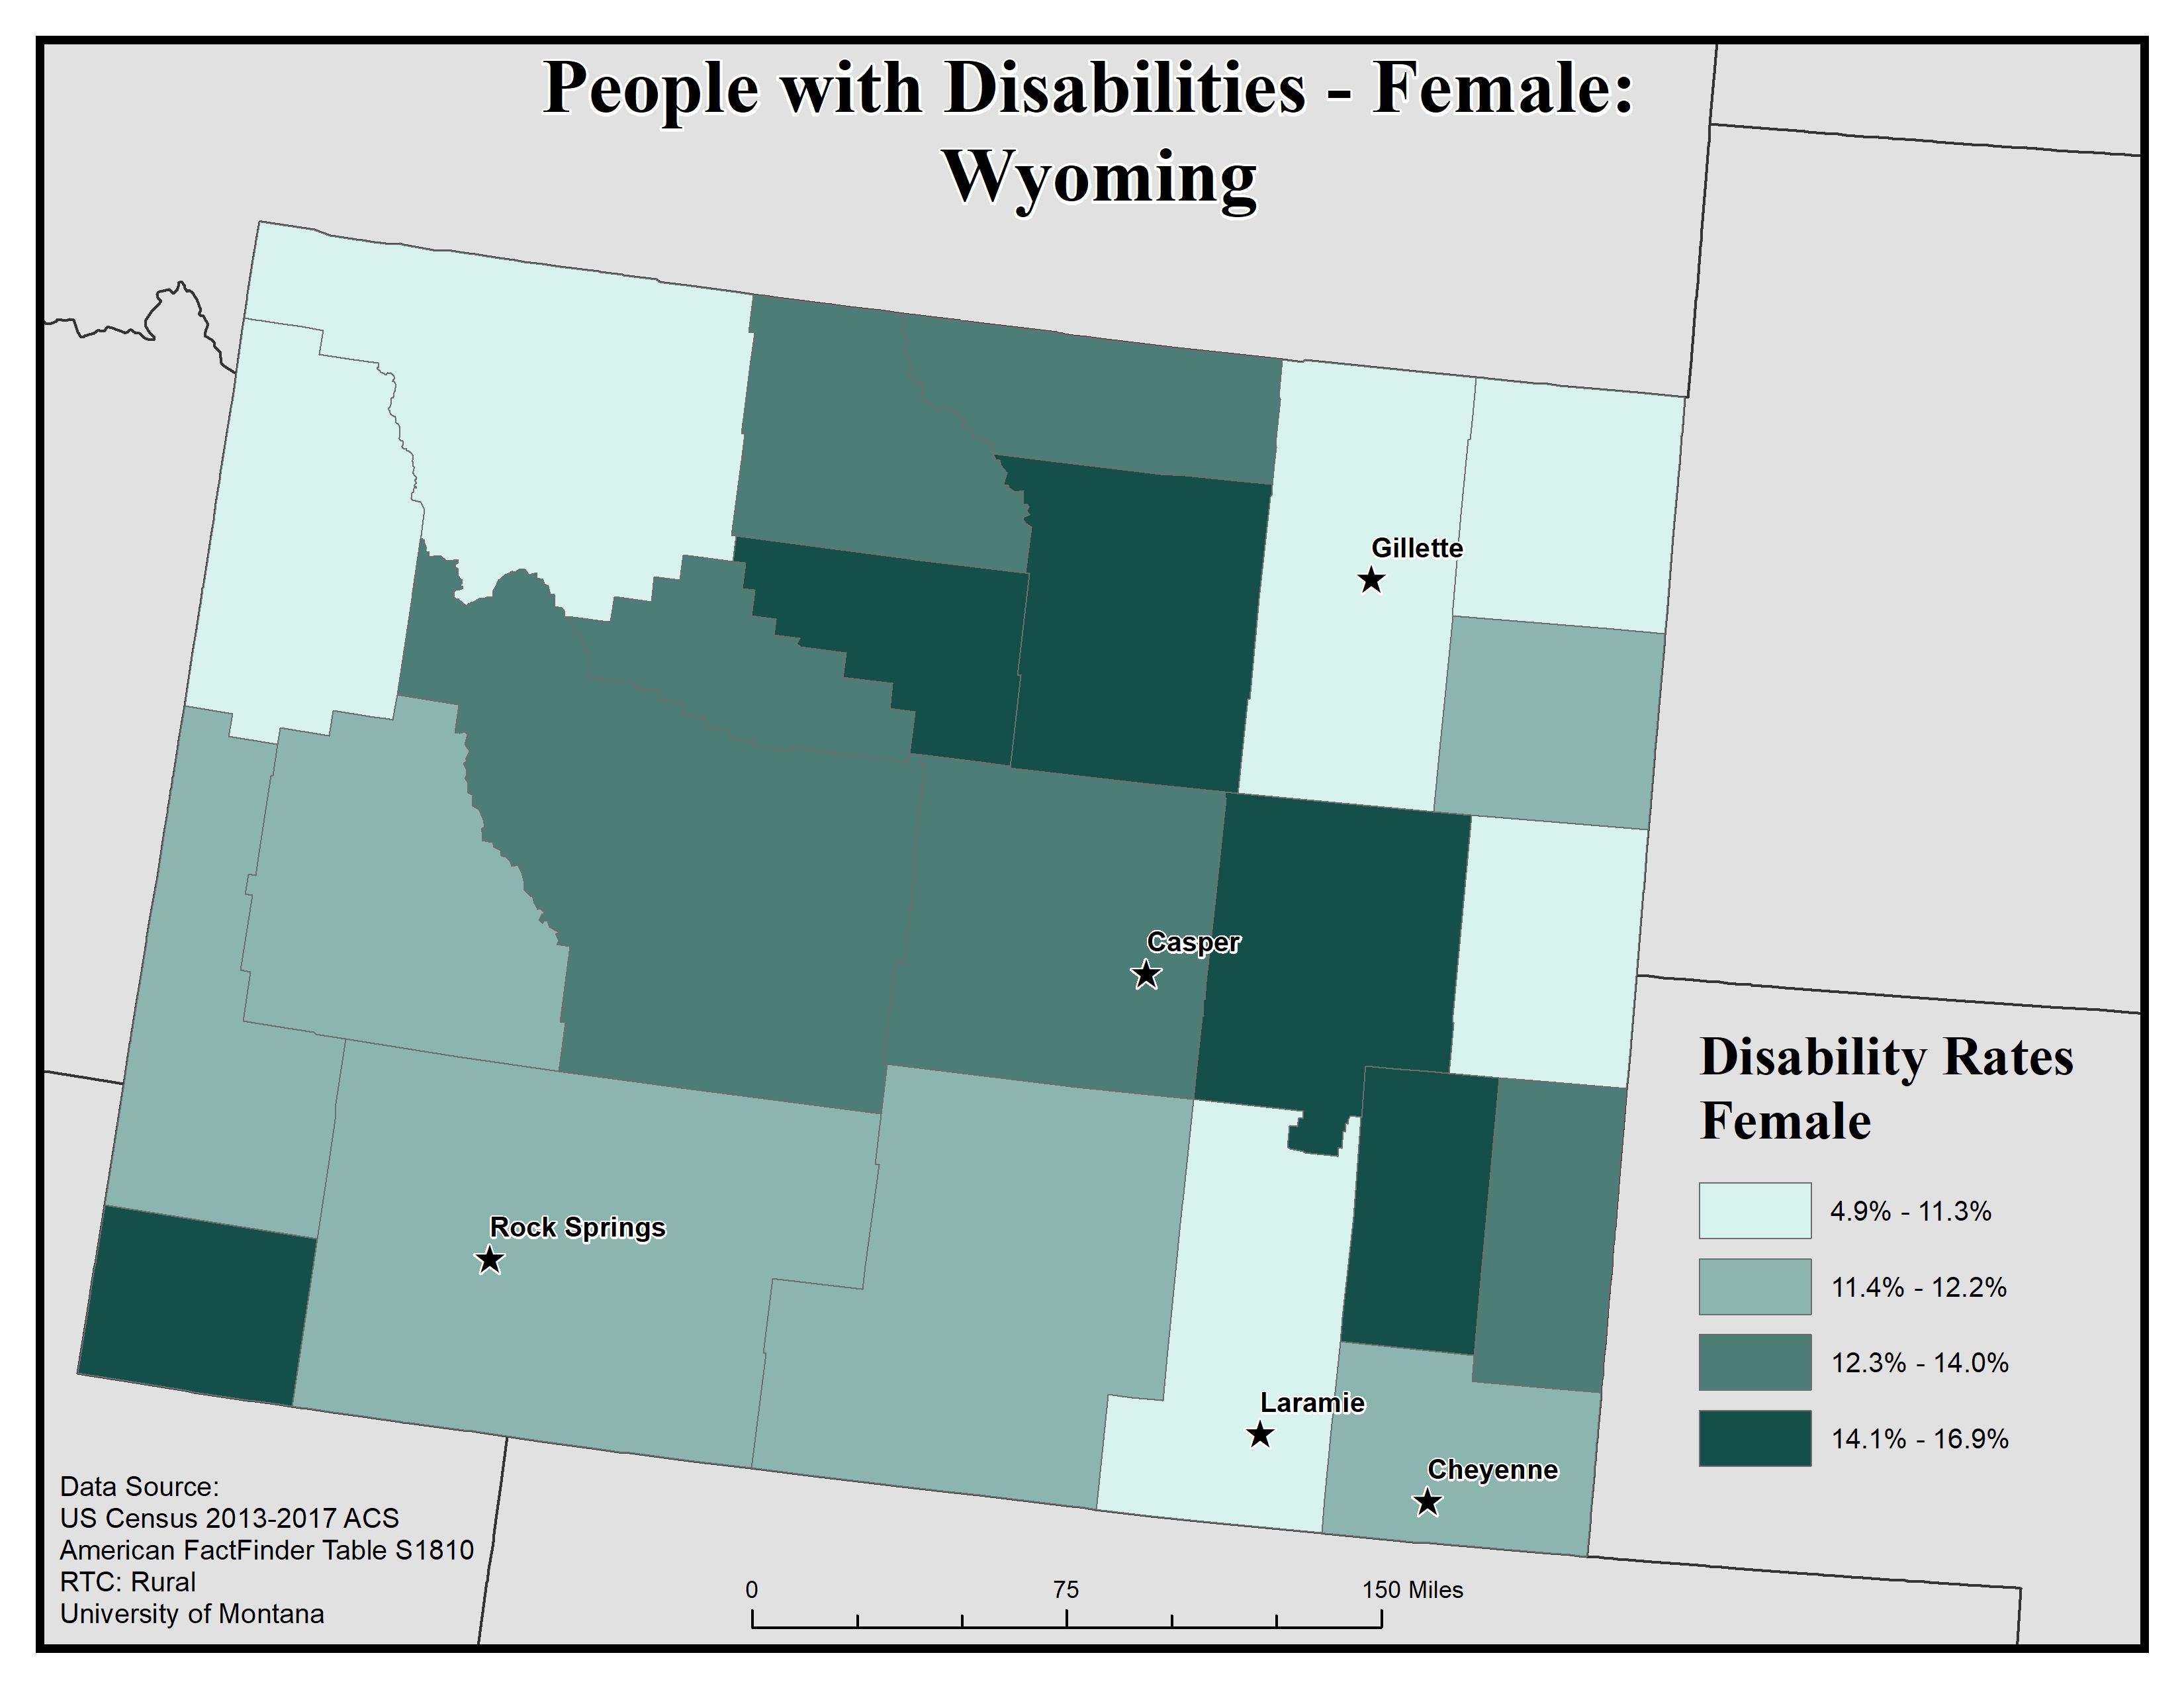
This map of Wyoming shows disability rates among females by county. Rates are broken into four categories, from 4.9 to 16.9%.
The five largest urban areas (Cheyenne, Laramie, Rock Springs, Casper, and Gillette) are labeled to show if there are any differences between disability rates in urban vs rural areas. Overall, rates are somewhat varied across the state, but there are generally higher rates of disability in rural counties compared to urban ones. Casper is located in a county with the second-highest rates, of 12.3 to 14.0%. Rock Springs and Cheyenne are in counties with the second-lowest rates, of 11.4 to 12.2%, and Gillette is in a county with the lowest rate, of 4.9 to 11.3%.
Only five counties have the highest rate, of 14.1 to 16.9%, and they are in the southwestern corner of the state and near the middle of the state, in a diagonal line running northwest to southeast between Gillette and Casper.
Map produced February 2020 based on 2013-2017 American Community Survey data.
- Click on the map for a larger, downloadable version.
- To browse or download the data used to make this map, use our Disability Data Lookup Tool.
- For information on how biological sex is used and defined in the ACS, see “American Community Survey and Puerto Rico Community Survey 2017 Subject Definitions” page 125.
-
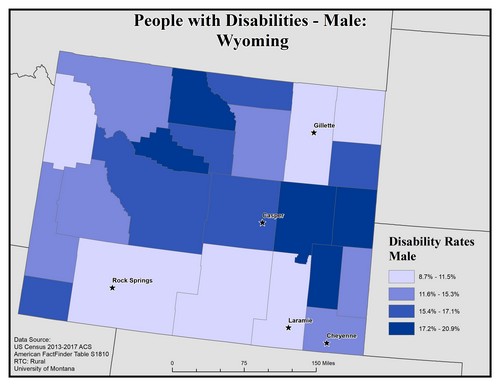
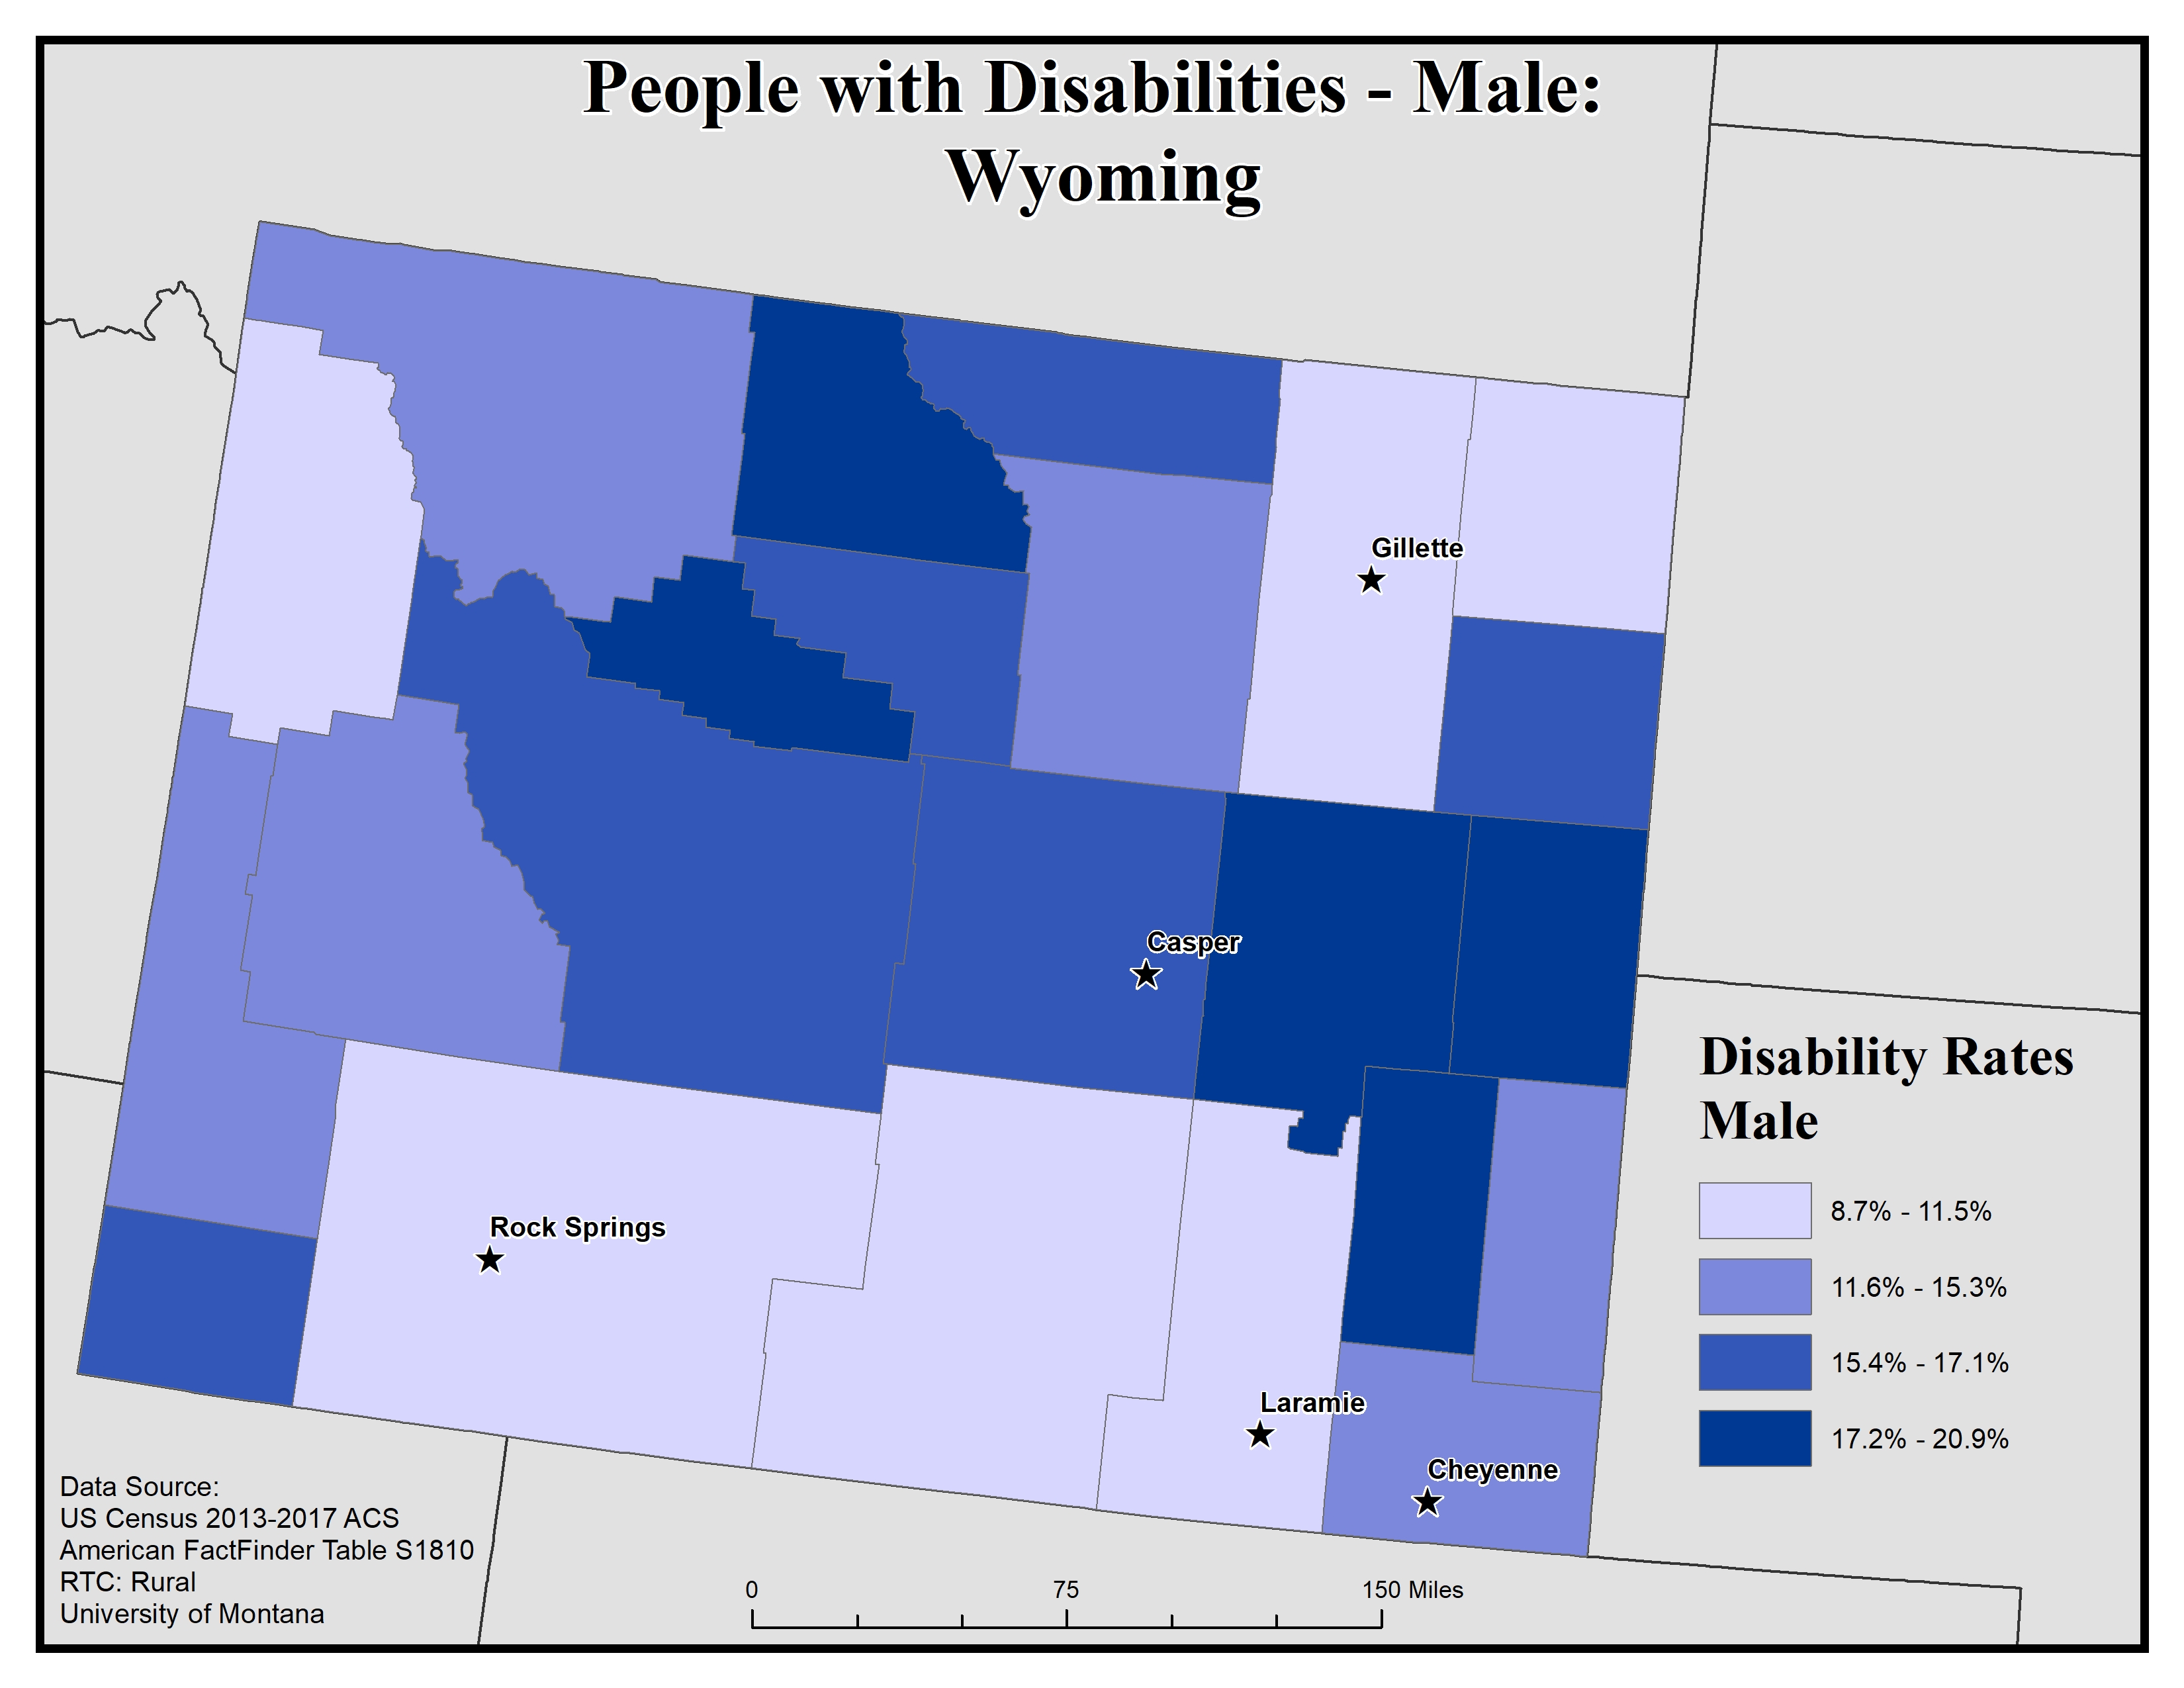
This map of Wyoming shows disability rates among males by county. Rates are broken into four categories, from 8.7 to 20.9%.
The five largest urban areas (Cheyenne, Laramie, Rock Springs, Casper, and Gillette) are labeled to show if there are any differences between disability rates in urban vs rural areas.
Overall, rates are somewhat varied across the state, but there are generally higher rates of disability in rural counties compared to urban ones. Casper is located in a county with the second-highest rates, of 15.4 to 17.1%. Cheyenne is in a county with the second-lowest rate, of 11.6 to 15.3%. Rock Springs, Laramie, and Gillette are in counties with the lowest rates, of 8.7 to 11.5%.
Only five counties have the highest rate, of 14.1 to 16.9%, and they are in the southwestern corner of the state and near the middle of the state, in a diagonal line running northwest to southeast between Gillette and Casper. There seem to be higher rates along the middle of the state, and lower ones along most (but not all) of the southern border.
Map produced February 2020 based on 2013-2017 American Community Survey data.
- Click on the map for a larger, downloadable version.
- To browse or download the data used to make this map, use our Disability Data Lookup Tool.
- For information on how biological sex is used and defined in the ACS, see “American Community Survey and Puerto Rico Community Survey 2017 Subject Definitions” page 125.
-
This map explores the American Community Survey (ACS) 5-year data (Table S1810) on disability estimates.
The ACS asks a set of disability indicator questions to determine disability. If a respondent can answer “yes” to any disability question they are classified as having a disability. The data below are for ages 18 and over.
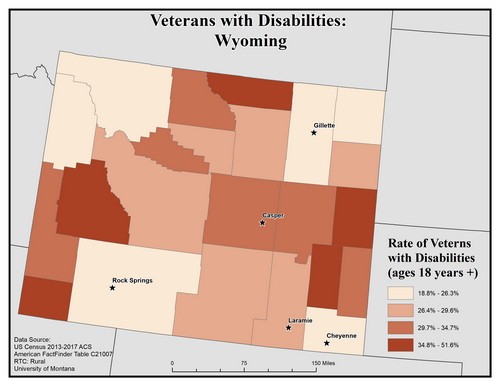
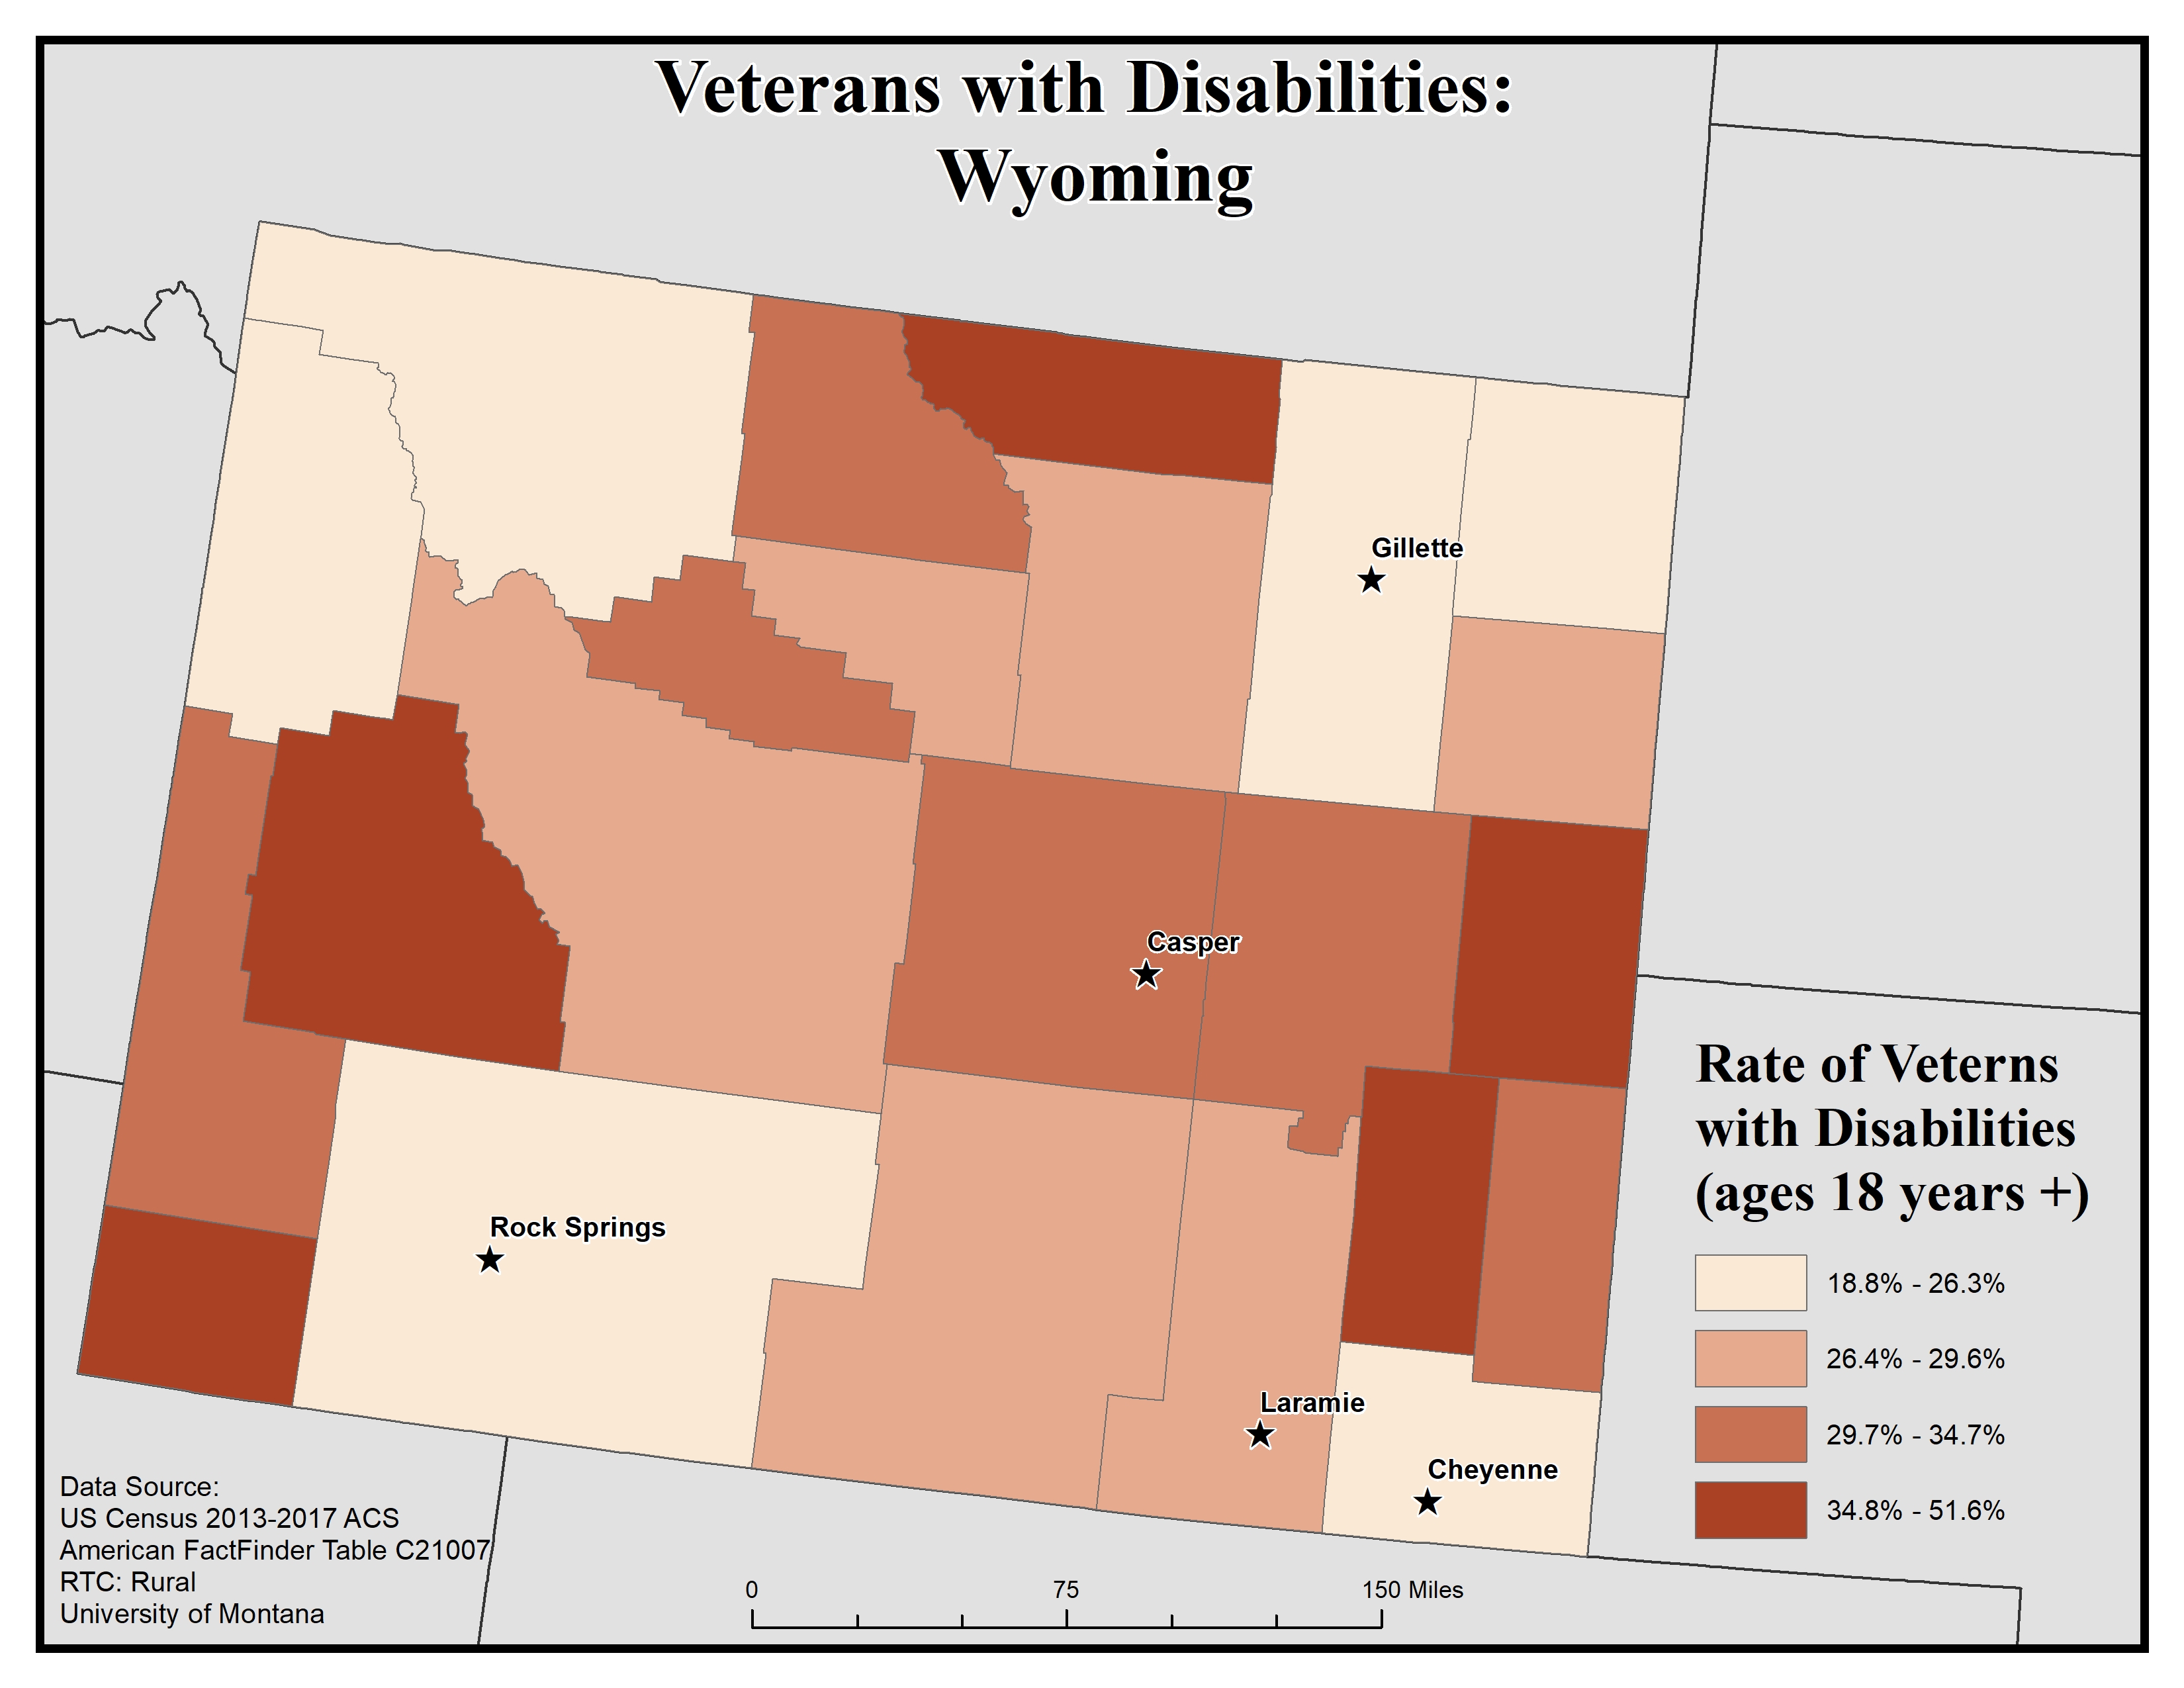
This map of the state of Wyoming shows rates of veterans with disabilities ages 18 years and older by county. Rates are broken into four categories, from 18.8 to 51.6%
The five largest urban areas (Cheyenne, Laramie, Rock Springs, Casper, and Gillette) are labeled to show if there are any differences between disability rates in urban vs rural areas.
Casper is in a county with the second-highest rate, of 29.7 to 34.7%. Laramie is in a county with the second-lowest rate, of 26.4 to 29.6%. Rock Springs, Cheyenne, and Gillette are in counties with the lowest rate, of 18.8 to 26.3%.
Overall, rates are varied across the state, but there tend to be higher rates of disability in rural counties compared to urban ones.
Map produced February 2020 based on 2013-2017 American Community Survey data.
- Click on the map for a larger, downloadable version.
- To browse or download the data used to make this map, use our Disability Data Lookup Tool.
-
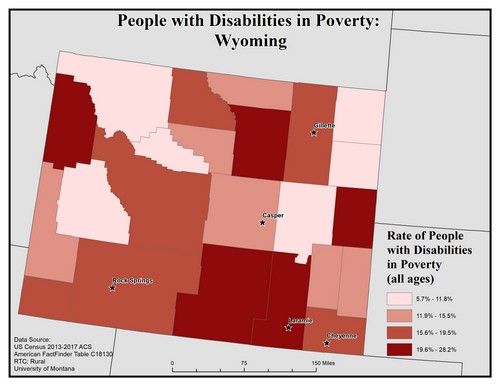
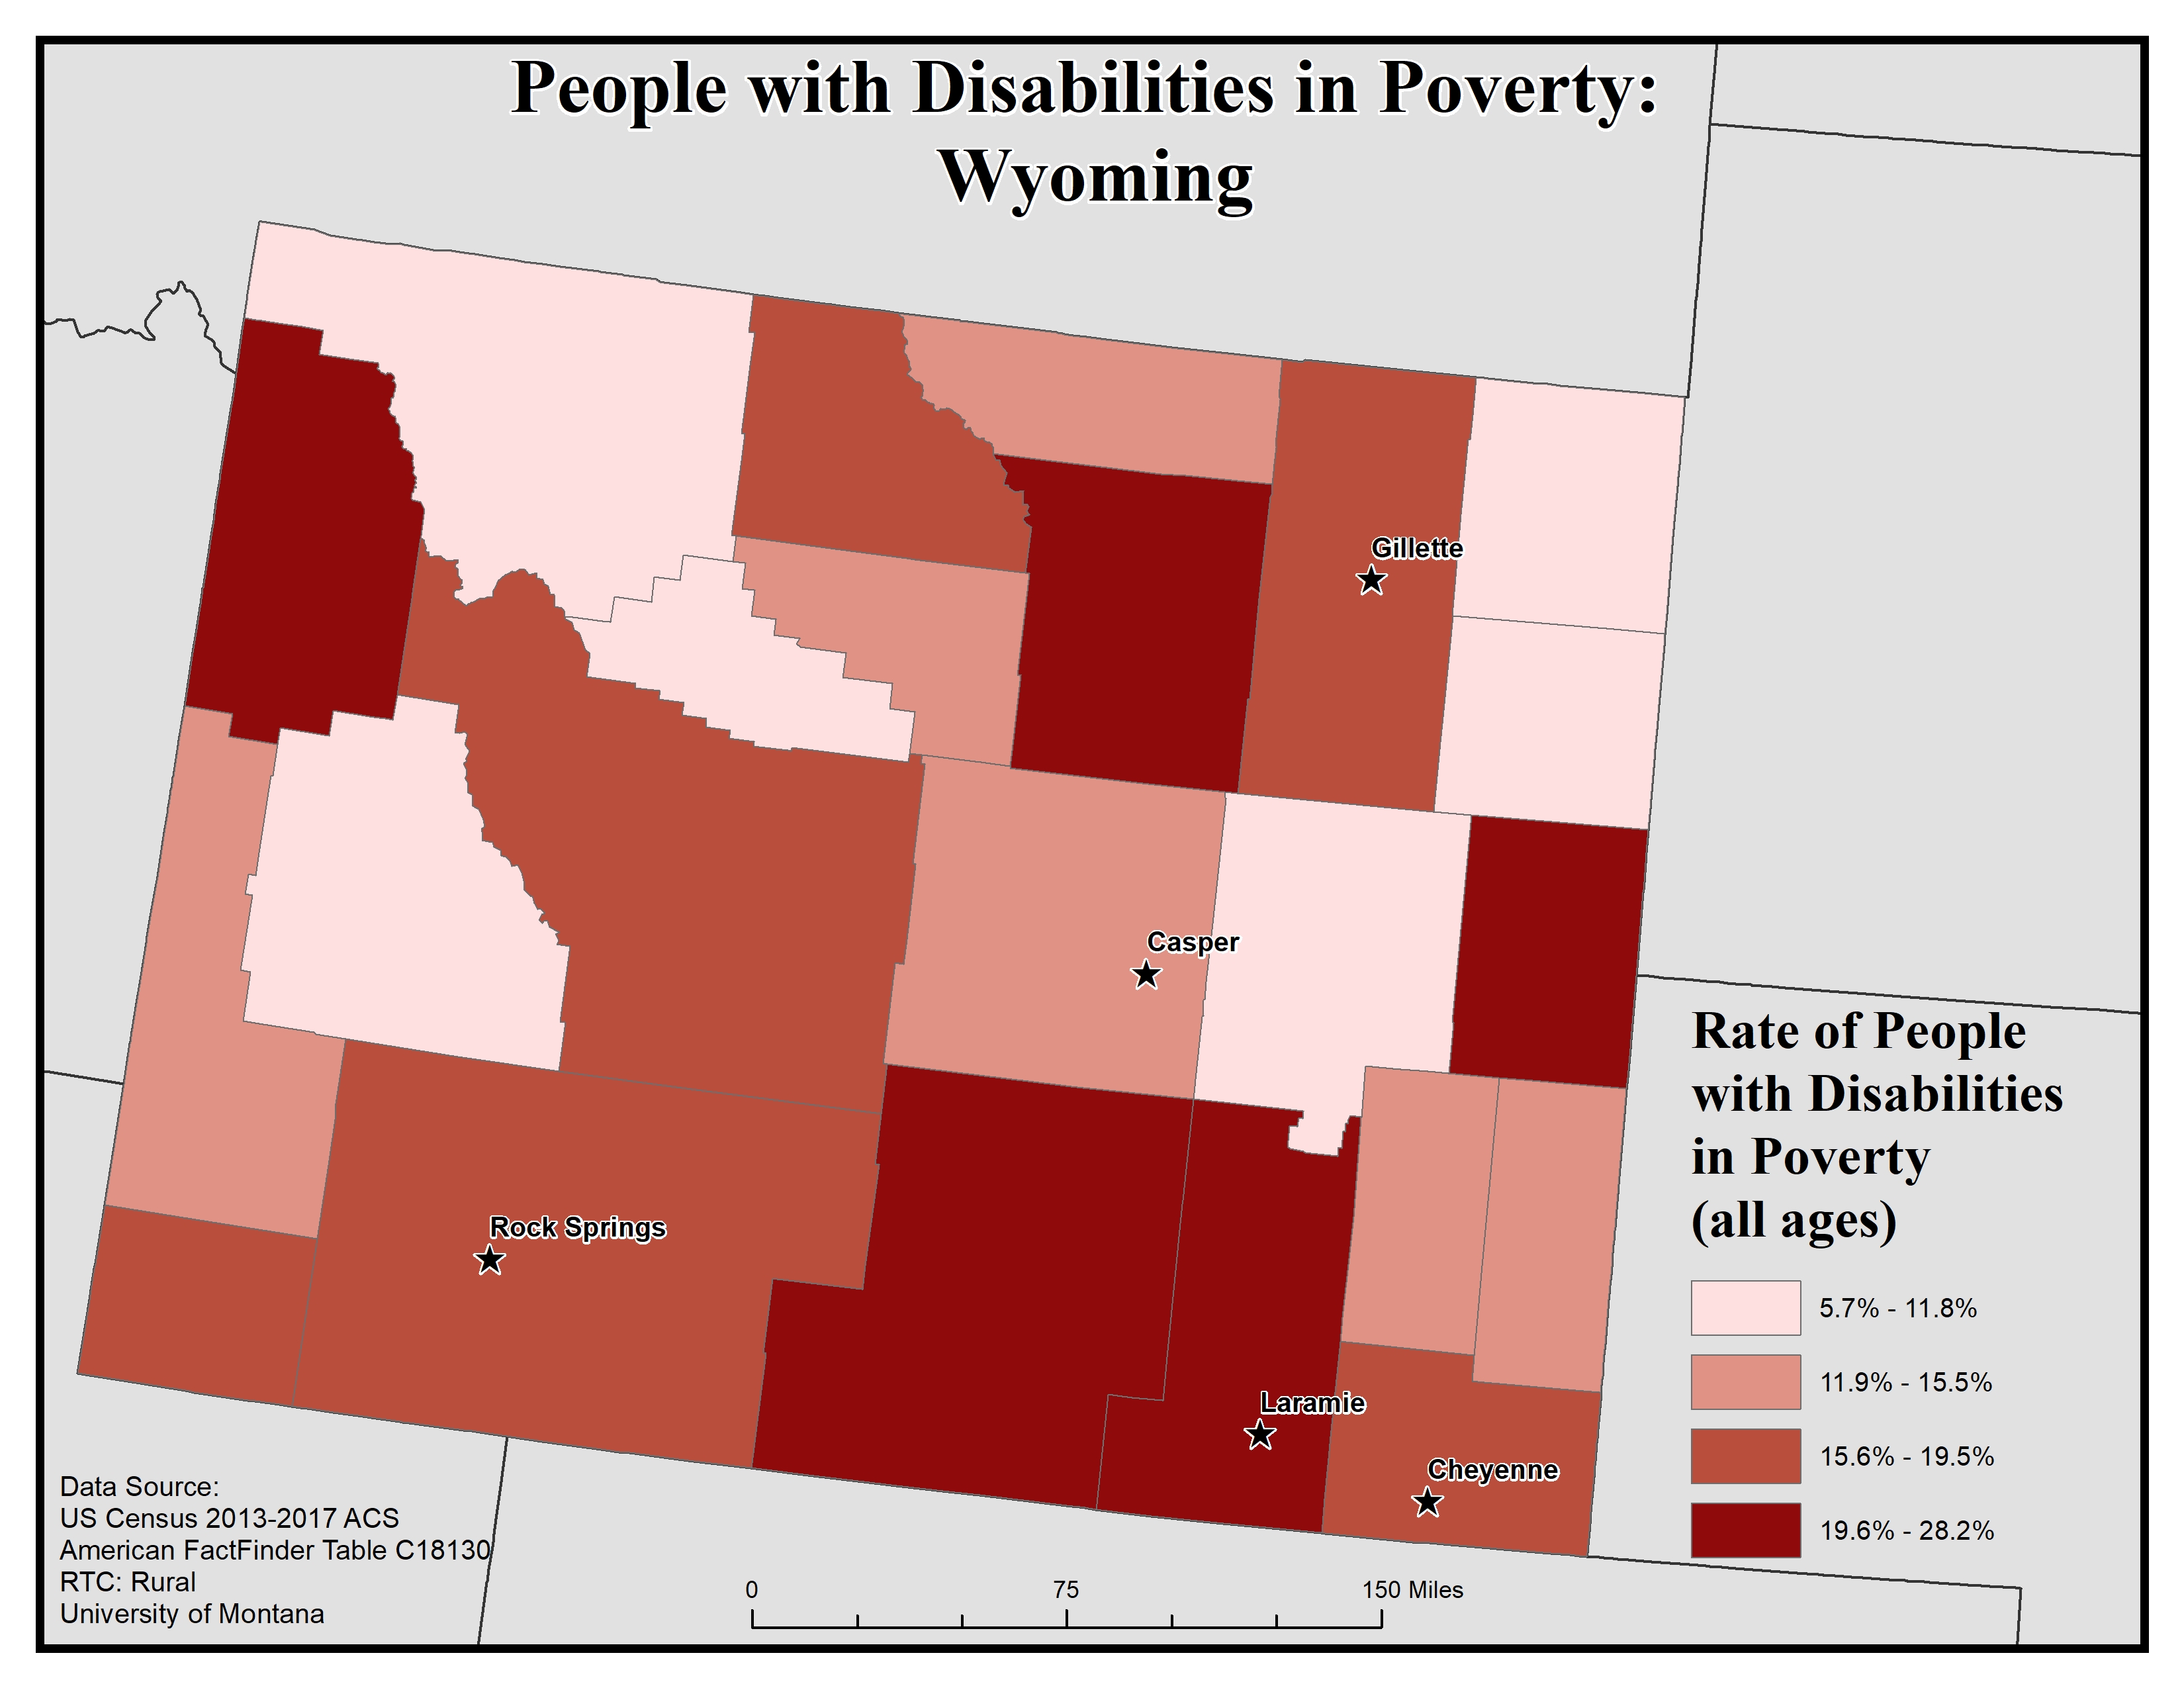
This map of the state of Wyoming shows rates of people with disabilities in poverty (all ages) by county. Rates are broken into four categories, from 5.7 to 28.2%.
The five largest urban areas (Cheyenne, Laramie, Rock Springs, Casper, and Gillette) are labeled to show if there are any differences between disability rates in urban vs rural areas.
Laramie is in a county with the highest rate, of 19.6 to 28.2%. Rock Springs, Cheyenne, and Gillette are in counties with the second-highest rate, of 15.6 to 19.5%. Casper is in a county with the second-lowest rate, of 11.9 to 15.5%.
Overall, rates are varied across the state. Only six counties (all rural), scattered across the state, have the lowest rate, of 5.7 to 11.8%. While not the rule, all of the more urban counties seem to have higher rates.
Map produced February 2020 based on 2013-2017 American Community Survey data.
- Click on the map for a larger, downloadable version.
- To browse or download the data used to make this map, use our Disability Data Lookup Tool.
Employment: Wyoming
-
This map explores American Community Survey (ACS) 5-year data (Table C18120) employment estimates by disability type.
The ACS asks a set of disability indicator questions to determine disability. If a respondent can answer “yes” to any disability question they are classified as having a disability. The data below are for ages 18-64.
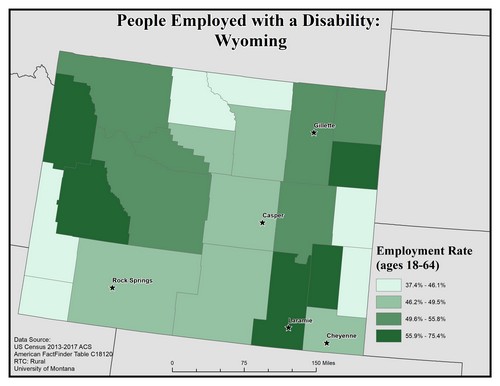
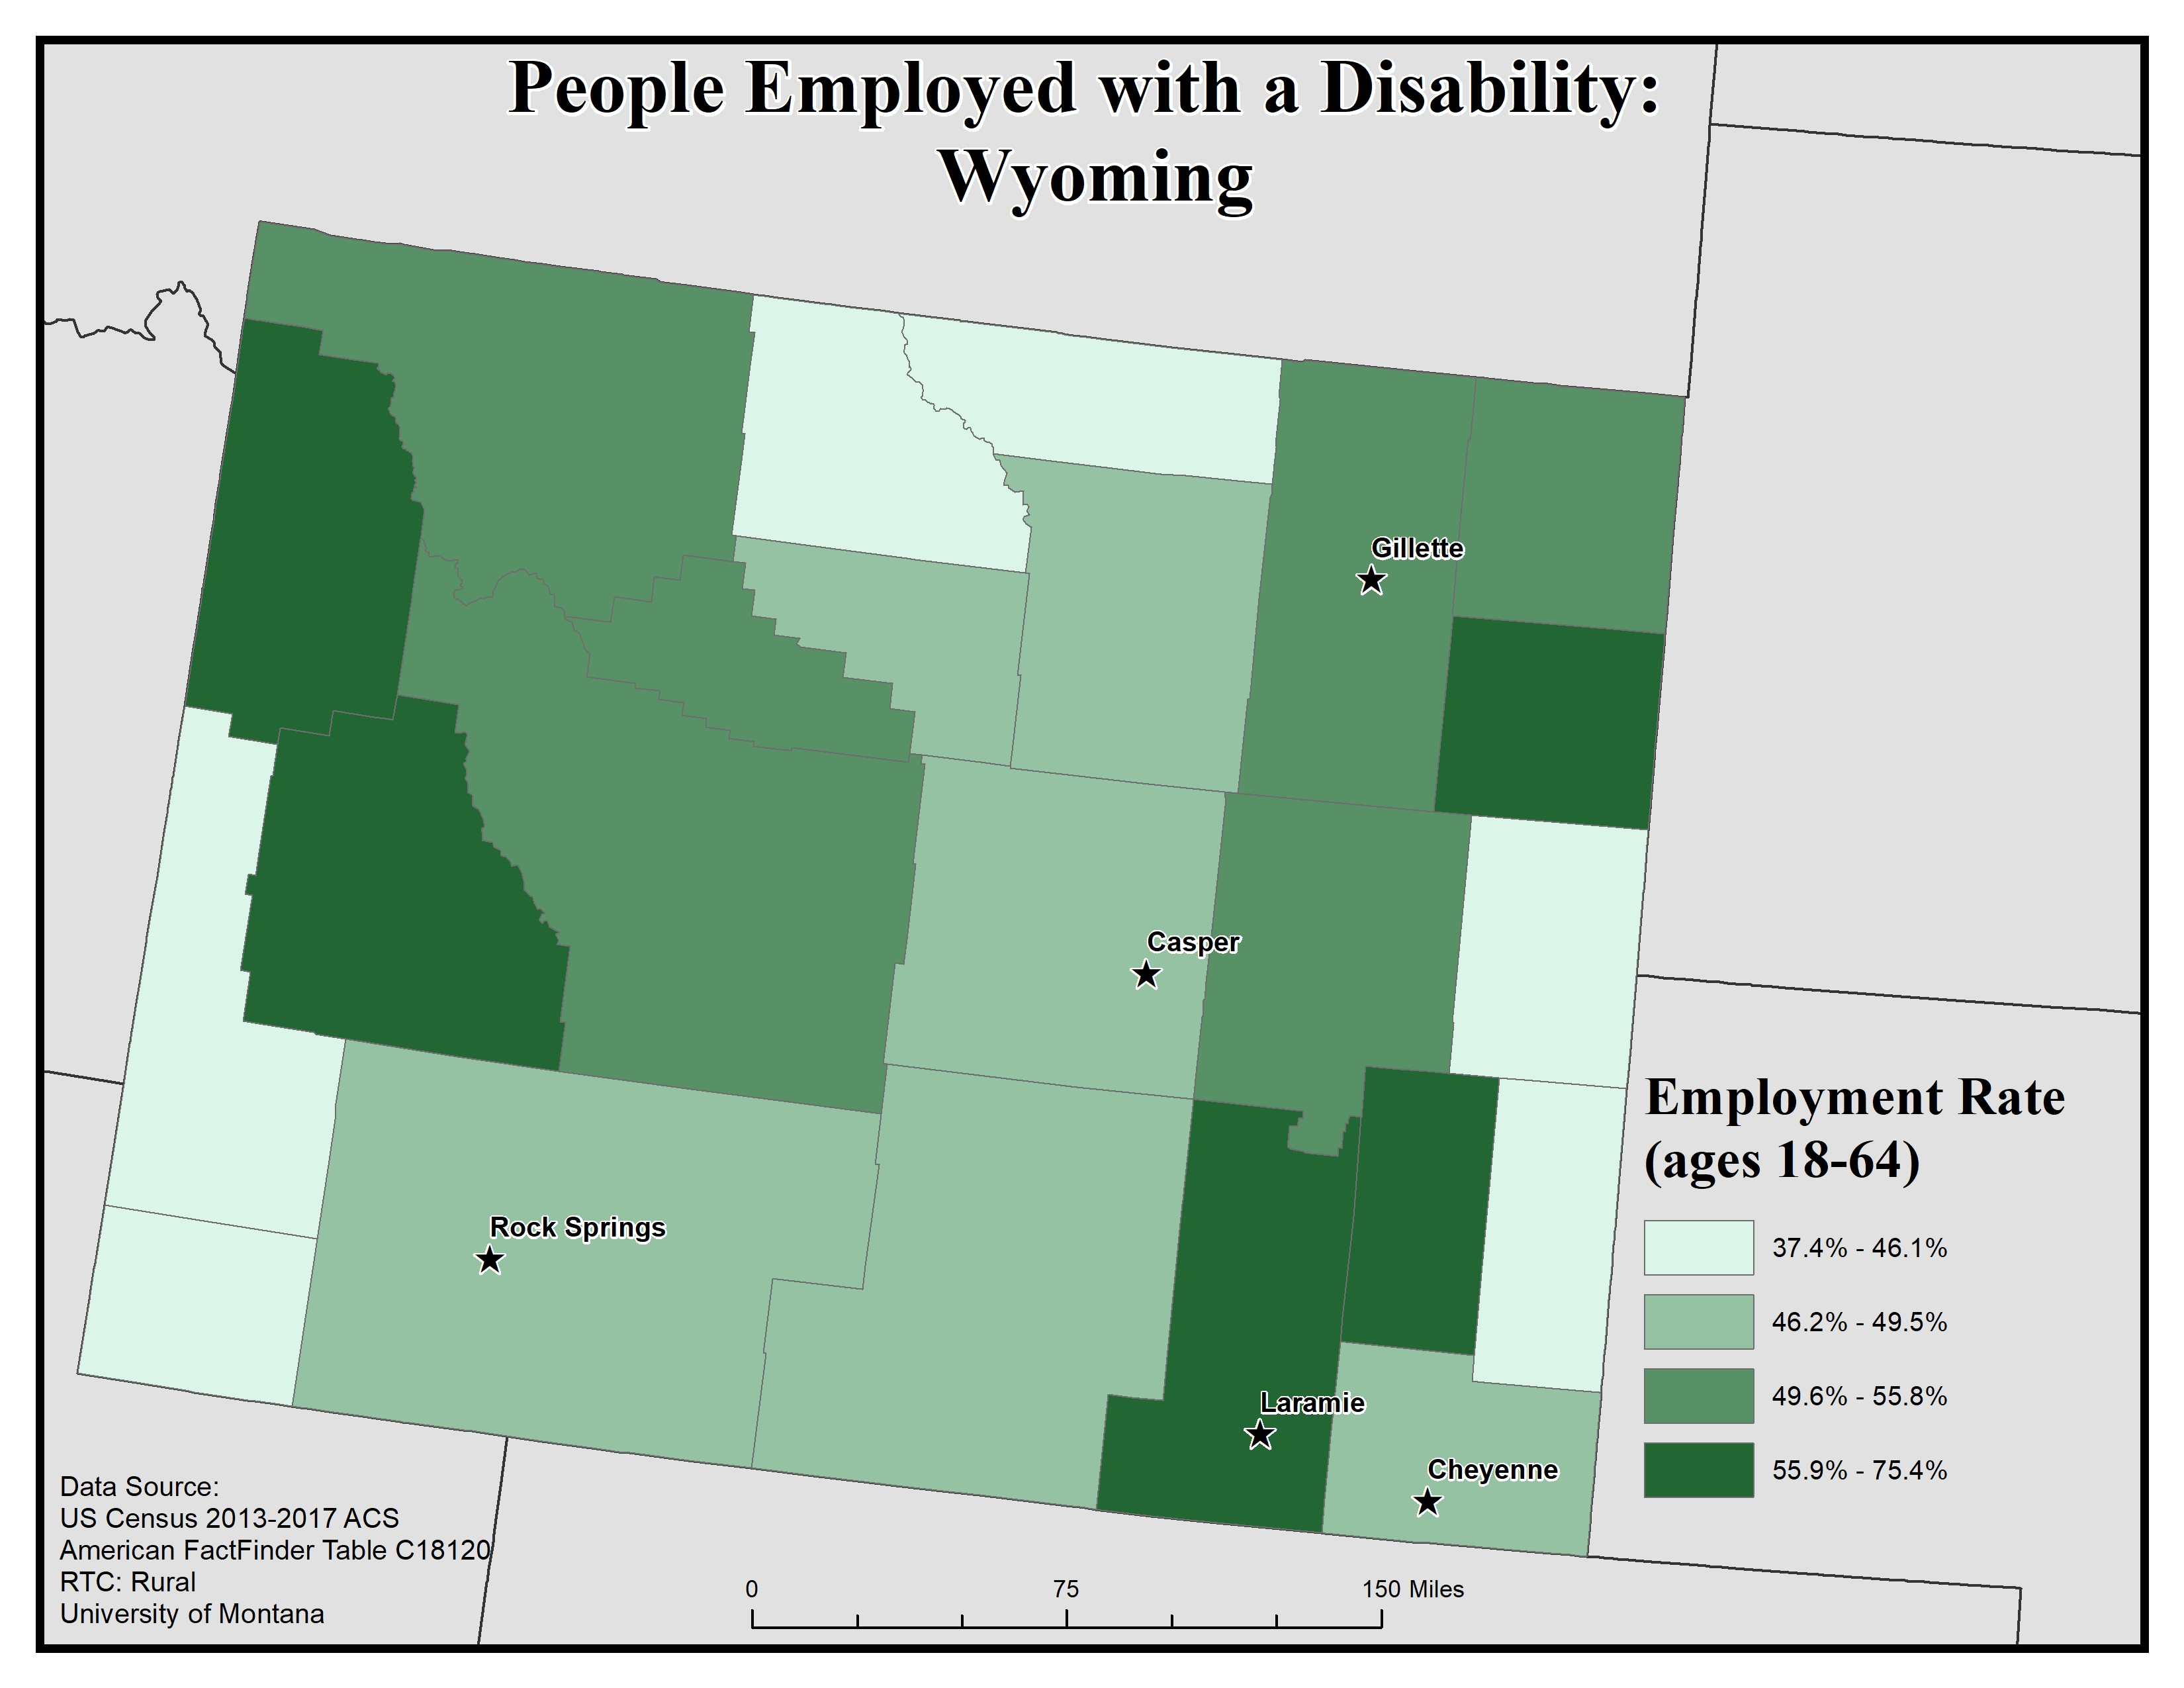
This map of Wyoming shows rates of people with disabilities who are employed by county. Rates are broken into four categories, from 37.4 to 75.4%.
The five largest urban areas (Cheyenne, Laramie, Rock Springs, Casper, and Gillette) are labeled to show if there are any differences between disability rates in urban vs rural areas.
Laramie is in a county with the highest rate, of 55.9 to 75.4%. Gillette is in a county with the second-highest rate, of 49.6 to 55.8%. Rock Springs, Cheyenne, and Casper are in counties with the second-lowest rate, of 46.2 to 49.5%.
Map produced February 2020 based on 2013-2017 American Community Survey data.
- Click on the map for a larger, downloadable version.
- To browse or download the data used to make this map, use our Disability Data Lookup Tool.
-
This map explores American Community Survey (ACS) 5-year data (Table C18120) employment estimates by disability type.
The ACS asks a set of disability indicator questions to determine disability. If a respondent can answer “yes” to any disability question they are classified as having a disability. The data below are for ages 18-64.
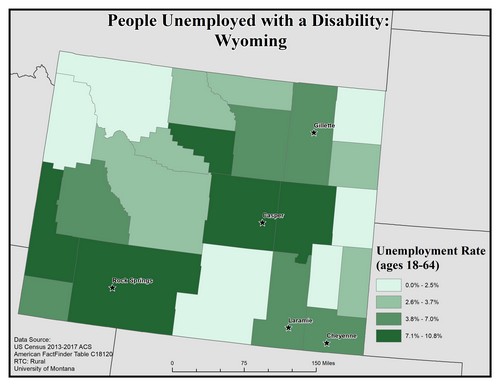
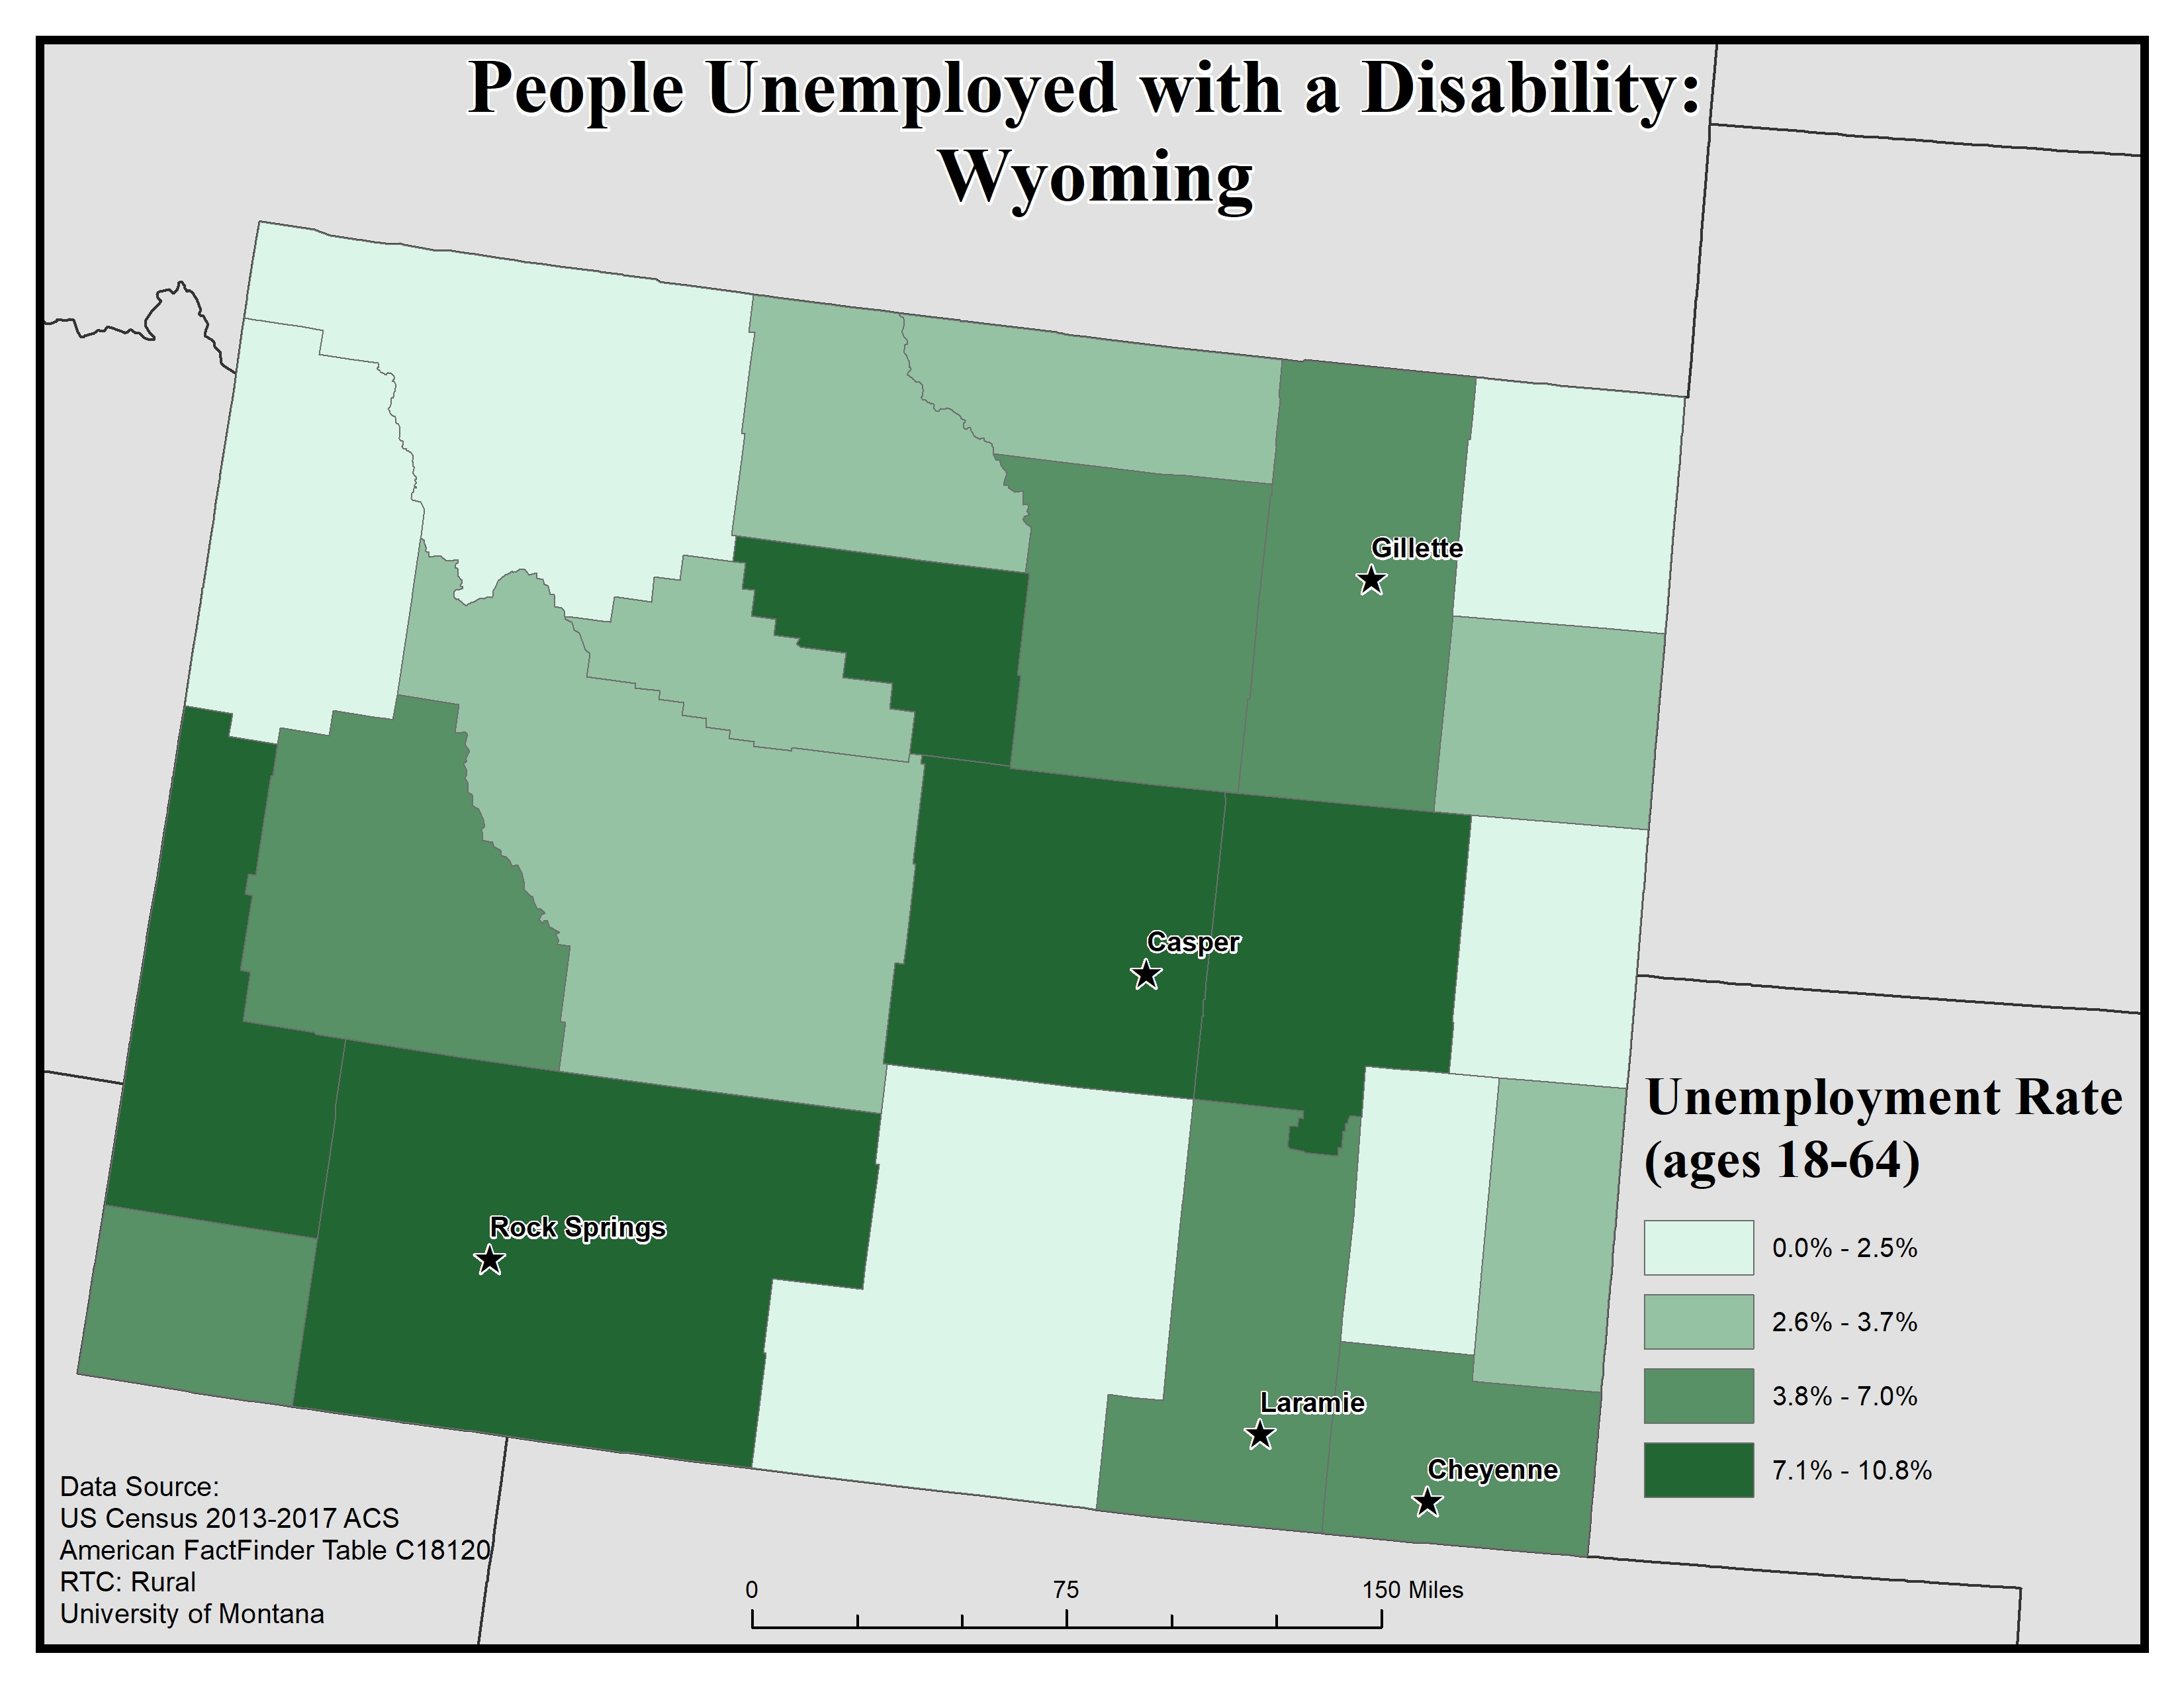
This map of the state of Wyoming shows rates of people with disabilities who are unemployed by county. Rates are broken into four categories, from 0.0 to 10.8%
The five largest urban areas (Cheyenne, Laramie, Rock Springs, Casper, and Gillette) are labeled to show if there are any differences between disability rates in urban vs rural areas.
Rock Springs and Casper are in counties with the highest rate, of 7.1 to 10.8%. Laramie, Cheyenne, and Gillette are in counties with the second-highest rate, of 3.8 to 7.0%. While rates are somewhat scattered across the state, they appear to be higher in more urban counties than rural ones.
Map produced February 2020 based on 2013-2017 American Community Survey data.
- Click on the map for a larger, downloadable version.
- To browse or download the data used to make this map, use our Disability Data Lookup Tool.
-
This map explores American Community Survey (ACS) 5-year data (Table C18120) employment estimates by disability type.
The ACS asks a set of disability indicator questions to determine disability. If a respondent can answer “yes” to any disability question they are classified as having a disability. The data below are for ages 18-64.
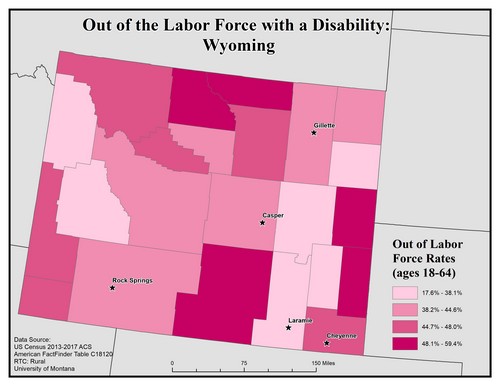
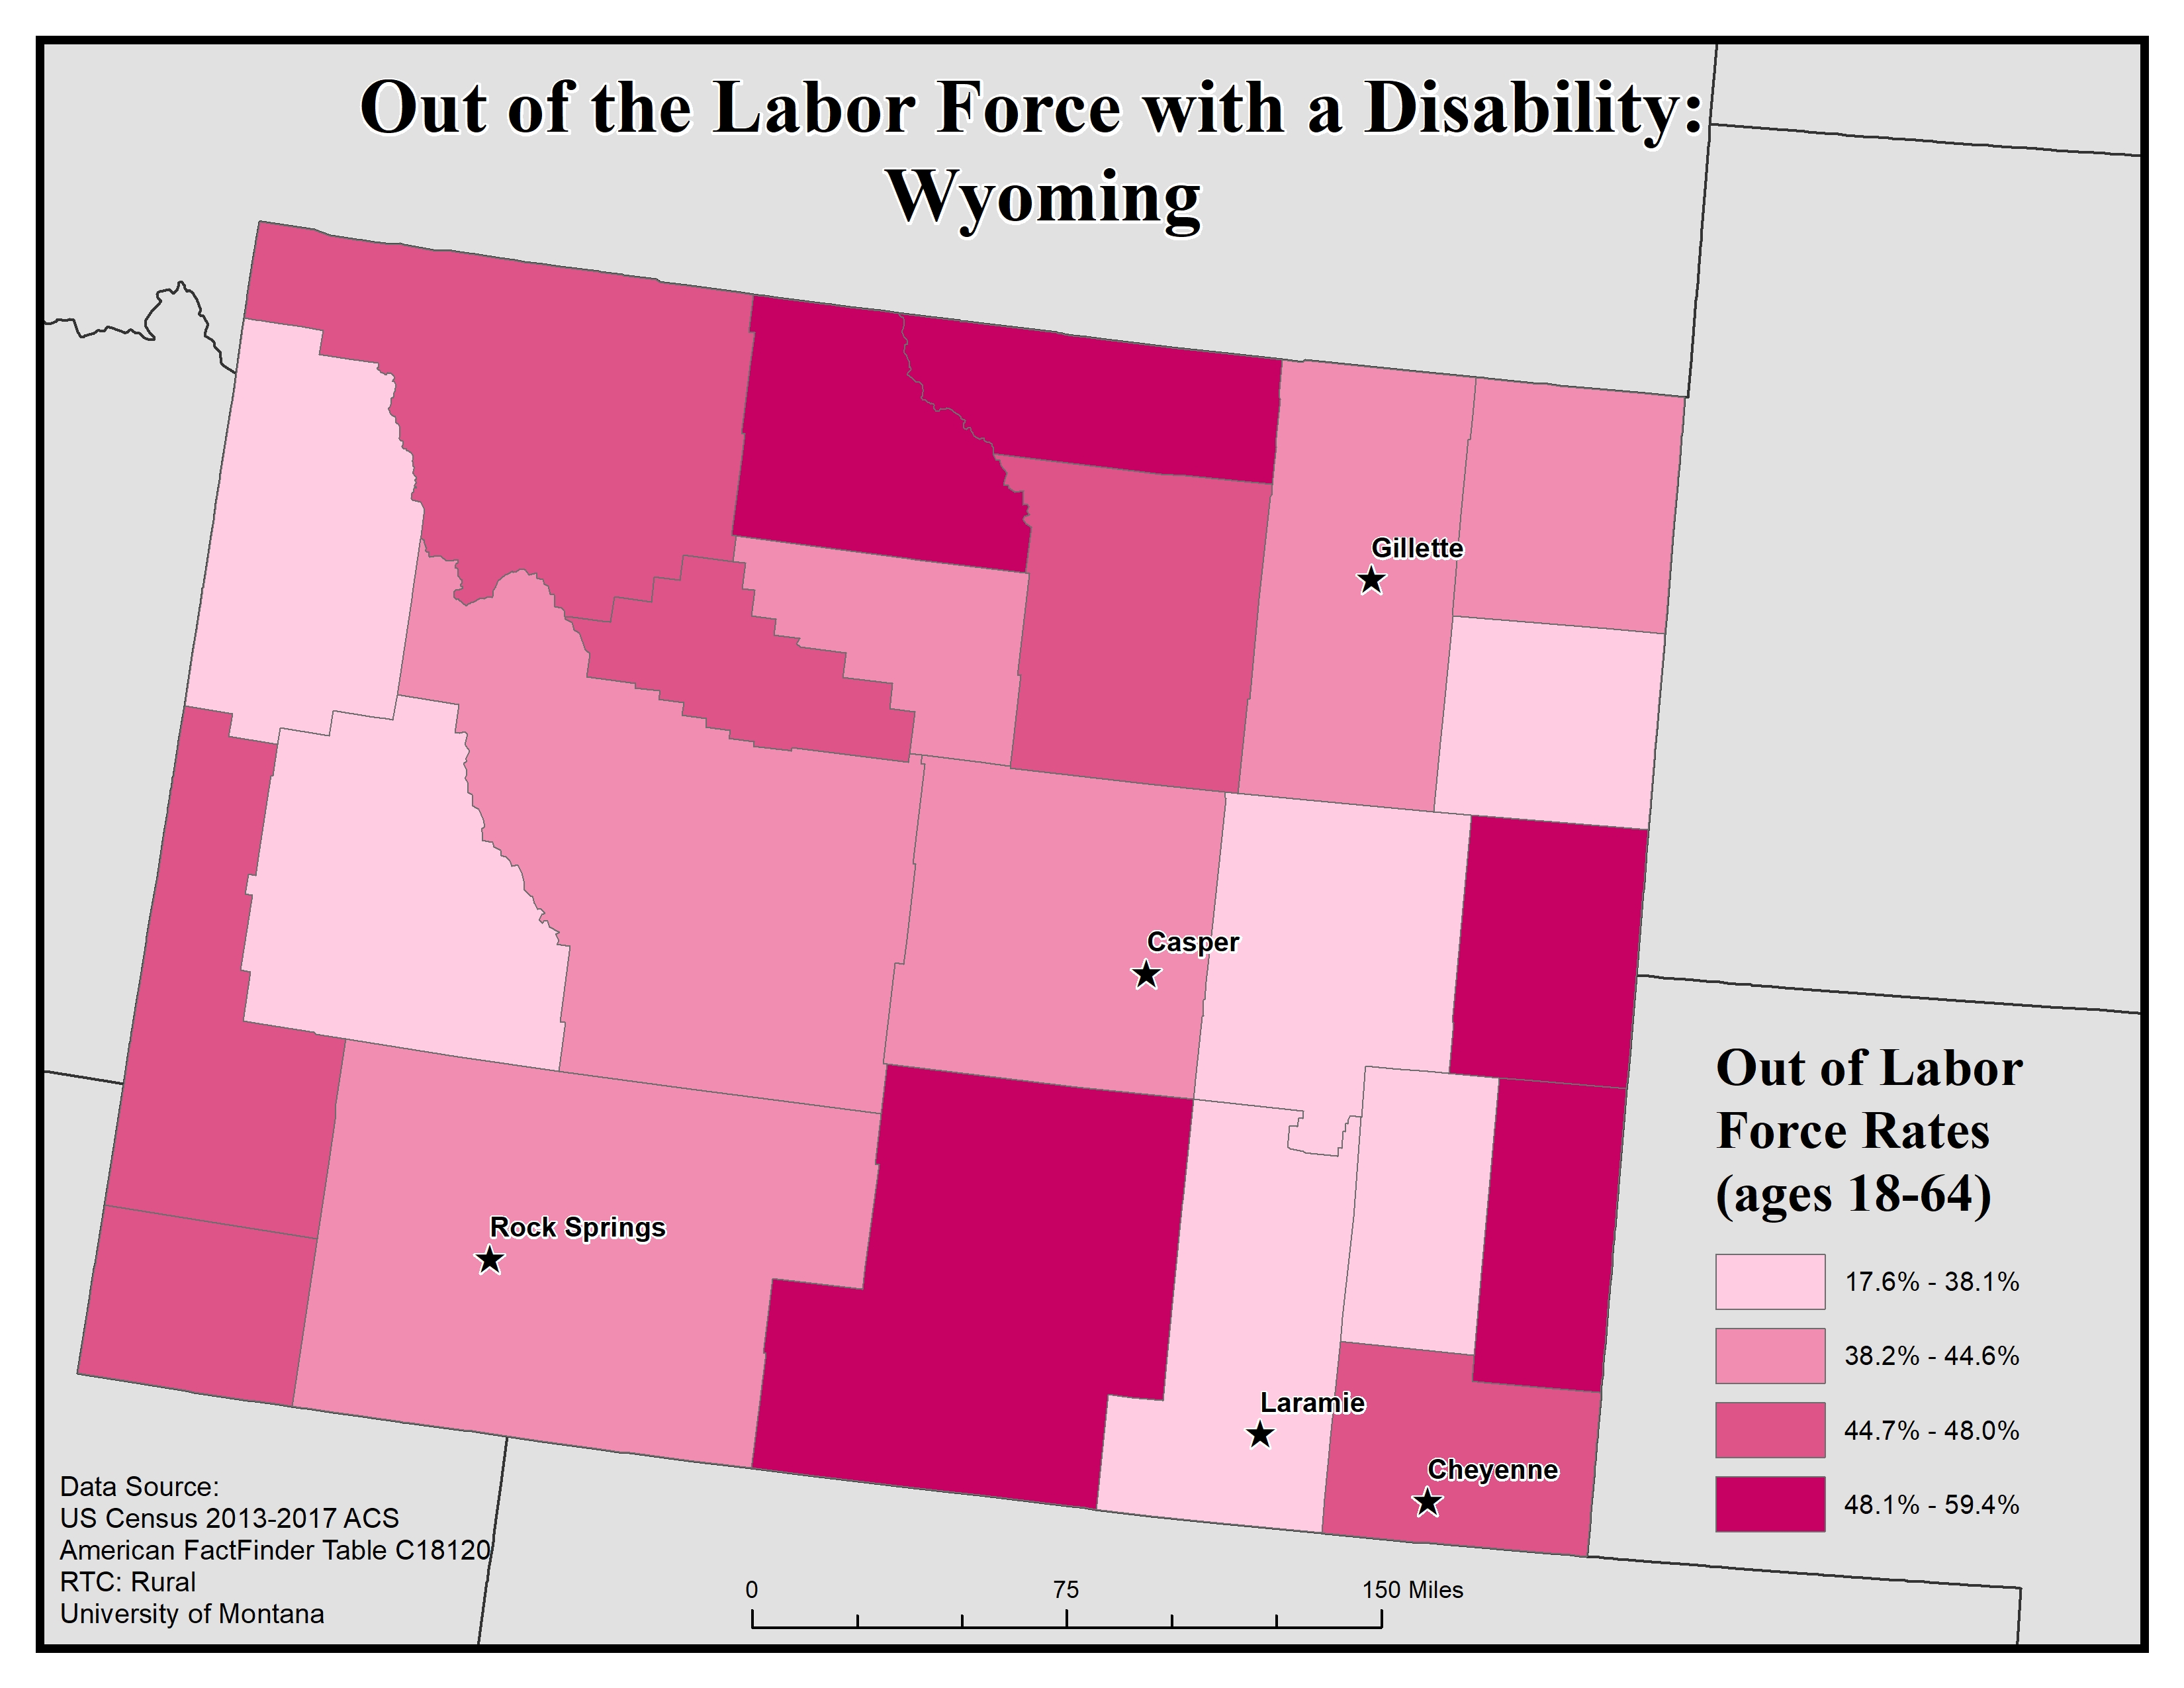
This map of the state of Wyoming shows rates of people with disabilities (ages 18 to 64) who are out of the labor force by county. Rates are broken into four categories, from 17.6 to 38.1%.
The five largest urban areas (Cheyenne, Laramie, Rock Springs, Casper, and Gillette) are labeled to show if there are any differences between disability rates in urban vs rural areas.
Cheyenne is in a county with the second-highest rate, of 44.7 to 48.0%. Rock Springs, Casper, and Gillette are in counties with the second-lowest rate, of 38.2 to 44.6%, and Laramie is in a county with the lowest rate, of 17.6 to 38.1%. While rates are somewhat varied across the state, they appear to be slightly lower in urban areas and higher in rural.
Map produced February 2020 based on 2013-2017 American Community Survey data.
- Click on the map for a larger, downloadable version.
- To browse or download the data used to make this map, use our Disability Data Lookup Tool.
Disability Rates by Functional Limitation: Wyoming
-
This map explores the American Community Survey (ACS) 5-year data (Table S1810) on disability estimates by county.
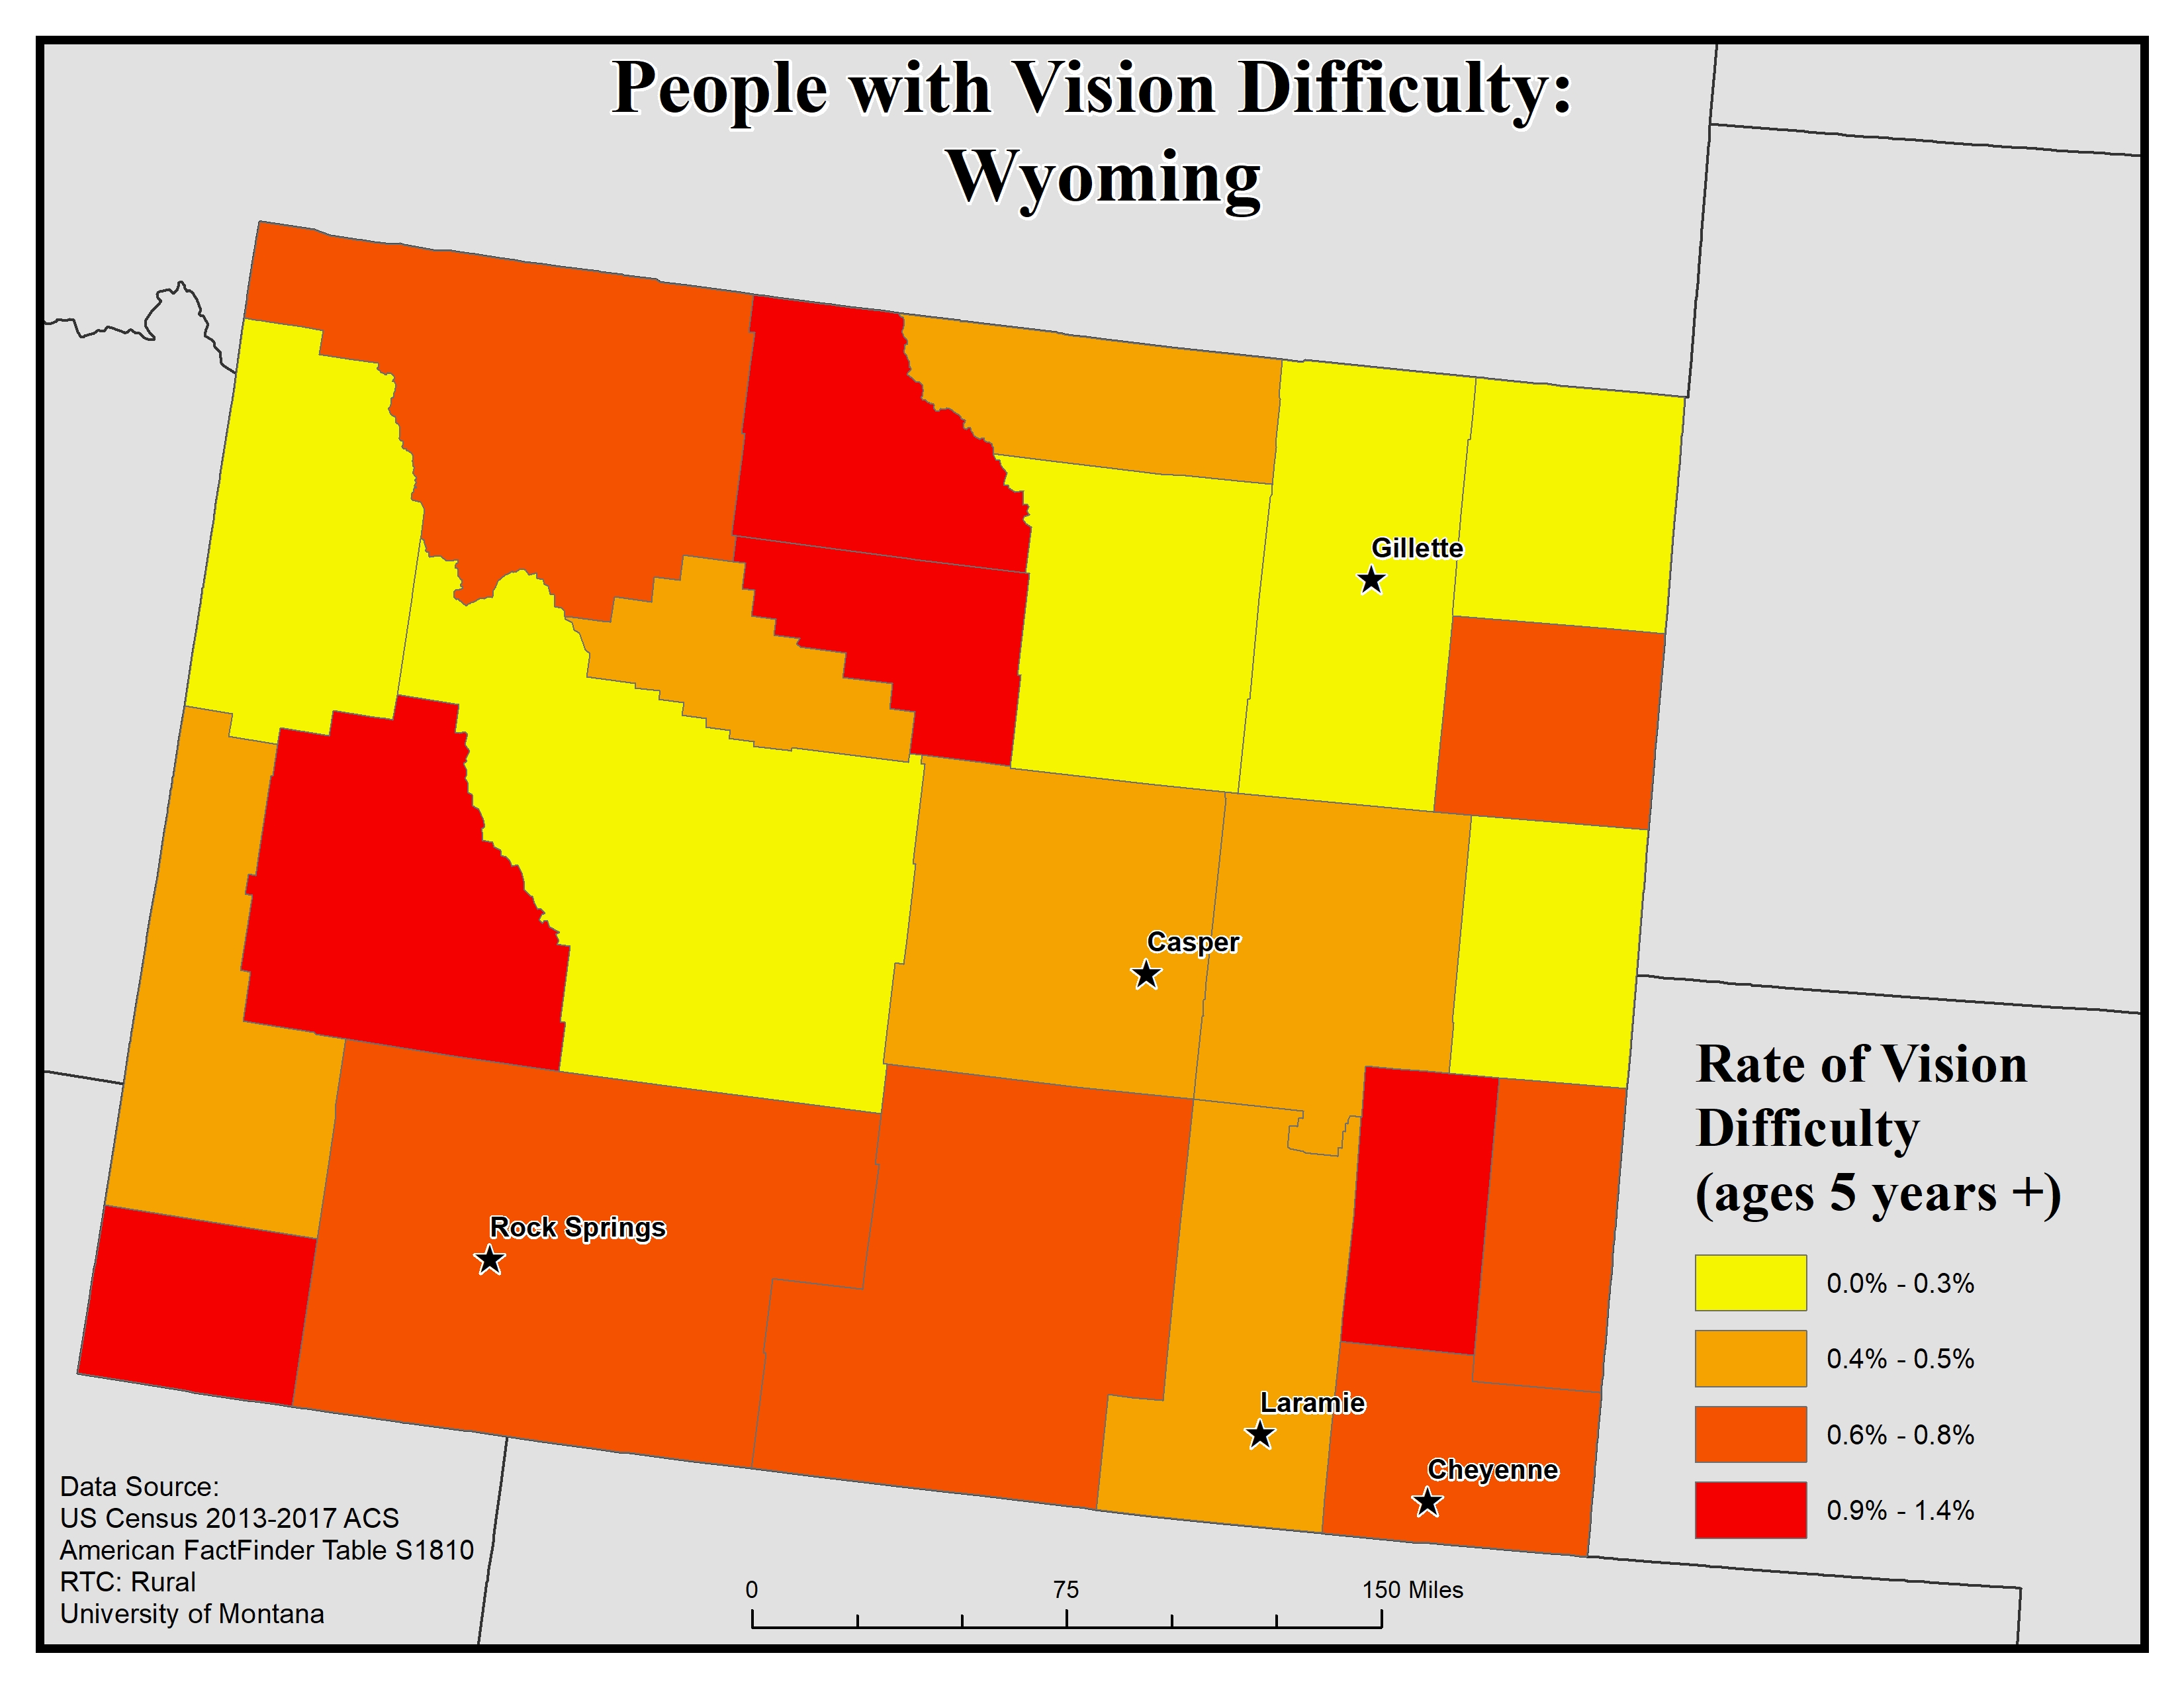
For vision difficulty the ACS asks if a respondent is blind or has serious difficulty seeing, even when wearing glasses. If they answer “yes” they are classified as having a vision difficulty. This data is for all ages.
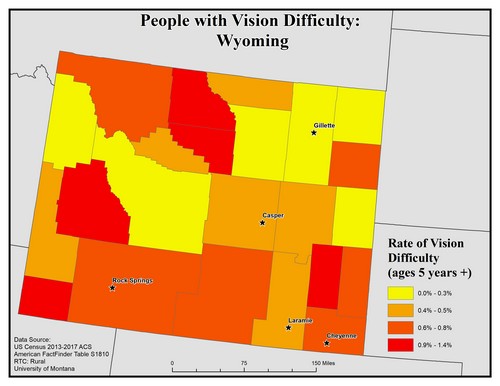
This map of the state of Wyoming shows rates of people with vision difficulty for ages 5 and older by county. Rates are broken into four categories, from 0.0 to 1.4%.
The five largest urban areas (Cheyenne, Laramie, Rock Springs, Casper, and Gillette) are labeled to show if there are any differences between disability rates in urban vs rural areas. Overall, rates are somewhat varied across the state, but there are generally higher rates of disability in rural counties compared to urban ones.
Rock Springs and Cheyenne are located in counties with the second-highest rate, of 0.6 to 0.8%. Laramie and Casper are located in counties with the second-lowest rate, of 0.4 to 0.5%. Gillette is in a county with the lowest rate, of 0.0 to 0.3%.
Map produced February 2020 based on 2013-2017 American Community Survey data.
- Click on the map for a larger, downloadable version.
- To browse or download the data used to make this map, use our Disability Data Lookup Tool.
-
This map explores the American Community Survey (ACS) 5-year data (Table S1810) on disability estimates by county.
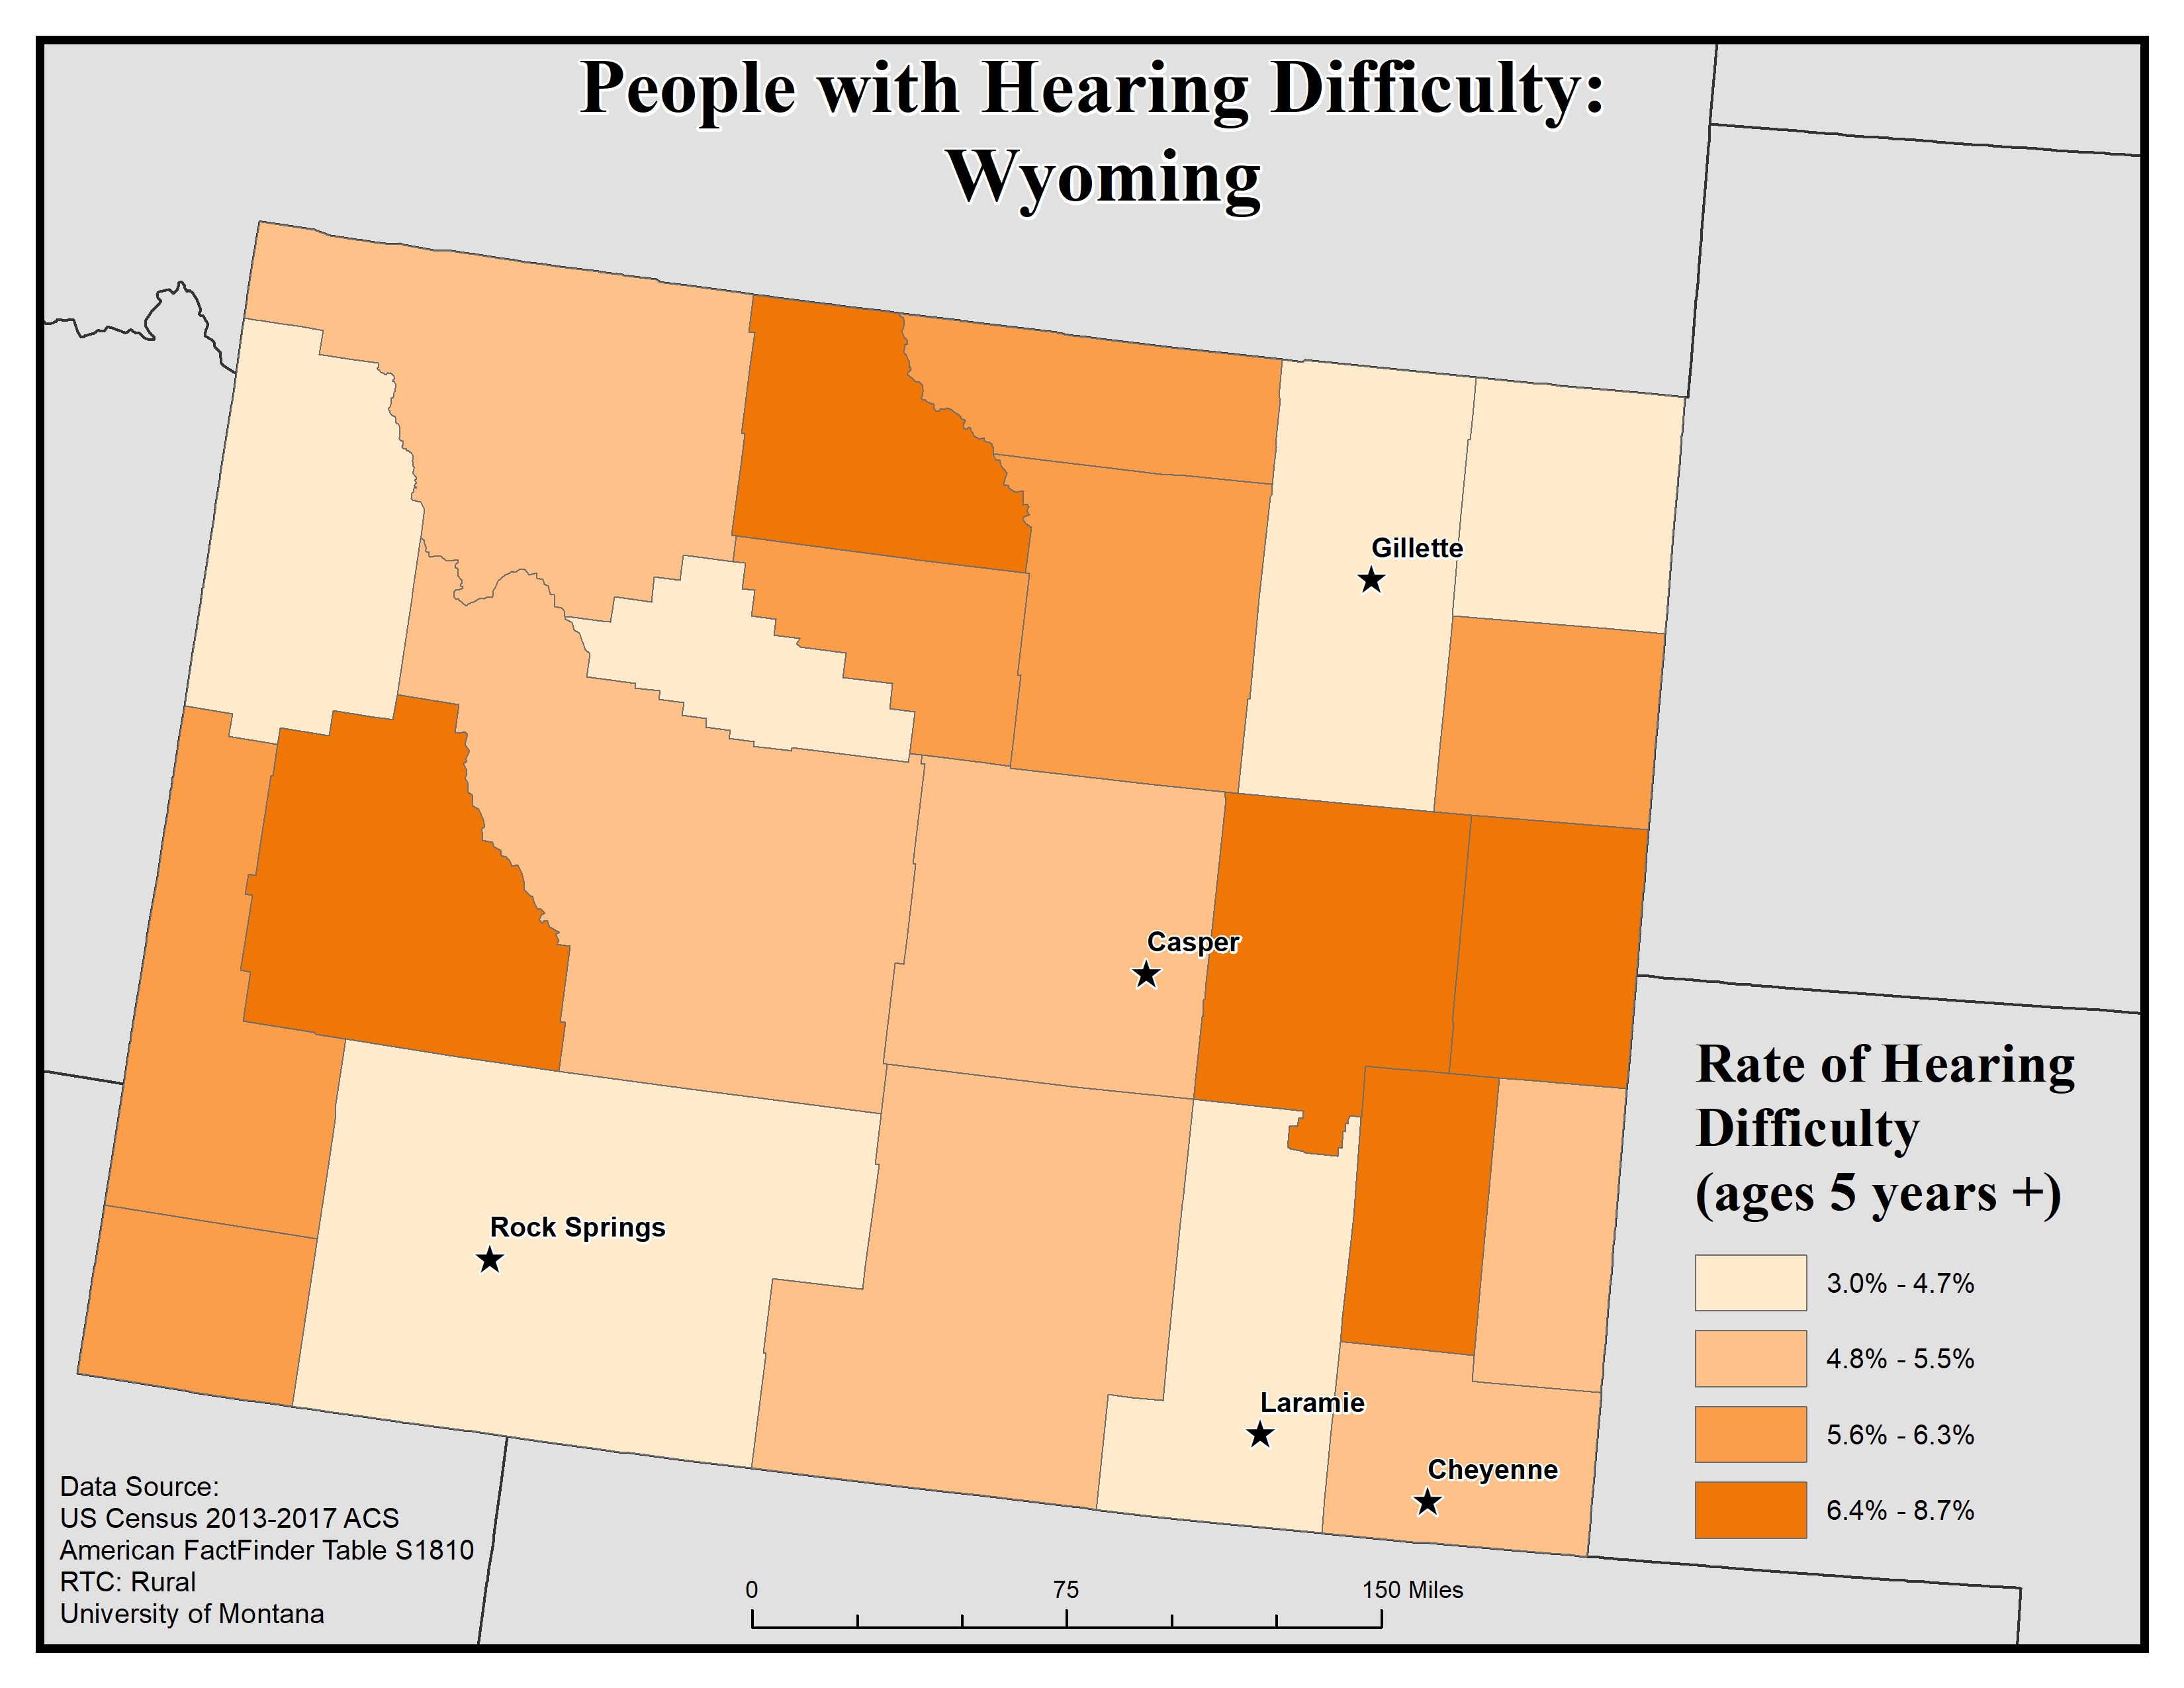
For hearing difficulty the ACS asks if a respondent is deaf or has serious difficulty hearing. If they answer “yes” they are classified as having a hearing difficulty. This data is for all ages.
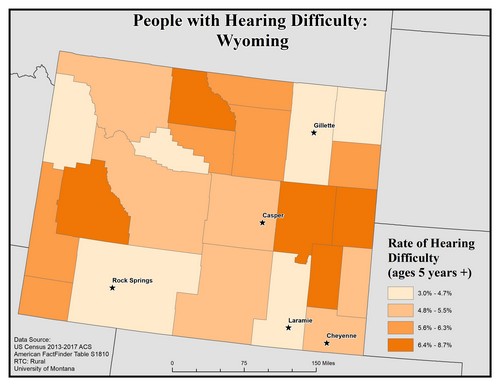
This map of the state of Wyoming shows rates of people with hearing difficulty for ages 5 and older by county. Rates are broken into four categories, from 3.0 to 8.7%
The five largest urban areas (Cheyenne, Laramie, Rock Springs, Casper, and Gillette) are labeled to show if there are any differences between disability rates in urban vs rural areas. Overall, rates are varied across the state, but there tend to be higher rates of disability in rural counties compared to urban ones.
Casper and Cheyenne are in counties with the second-lowest rate, of 4.8 to 5.5%. Rock Springs, Laramie, and Gillette are in counties with the lowest rate, of 3.0 to 4.7%.
Map produced February 2020 based on 2013-2017 American Community Survey data.
- Click on the map for a larger, downloadable version.
- To browse or download the data used to make this map, use our Disability Data Lookup Tool.
-
This map explores the American Community Survey (ACS) 5-year data (Table S1810) on disability estimates by county.
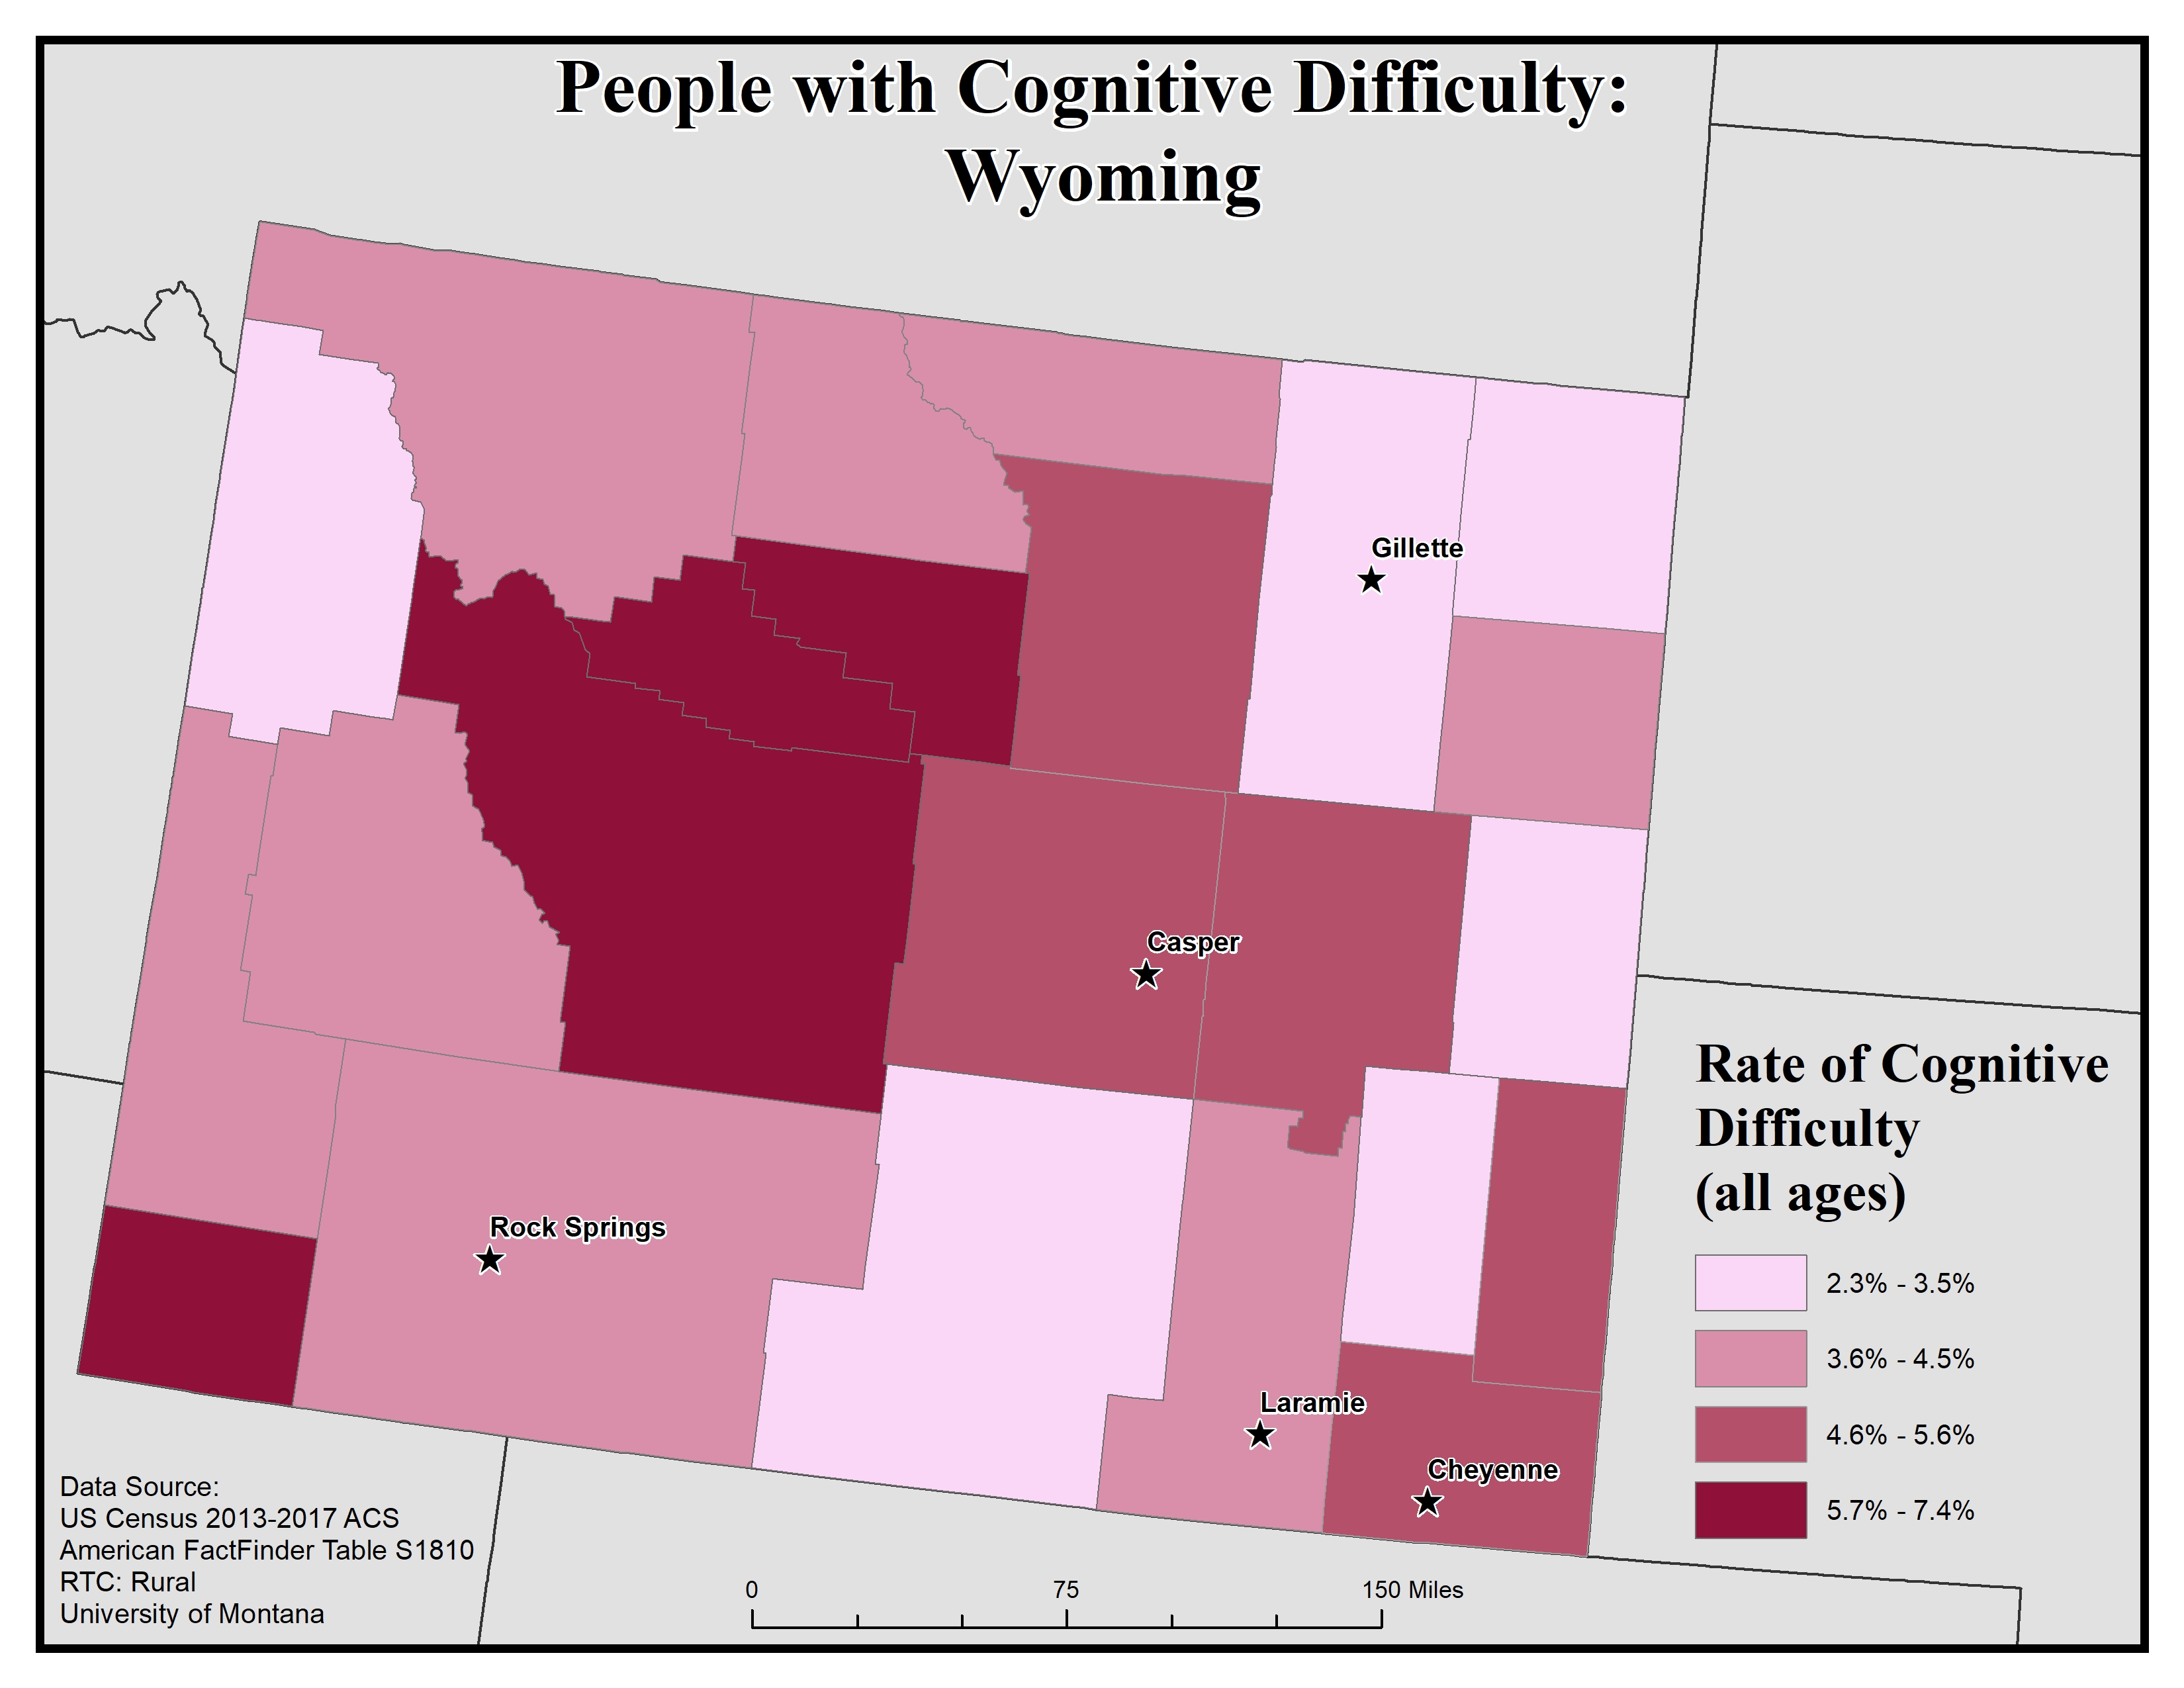
For cognitive difficulty the ACS asks because of a physical, mental, or emotional problem, does the respondent have difficulty remembering, concentrating, or making decisions. If they answer “yes” they are classified as having a cognitive difficulty. This data is for ages 5 and up.
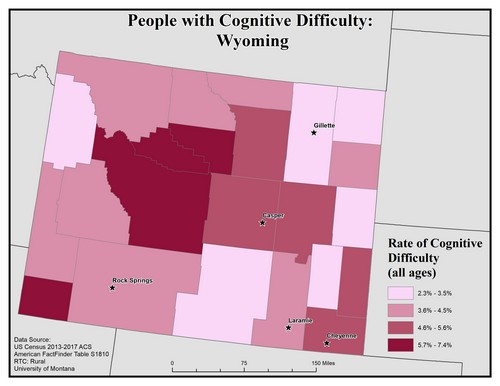
This map of the state of Wyoming shows rates of people with cognitive difficulty by county. Rates are broken into four categories, from 2.3 to 7.4%.
The five largest urban areas (Cheyenne, Laramie, Rock Springs, Casper, and Gillette) are labeled to show if there are any differences between disability rates in urban vs rural areas.
Cheyenne and Casper are located in counties with the second-highest rate, of 4.6 to 5.6%. Rock Springs and Laramie are located in counties with the second-lowest rate, of 3.6 to 4.5%. Gillette is in a county with the lowest rate, of 2.3 to 3.5%.
Overall, rates are varied across the state, but there tend to be higher rates of disability in rural counties compared to urban ones. There is a large pocket of counties with the highest rate, of 5.7 to 7.4%, in the middle of the state west of Casper.
Map produced February 2020 based on 2013-2017 American Community Survey data.
- Click on the map for a larger, downloadable version.
- To browse or download the data used to make this map, use our Disability Data Lookup Tool.
-
This map explores the American Community Survey (ACS) 5-year data (Table S1810) on disability estimates by county.
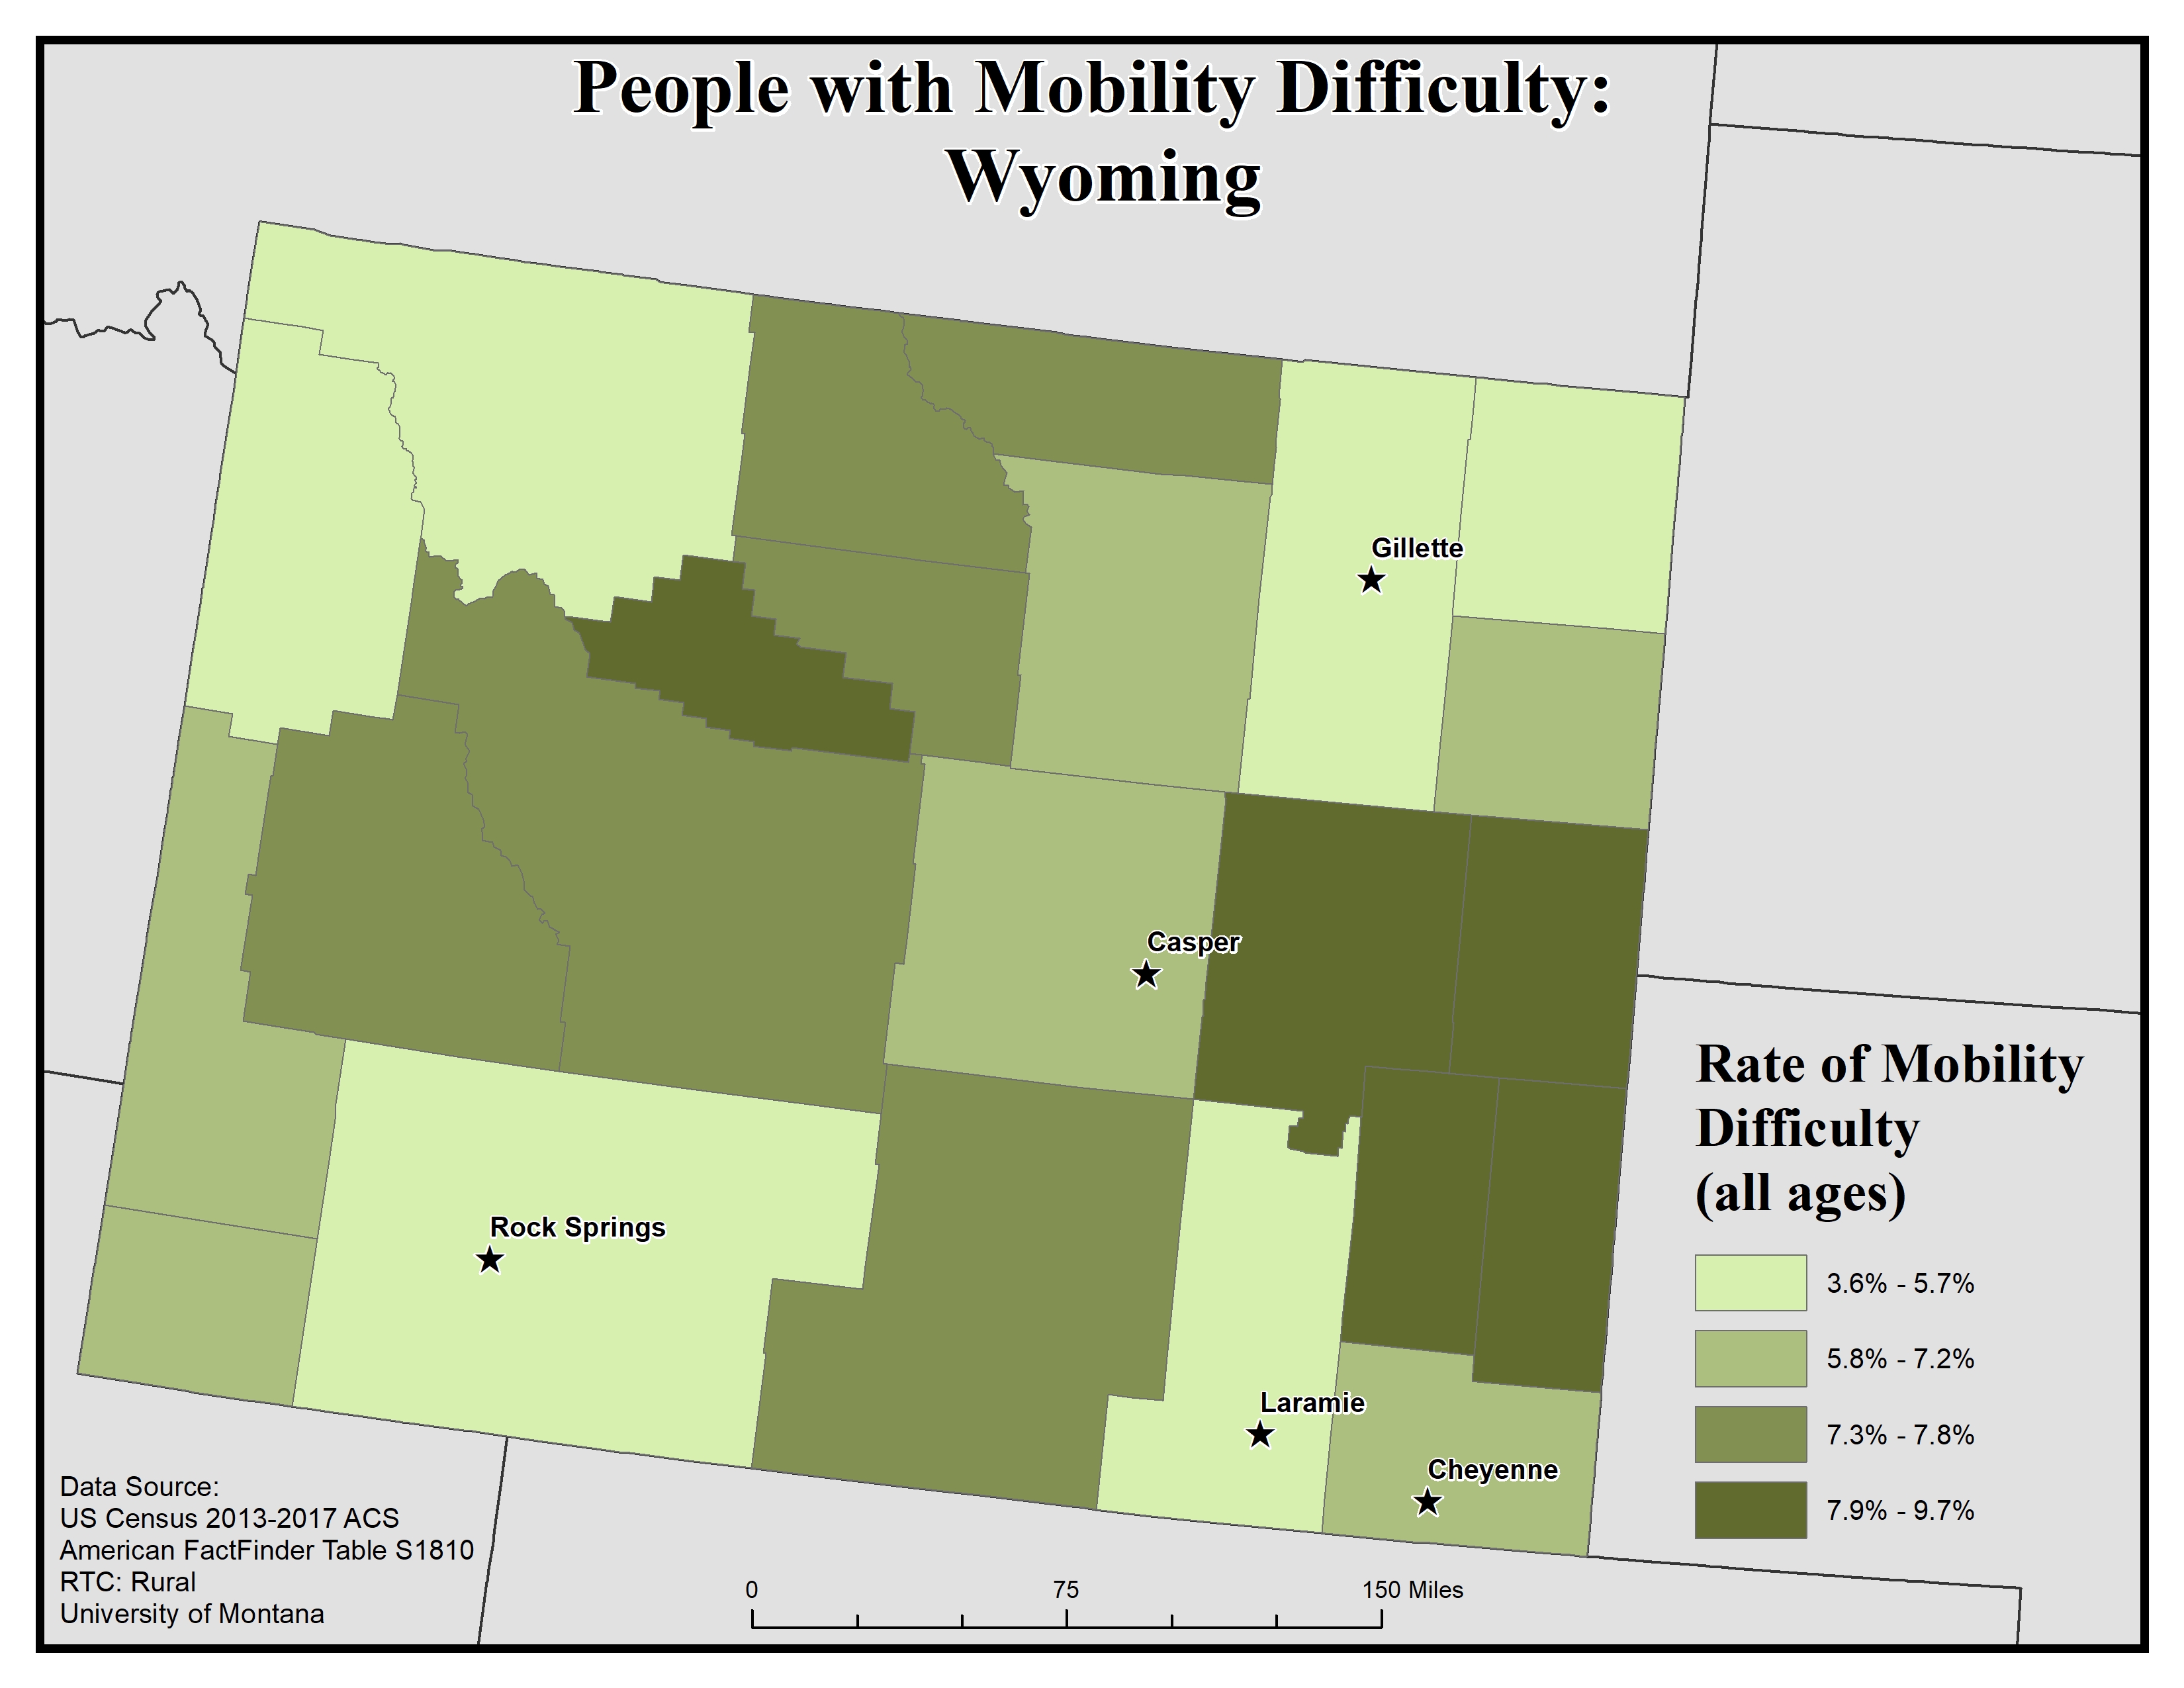
For ambulatory (i.e. mobility) difficulty the ACS asks if a respondent has serious difficulty walking or climbing stairs. If they answer “yes” they are classified as having a mobility difficulty. This data is for ages 5 and up.
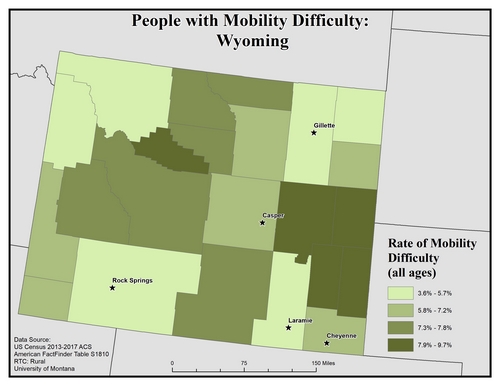
This map of the state of Wyoming shows rates of people with mobility difficulty by county. Rates are broken into four categories, from 3.6 to 9.7%.
The five largest urban areas (Cheyenne, Laramie, Rock Springs, Casper, and Gillette) are labeled to show if there are any differences between disability rates in urban vs rural areas.
Cheyenne and Casper are located in counties with the second-lowest rate, of 7.3 to 7.8%. Rock Springs, Laramie, and Gillette are located in counties with the lowest rate, of 3.6 to 5.7%.
Overall, rates are varied across the state, but there tend to be higher rates of disability in rural counties compared to urban ones.
Map produced February 2020 based on 2013-2017 American Community Survey data.
- Click on the map for a larger, downloadable version.
- To browse or download the data used to make this map, use our Disability Data Lookup Tool.
-
This map explores the American Community Survey (ACS) 5-year data (Table S1810) on disability estimates by county.
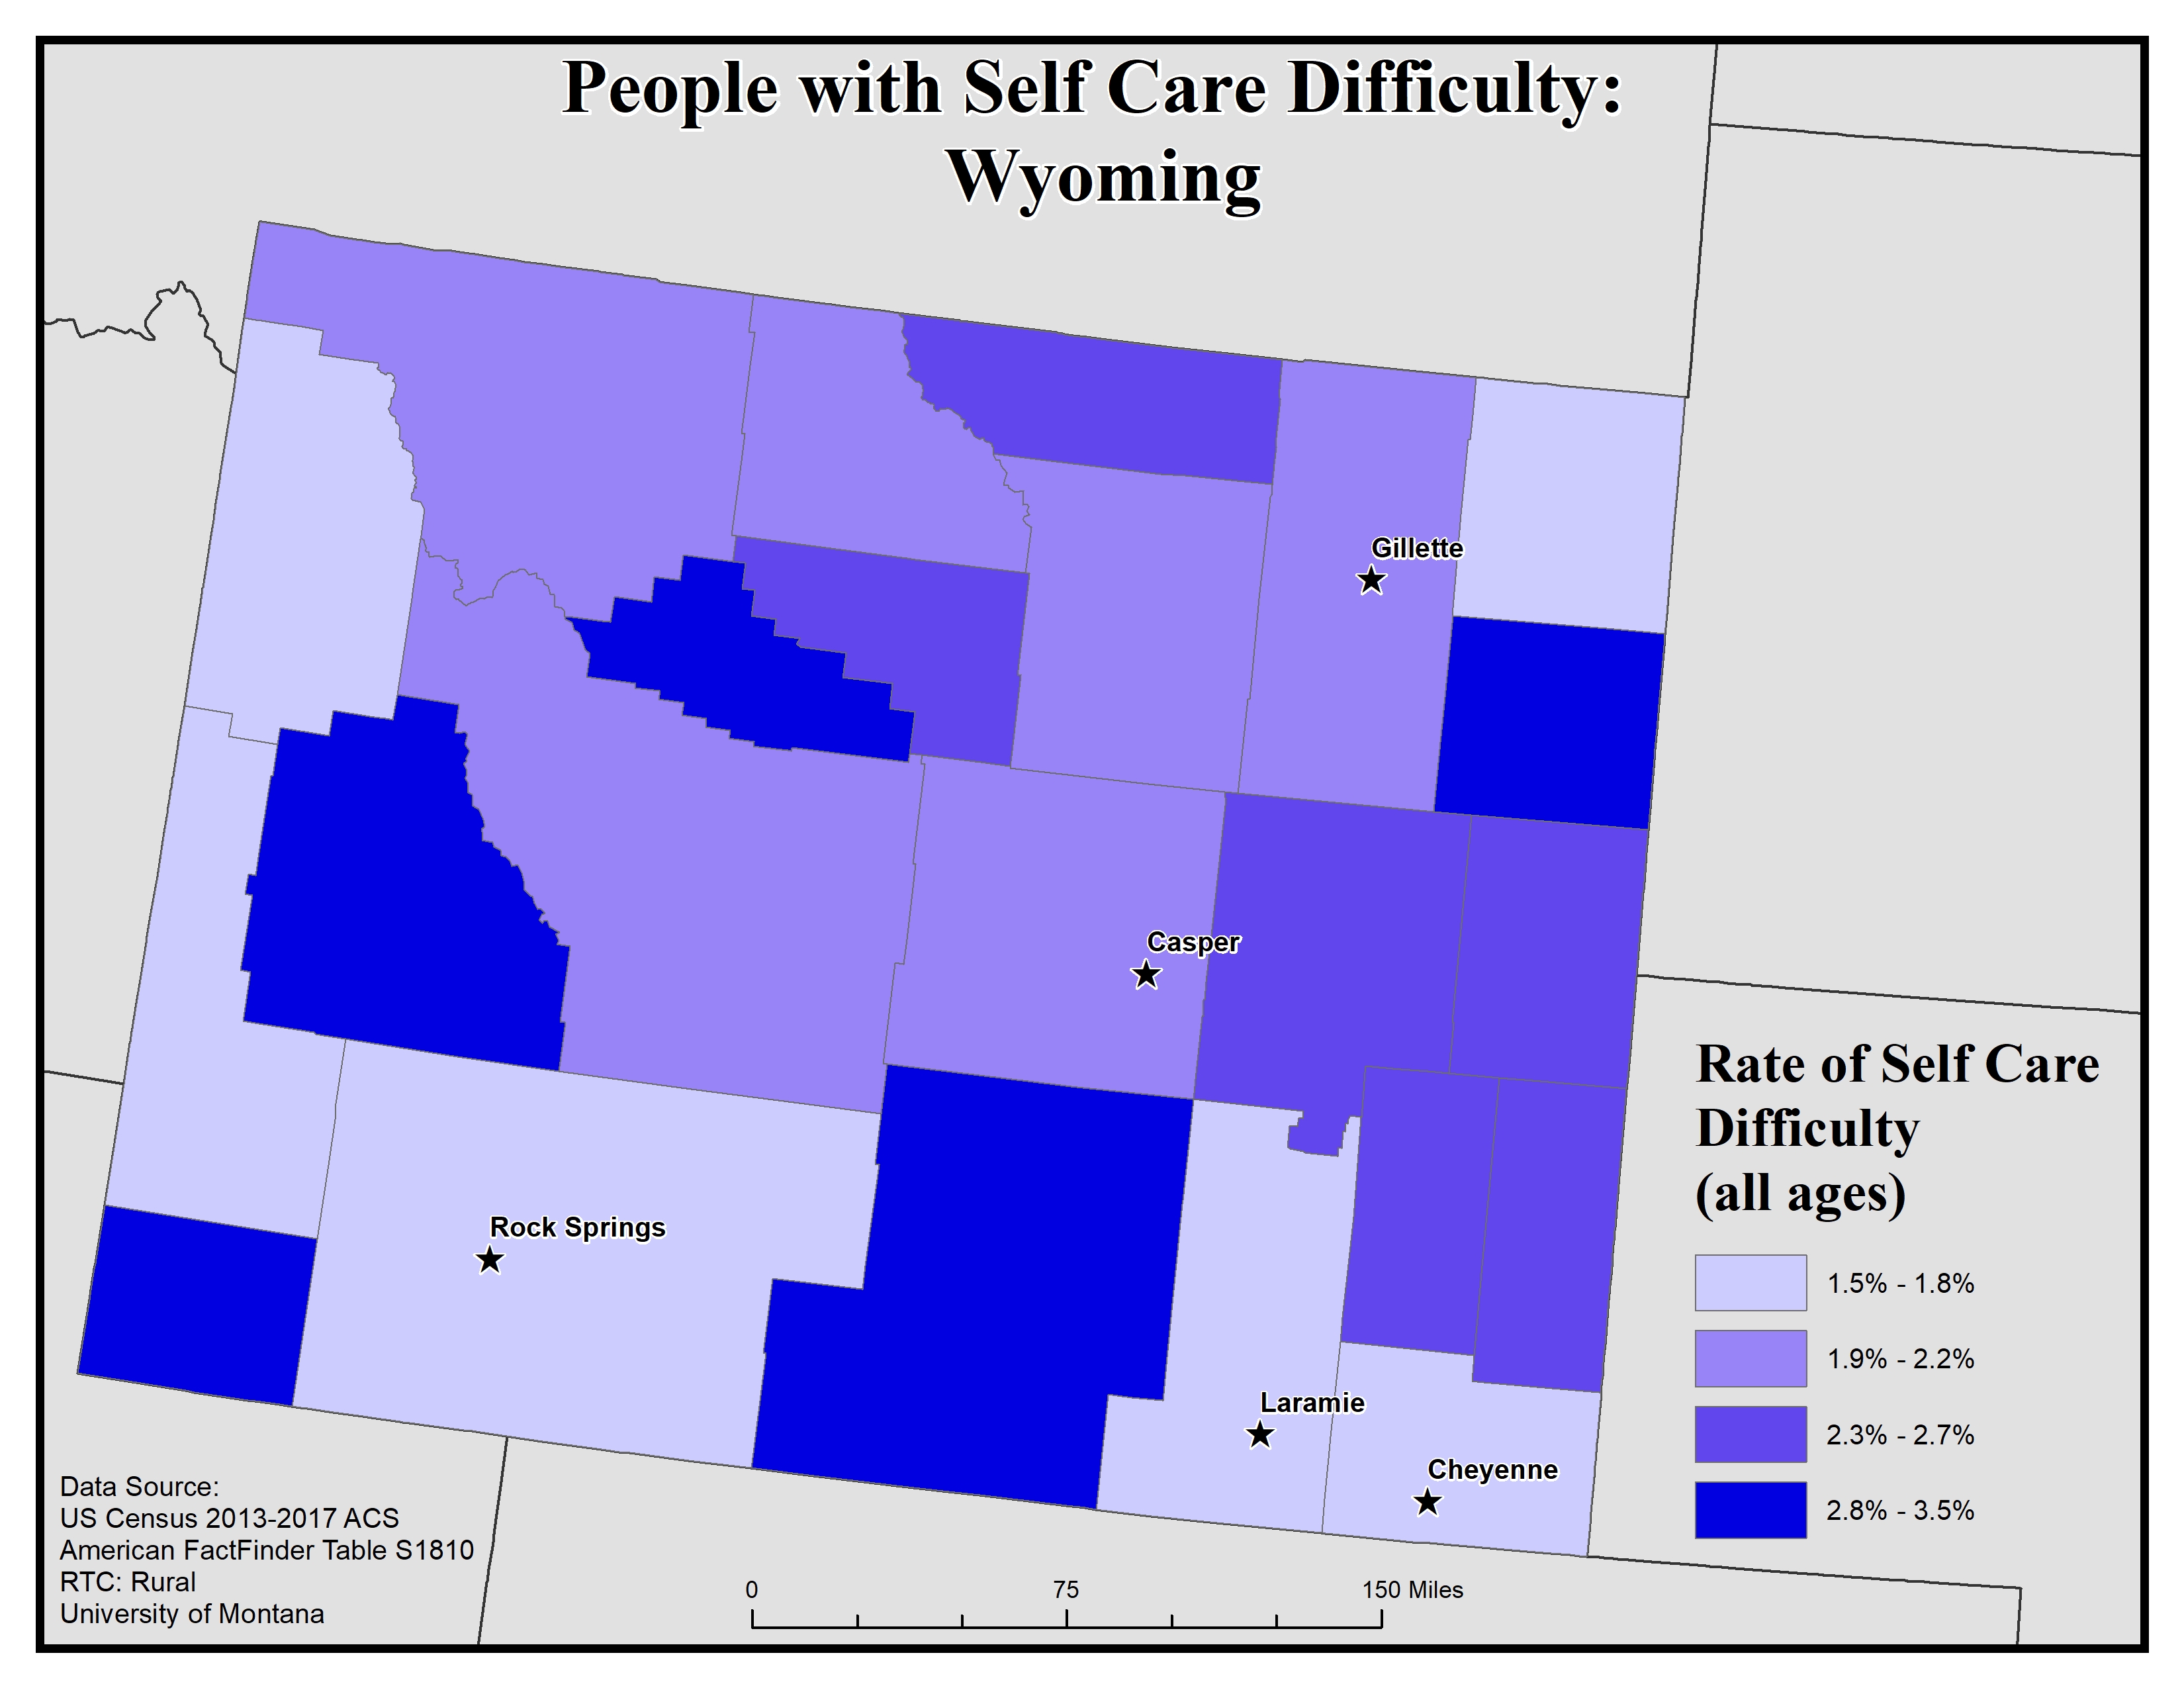
For self-care difficulty the ACS asks if a respondent has difficulty bathing or dressing. If they answer “yes” they are classified as having a self-care difficulty. This data is for ages 5 and up.

This map of the state of Wyoming shows rates of people with self care difficulty by county. Rates are broken into four categories, from 1.5 to 3.5%.
The five largest urban areas (Cheyenne, Laramie, Rock Springs, Casper, and Gillette) are labeled to show if there are any differences between disability rates in urban vs rural areas. Casper and Gillette are located in counties with the second-lowest rate, of 1.9 to 2.2%. Rock Springs, Laramie, and Cheyenne are in counties with the lowest rate, of 1.5 to 1.8%.
Overall, rates are varied across the state, but there tend to be higher rates of disability in rural counties compared to urban ones. More counties have rates in the two lowest categories (1.5 to 1.8% and 1.9 to 2.2%) than in the highest two categories (2.3 to 2.7% and 2.8 to 3.5%).
Map produced February 2020 based on 2013-2017 American Community Survey data.
- Click on the map for a larger, downloadable version.
- To browse or download the data used to make this map, use our Disability Data Lookup Tool.
-
This map explores the American Community Survey (ACS) 5-year data (Table S1810) on disability estimates by county.
For independent living difficulty the ACS asks because of a physical, mental, or emotional problem, does the respondent have difficulty doing errands alone such as visiting a doctor’s office or shopping. If they answer “yes” they are classified as having an independent living difficulty. This data is for ages 18 and up.
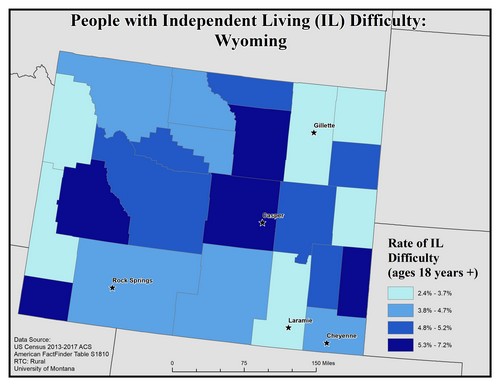
This map of the state of Wyoming shows rates of people with Independent Living (IL) difficulty by county. Rates are broken into four categories, from 2.4 to 7.2%.
The five largest urban areas (Cheyenne, Laramie, Rock Springs, Casper, and Gillette) are labeled to show if there are any differences between disability rates in urban vs rural areas.
Casper is in a county with the highest rate, of 5.3 to 7.2%. Rock Springs and Cheyenne are in counties with the second-lowest rate, of 3.8 to 4.7%, and Laramie and Gillette are in counties with the lowest rate, of 2.4 to 3.7%.
Overall, rates are varied across the state, but there tend to be higher rates of disability in rural counties compared to urban ones.
Map produced February 2020 based on 2013-2017 American Community Survey data.
- Click on the map for a larger, downloadable version.
- To browse or download the data used to make this map, use our Disability Data Lookup Tool.