The maps on this page explore the American Community Survey 5-year data (Table S1810) on disability by county.
The ACS does not directly measure disability. Instead, it uses a set of disability indicator questions related to difficulty and functional impairment to identify individuals who may experience a disability. If a respondent can answer “yes” to any disability question they are classified as having a disability.
Disability Rates: Maine
-
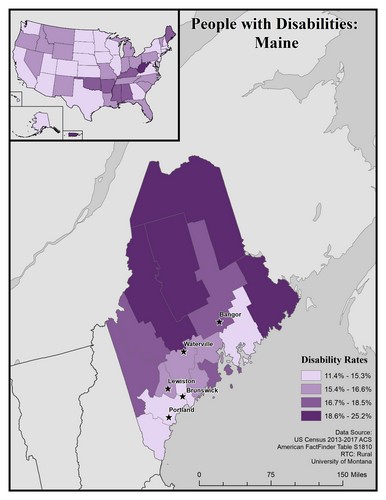
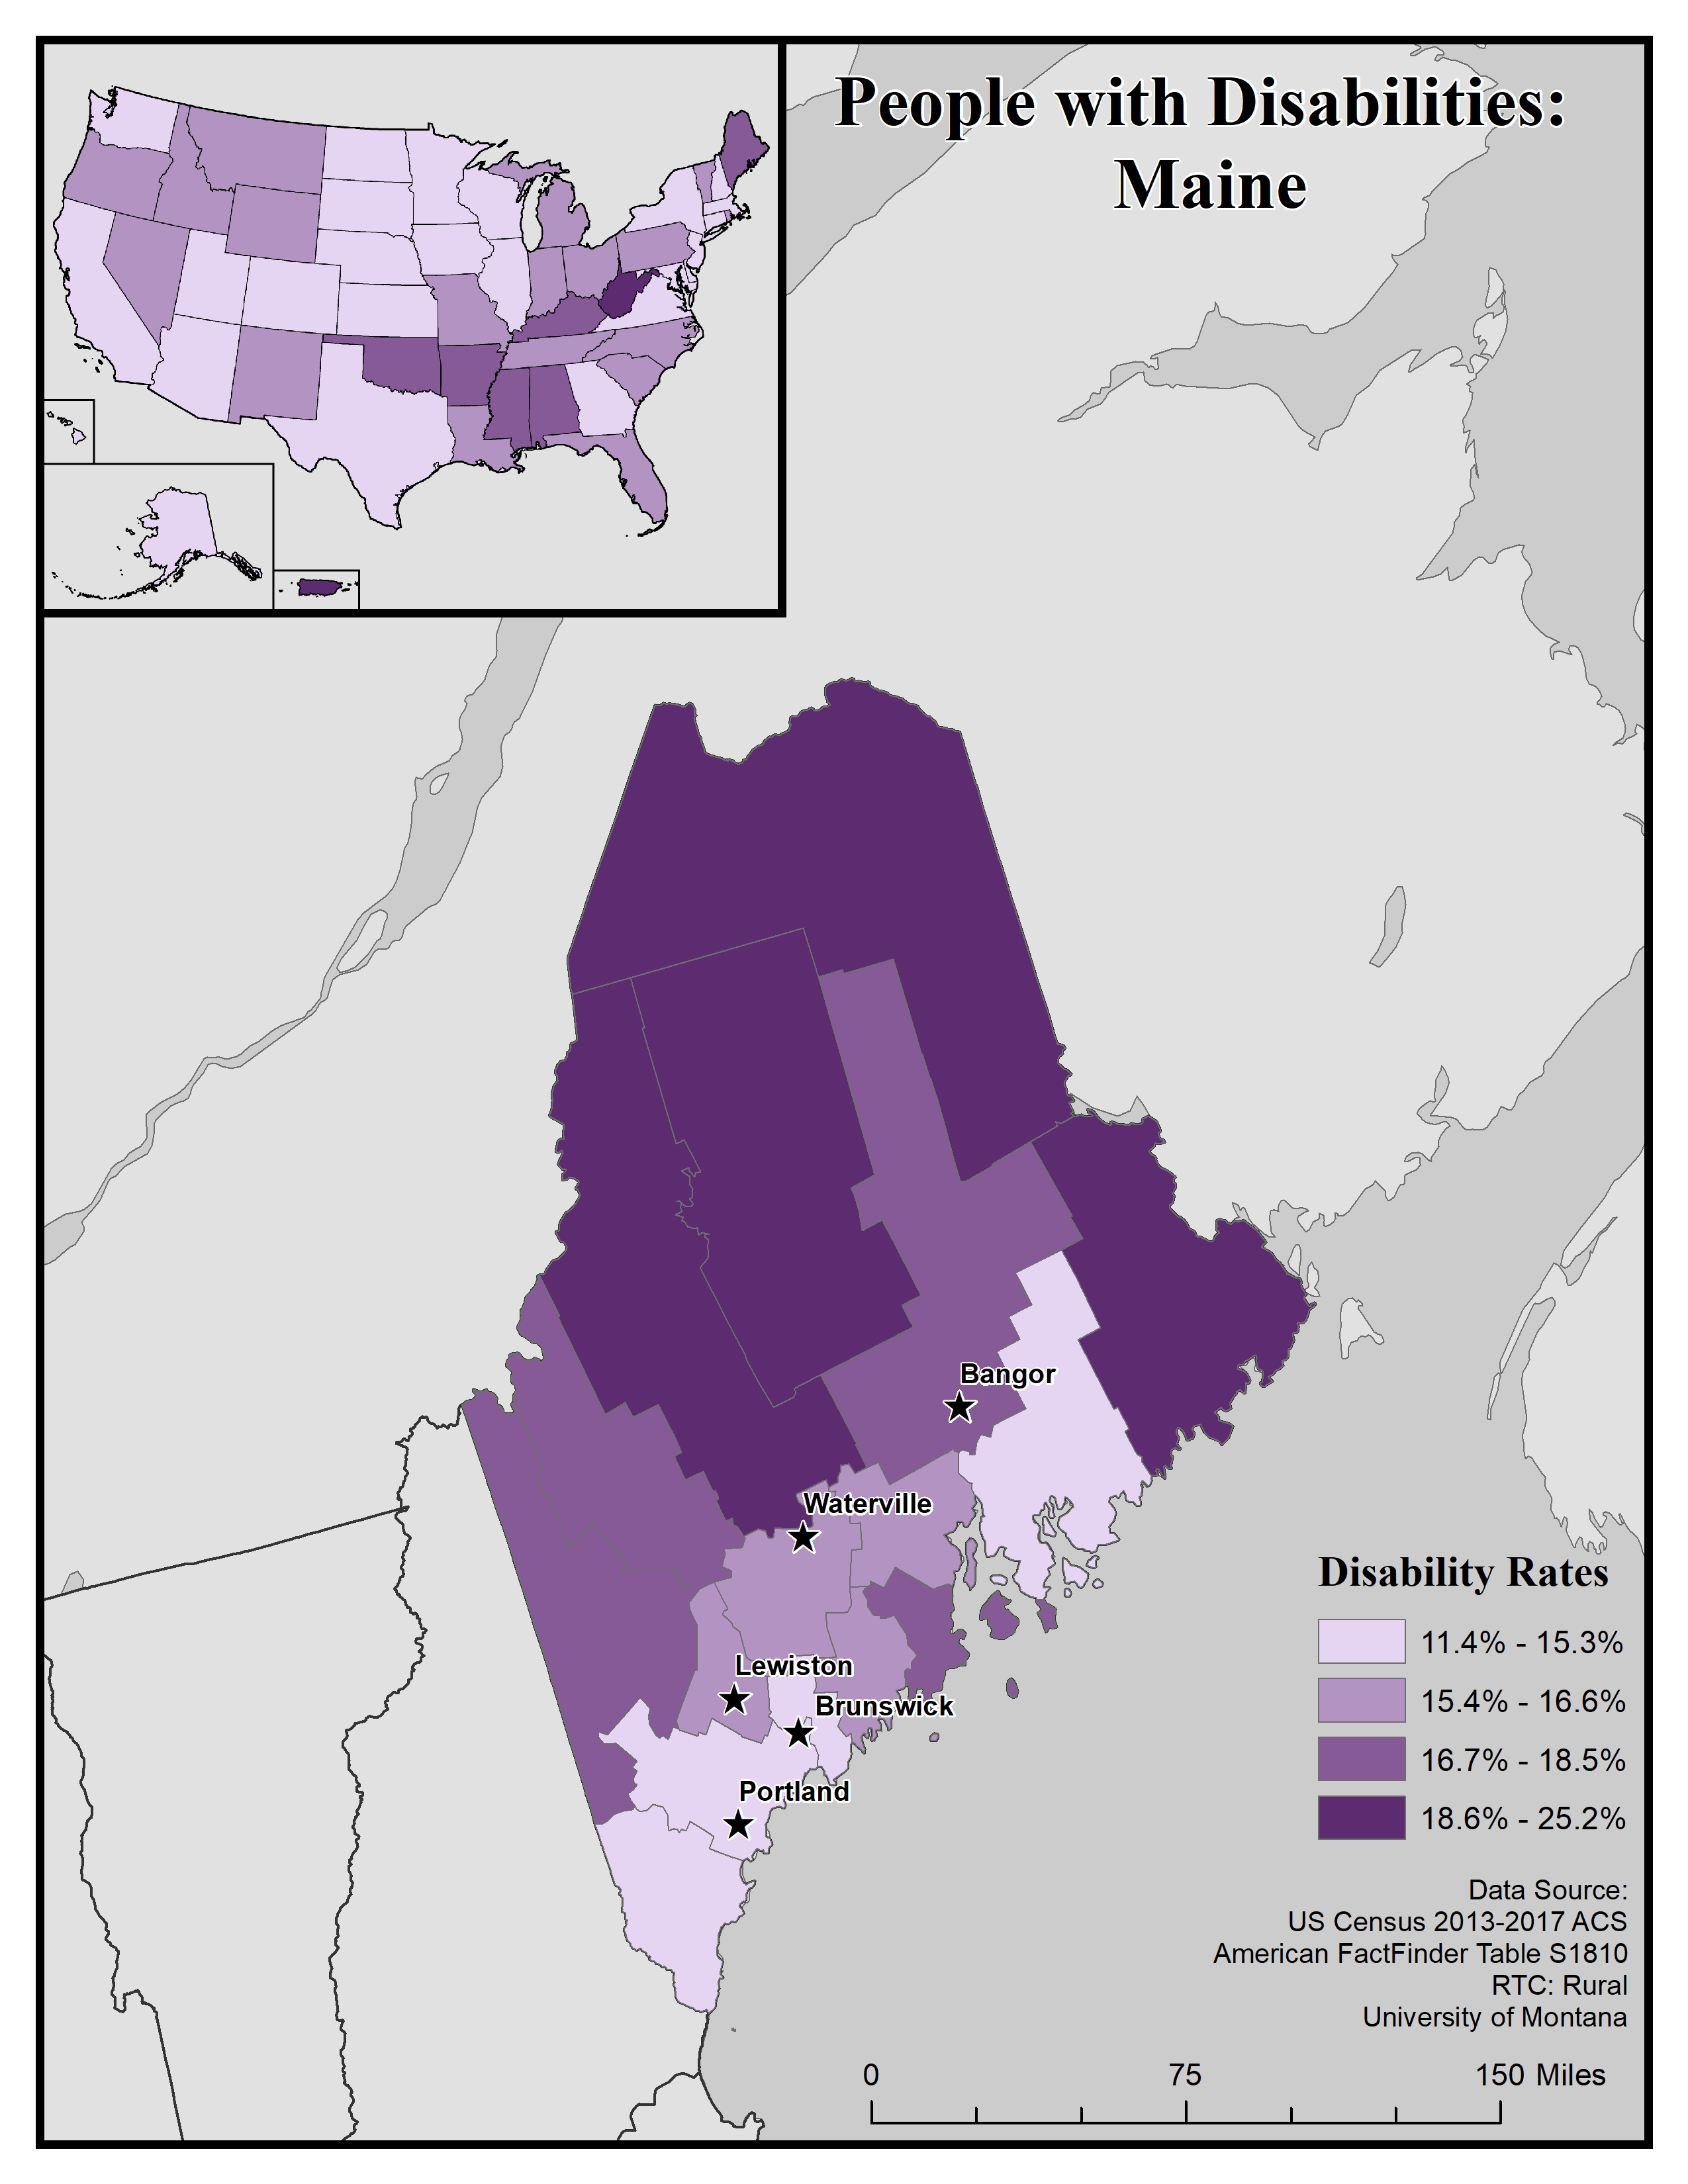
This map of the state of Maine shows general rates of disability by county. Disability rates are broken into four levels: 11.4 to 15.3%, 15.4 to 16.6%, 16.7 to 18.5%, 18.6 to 25.2%.
The five largest urban areas (Bangor, Waterville, Lewiston, Brunswick and Portland) are labeled on the map to show if there are any differences between disability rates in urban compared to rural areas. Overall, there are higher rates of disability in rural counties than urban ones. Most of the counties in the northern counties that are on the edges of the state have the highest disability rates. Of the major cities, Portland and Brunswick are in counties with the lowest rate, Lewiston and Waterville are in counties with the second lowest rate, and Bangor is in a county with the second highest rate.
In the upper corner there is an inset map of the United States showing how overall general disability rates in Maine compare to other states. Overall, disability rates in Maine are in the second highest category, which means Maine has higher disability rates than many other states and has similarity to Oklahoma, Kentucky, Arkansas, Mississippi and Alabama.
Map produced October 2019 based on 2013-2017 American Community Survey data.
- Click on the map for a larger, downloadable version.
- To browse or download the data used to make this map, use our Disability Data Lookup Tool.
-
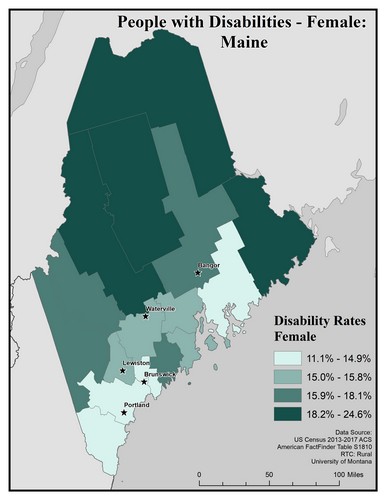
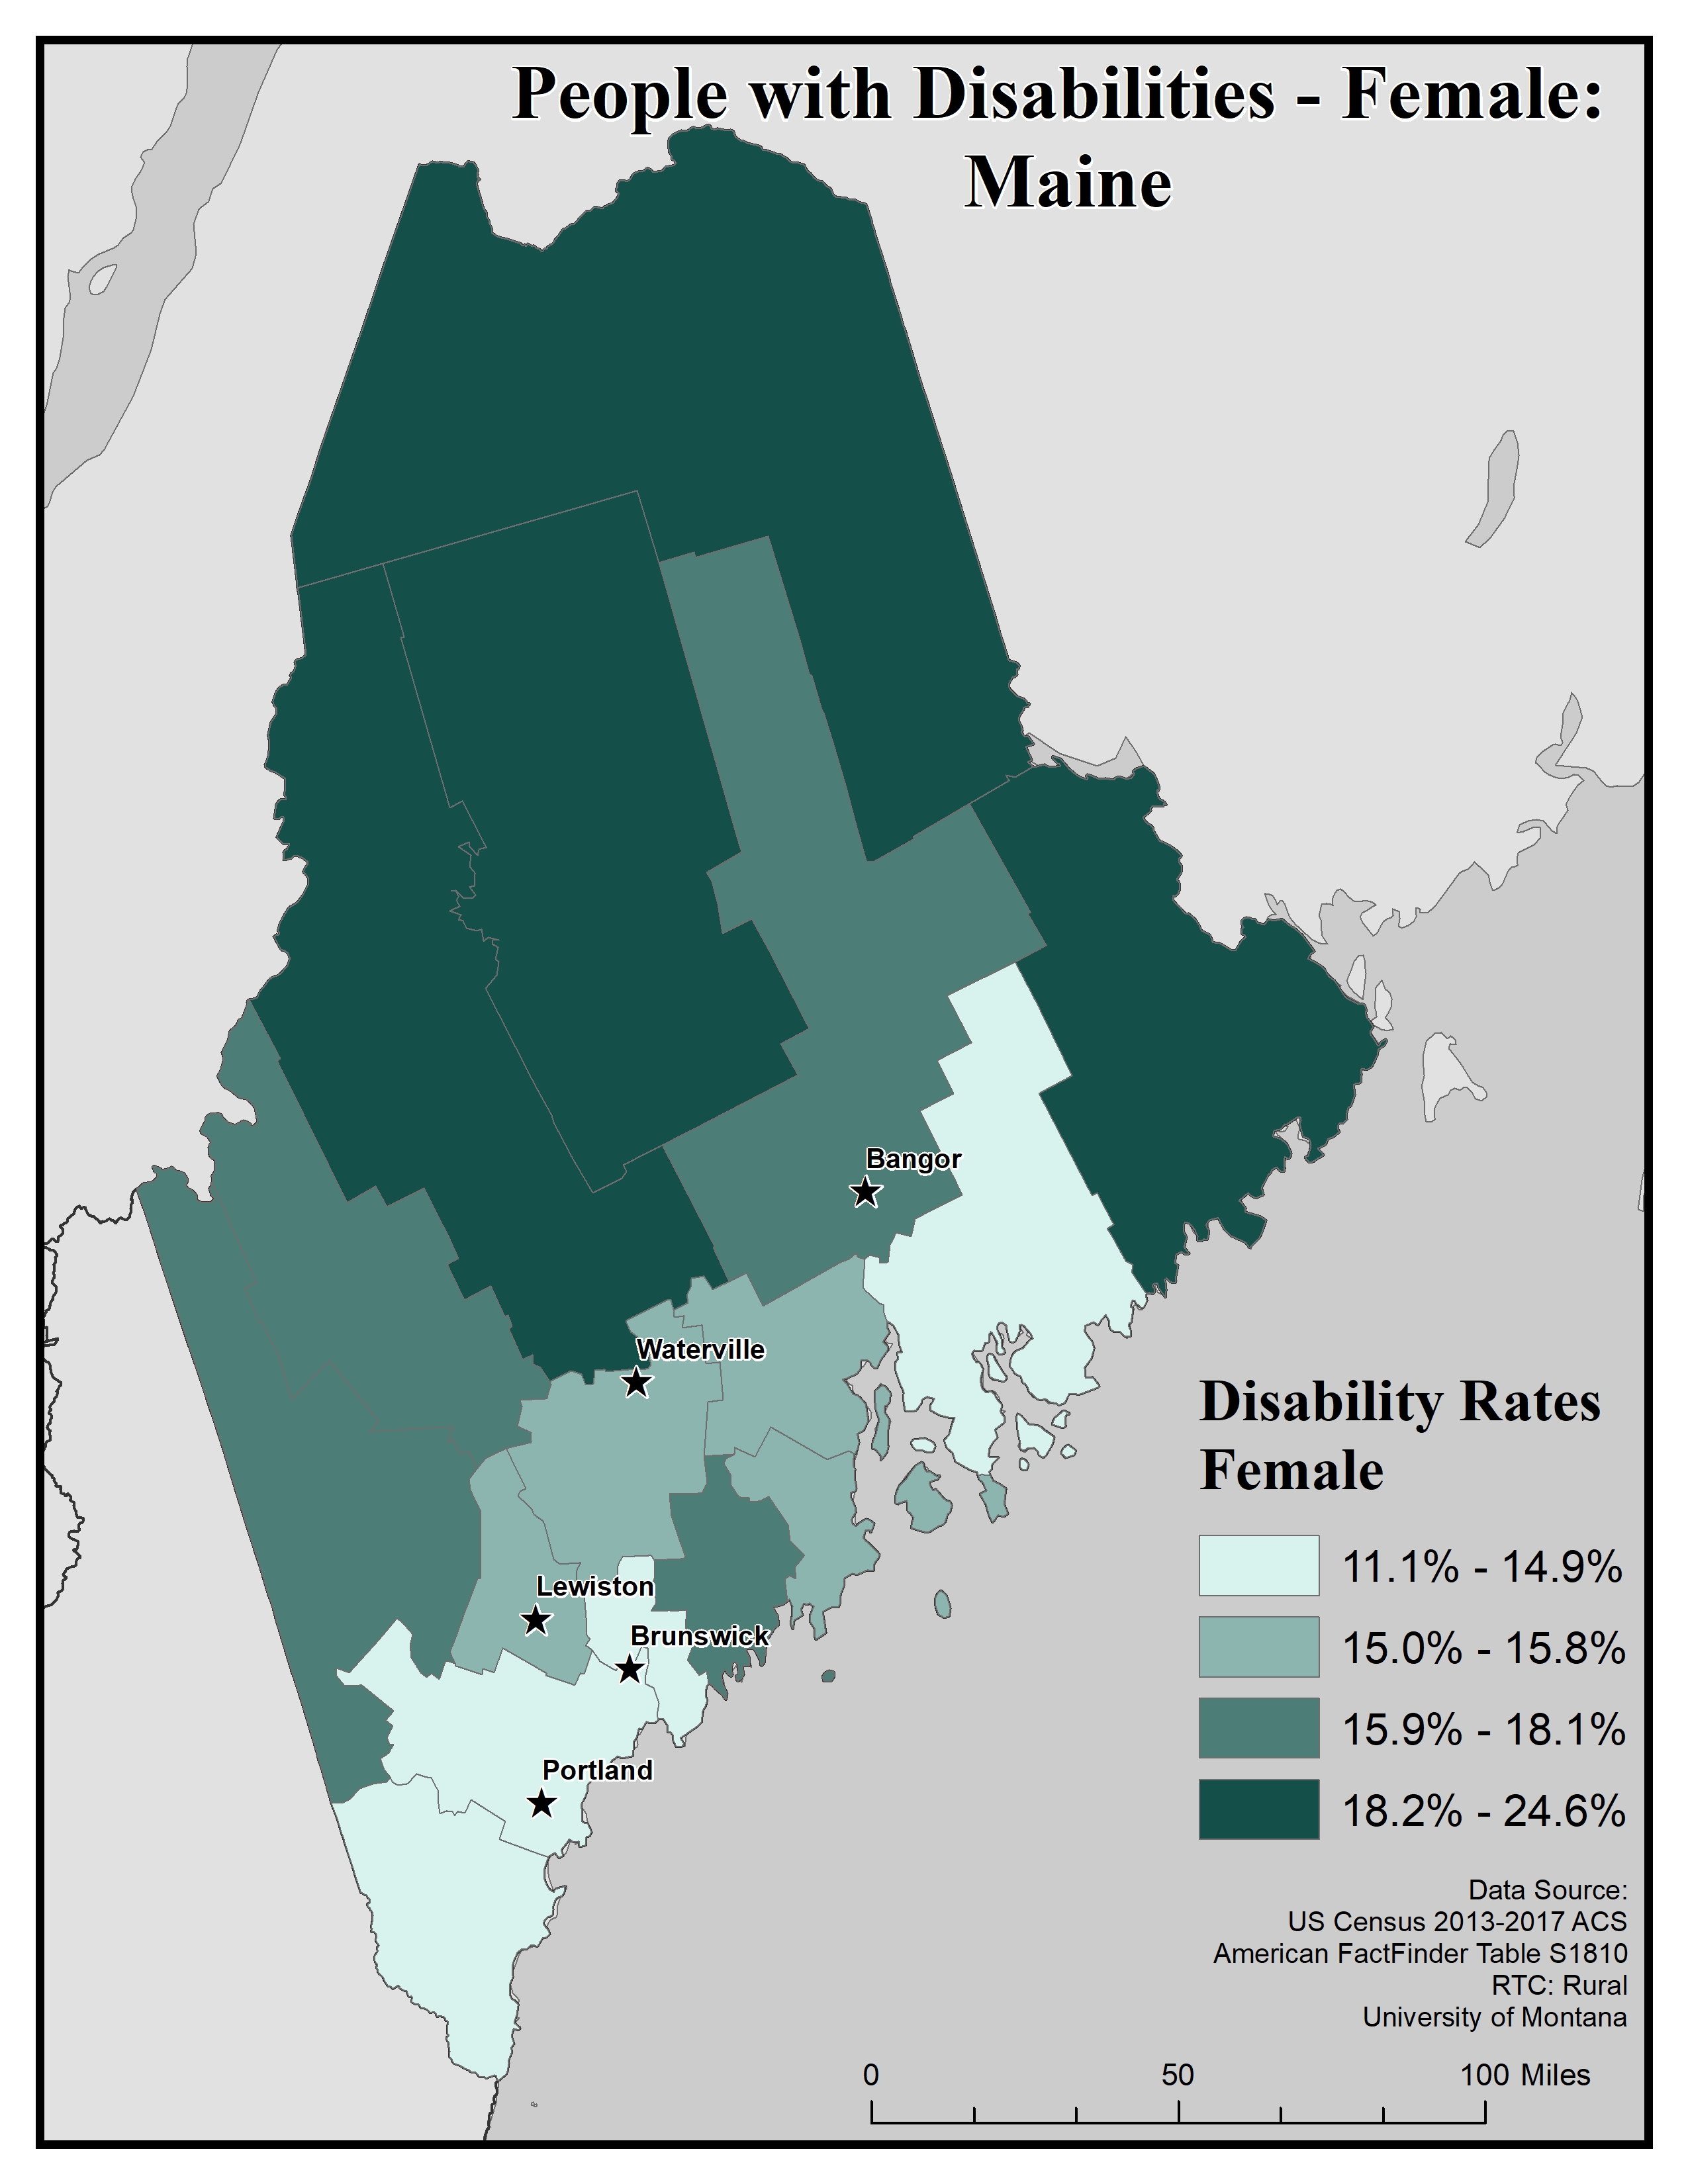
This map of the state of Maine shows disability rate among females by county. Rates are broken into four categories from 11.1 to 24.6%.
Overall, there are higher rates of females with disabilities in rural counties than in urban ones. The counties with the highest rates are grouped on the northern edge of the state.
The five largest urban areas (Bangor, Waterville, Lewiston, Brunswick and Portland) are labeled on the map to show if there are any differences between rates in urban compared to rural areas.
Bangor is in a county with the second highest rate of 15.9 to 18.1%. Waterville and Lewiston are in counties with the second lowest rate of 15.0 to 15.8%. Portland and Brunswick are in counties with the lowest rate of 11.1 to 14.9%.
Map produced February 2020 based on 2013-2017 American Community Survey data.
- Click on the map for a larger, downloadable version.
- To browse or download the data used to make this map, use our Disability Data Lookup Tool.
- For information on how biological sex is used and defined in the ACS, see “American Community Survey and Puerto Rico Community Survey 2017 Subject Definitions” page 125.
-
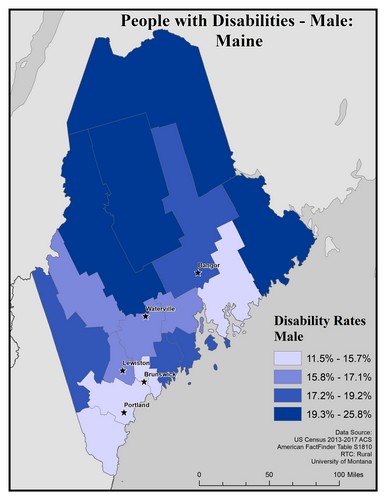
This map of the state of Maine shows disability rate among males by county. Rates are broken into four categories from 11.5 to 25.8%.
Overall, there are higher rates of males with disabilities in rural areas than in urban areas, however the county containing Bangor showed higher rates of males with disabilities than other urban areas. The counties with the highest rates of males with disabilities are grouped on the norther edge of the state.
The five largest urban areas (Bangor, Waterville, Lewiston, Brunswick and Portland) are labeled on the map to show if there are any differences between rates in urban compared to rural areas.
Bangor is in a county with the second highest rate of males with disabilities of 17.2 to 19.2%, Lewiston and Waterville are both in counties with the second lowest rates of 15.8 to 17.1%, and both Brunswick and Portland are in counties with the lowest rates of males with disabilities of 11.5 to 15.7%.
Map produced February 2020 based on 2013-2017 American Community Survey data.
- Click on the map for a larger, downloadable version.
- To browse or download the data used to make this map, use our Disability Data Lookup Tool.
- For information on how biological sex is used and defined in the ACS, see “American Community Survey and Puerto Rico Community Survey 2017 Subject Definitions” page 125.
-
This map explores the American Community Survey (ACS) 5-year data (Table S1810) on disability estimates.
The ACS asks a set of disability indicator questions to determine disability. If a respondent can answer “yes” to any disability question they are classified as having a disability. The data below are for ages 18 and over.

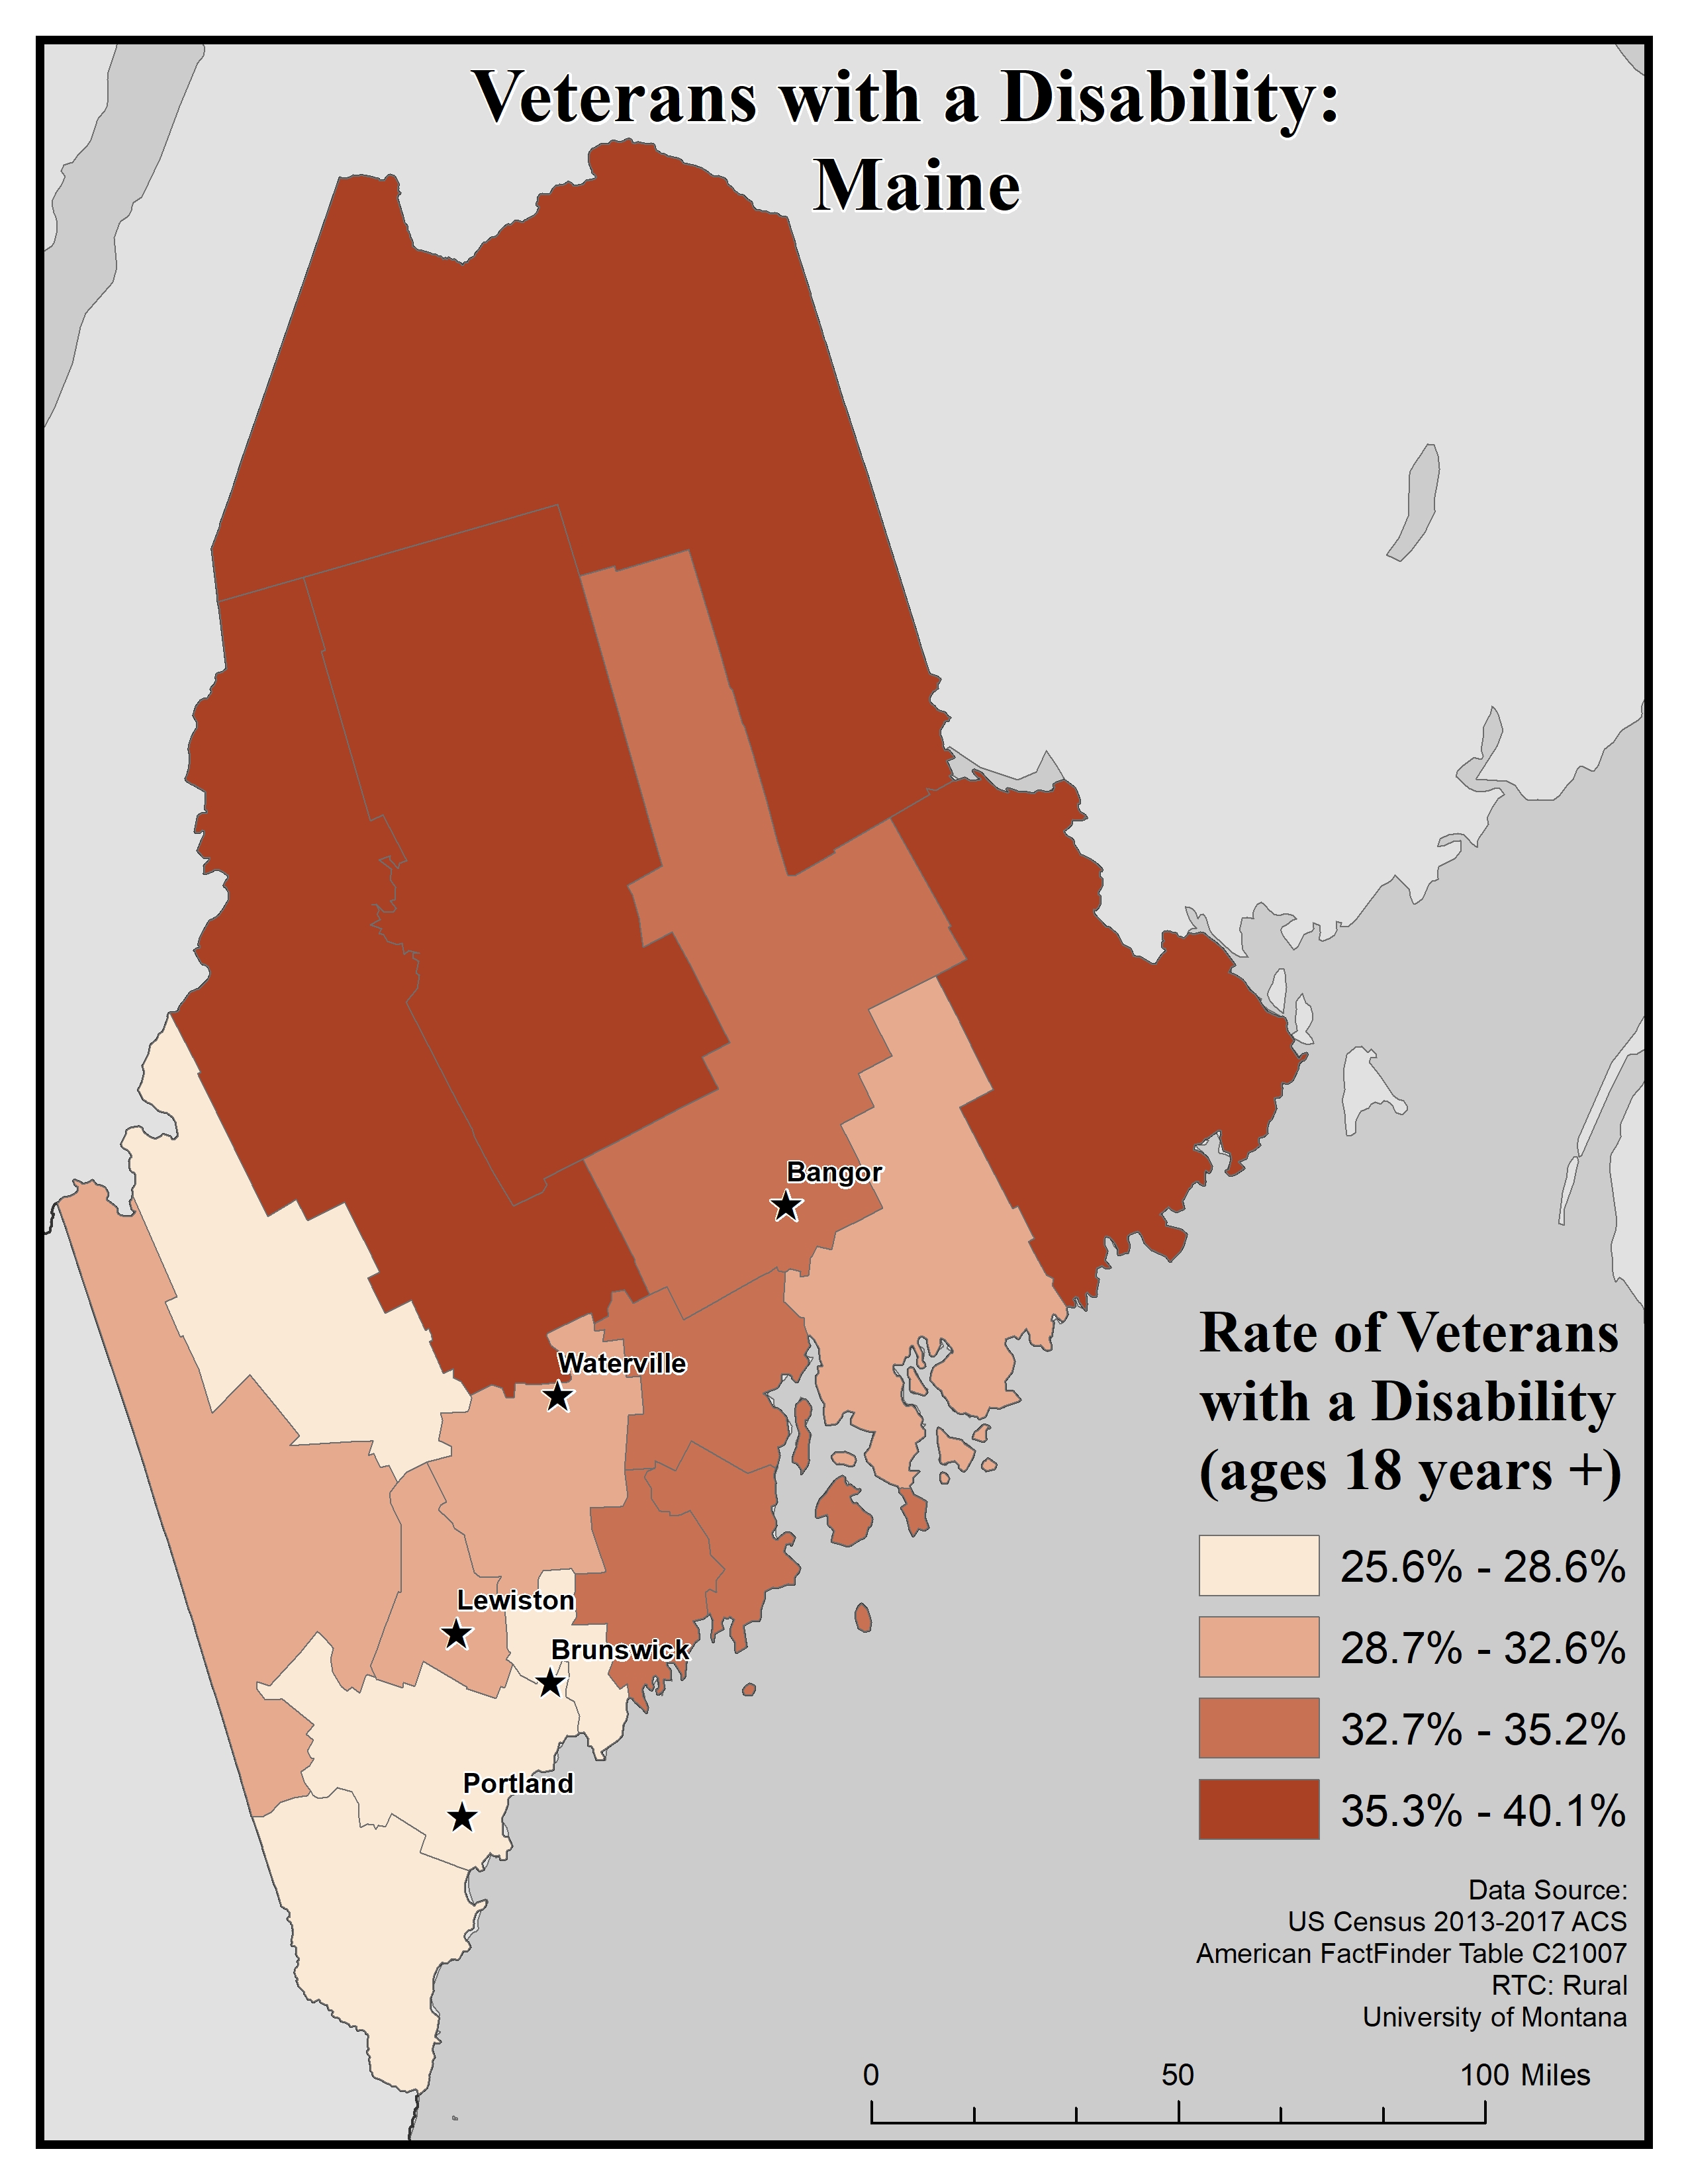
This map of the state of Maine shows rates of disability among veterans aged 18 and older by county. Rates are broken into four categories from 25.6 to 40.1%
The five largest urban areas (Bangor, Waterville, Lewiston, Brunswick and Portland) are labeled on the map to show if there are any differences between rates in urban compared to rural areas. Overall, there are higher rates of veterans with disabilities in rural counties than urban ones. Though, Bangor had higher rates than other urban areas. The counties with the greatest rates of veterans with disabilities are concentrated on the northern and eastern edges of the state
Of the five largest cities, Bangor was in a county with the highest rate of veterans with disabilities (32.7 to 35.2%), Lewiston and Waterville were both in counties with the second lowest rate (28.7 to 32.6%), and both Brunswick and Portland were in counties with the lowest rate (25.6 to 28.6%)
Map produced February 2020 based on 2013-2017 American Community Survey data.
- Click on the map for a larger, downloadable version.
- To browse or download the data used to make this map, use our Disability Data Lookup Tool.
-
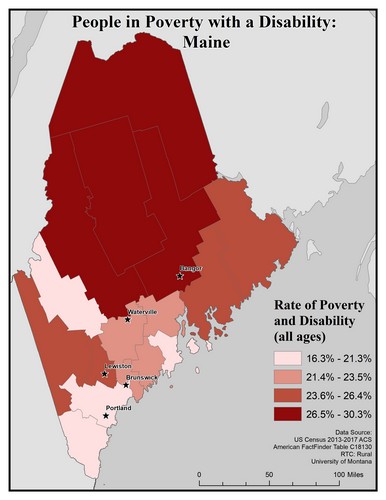
This map of the state of Maine shows poverty rates among people with disabilities of all ages by county. Poverty rates are broken into four levels from 16.3 to 30.3%.
The five largest urban areas (Bangor, Waterville, Lewiston, Brunswick and Portland) are labeled on the map to show if there are any differences between rates in urban compared to rural areas. Overall the highest poverty rates among people with disabilities were in rural counties. However, Bangor also had a poverty rate in the highest level (26.5 to 30.3%). Lewiston also showed higher rates of poverty among people with disabilities than the other three urban areas.
The counties with the highest levels of poverty among people with disabilities is grouped from the center to the northern edge of the state.
The county containing Bangor recorded the highest rate of poverty among people with disabilities of the five cities at 26.5 t o 30.3%. Lewiston recorded the second highest rate at 23.6 to 26.4%, Waterville and Brunswick recorded the second lowest at 21.4 to 23.5%, and Portland recorded the lowest at 16.3 to 21.3%.
Map produced February 2020 based on 2013-2017 American Community Survey data.
- Click on the map for a larger, downloadable version.
- To browse or download the data used to make this map, use our Disability Data Lookup Tool.


Employment: Maine
-
This map explores American Community Survey (ACS) 5-year data (Table C18120) employment estimates by disability type.
The ACS asks a set of disability indicator questions to determine disability. If a respondent can answer “yes” to any disability question they are classified as having a disability. The data below are for ages 18-64.
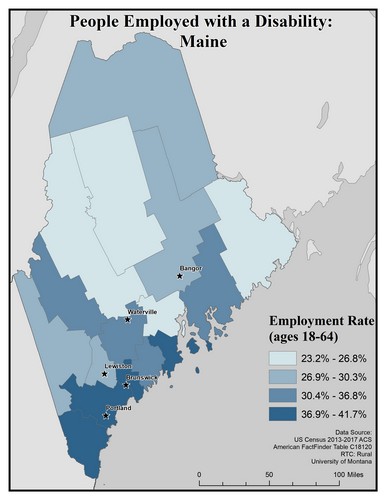
This map of Maine shows employment rates among people with disabilities. The data includes people ages 18 to 64. Rates are broken into four categories ranging from 23.2 to 41.7%
The highest rates of employment are mostly in the southeast, but there are a few other counties in the highest bracket across the state.
The five largest urban areas (Bangor, Waterville, Lewiston, Brunswick and Portland) are labeled on the map to show if there are any differences between rates in urban compared to rural areas. Minot, Grand Forks and Bismarck are in counties with the second lowest rate, 46.6% to 55.2%, while Fargo and Williston are in counties with the second highest rate of 55.3% to 59.3%.
Map produced February 2020 based on 2013-2017 American Community Survey data.
- Click on the map for a larger, downloadable version.
- To browse or download the data used to make this map, use our Disability Data Lookup Tool.
-
This map explores American Community Survey (ACS) 5-year data (Table C18120) employment estimates by disability type.
The ACS asks a set of disability indicator questions to determine disability. If a respondent can answer “yes” to any disability question they are classified as having a disability. The data below are for ages 18-64.
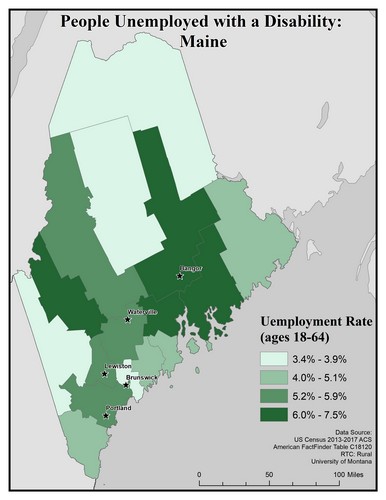
This map of Maine shows unemployment rates among people with disabilities. The data includes people ages 18 to 64. Rates are broken into four categories from 3.4 to 7.5%.
The five largest urban areas (Bangor, Waterville, Lewiston, Brunswick and Portland) are labeled on the map to show if there are any differences between rates in urban compared to rural areas. Rates are varied across the state though several of the counties in the highest bracket, 6.0 to 7.5% are in the center of the state
Bangor is in a county with the highest bracket (6.0 to 7.5%), while the other 4 largest cities are in areas in the second highest bracket (5.2 to 5.9%)
Map produced February 2020 based on 2013-2017 American Community Survey data.
- Click on the map for a larger, downloadable version.
- To browse or download the data used to make this map, use our Disability Data Lookup Tool.
-
This map explores American Community Survey (ACS) 5-year data (Table C18120) employment estimates by disability type.
The ACS asks a set of disability indicator questions to determine disability. If a respondent can answer “yes” to any disability question they are classified as having a disability. The data below are for ages 18-64.

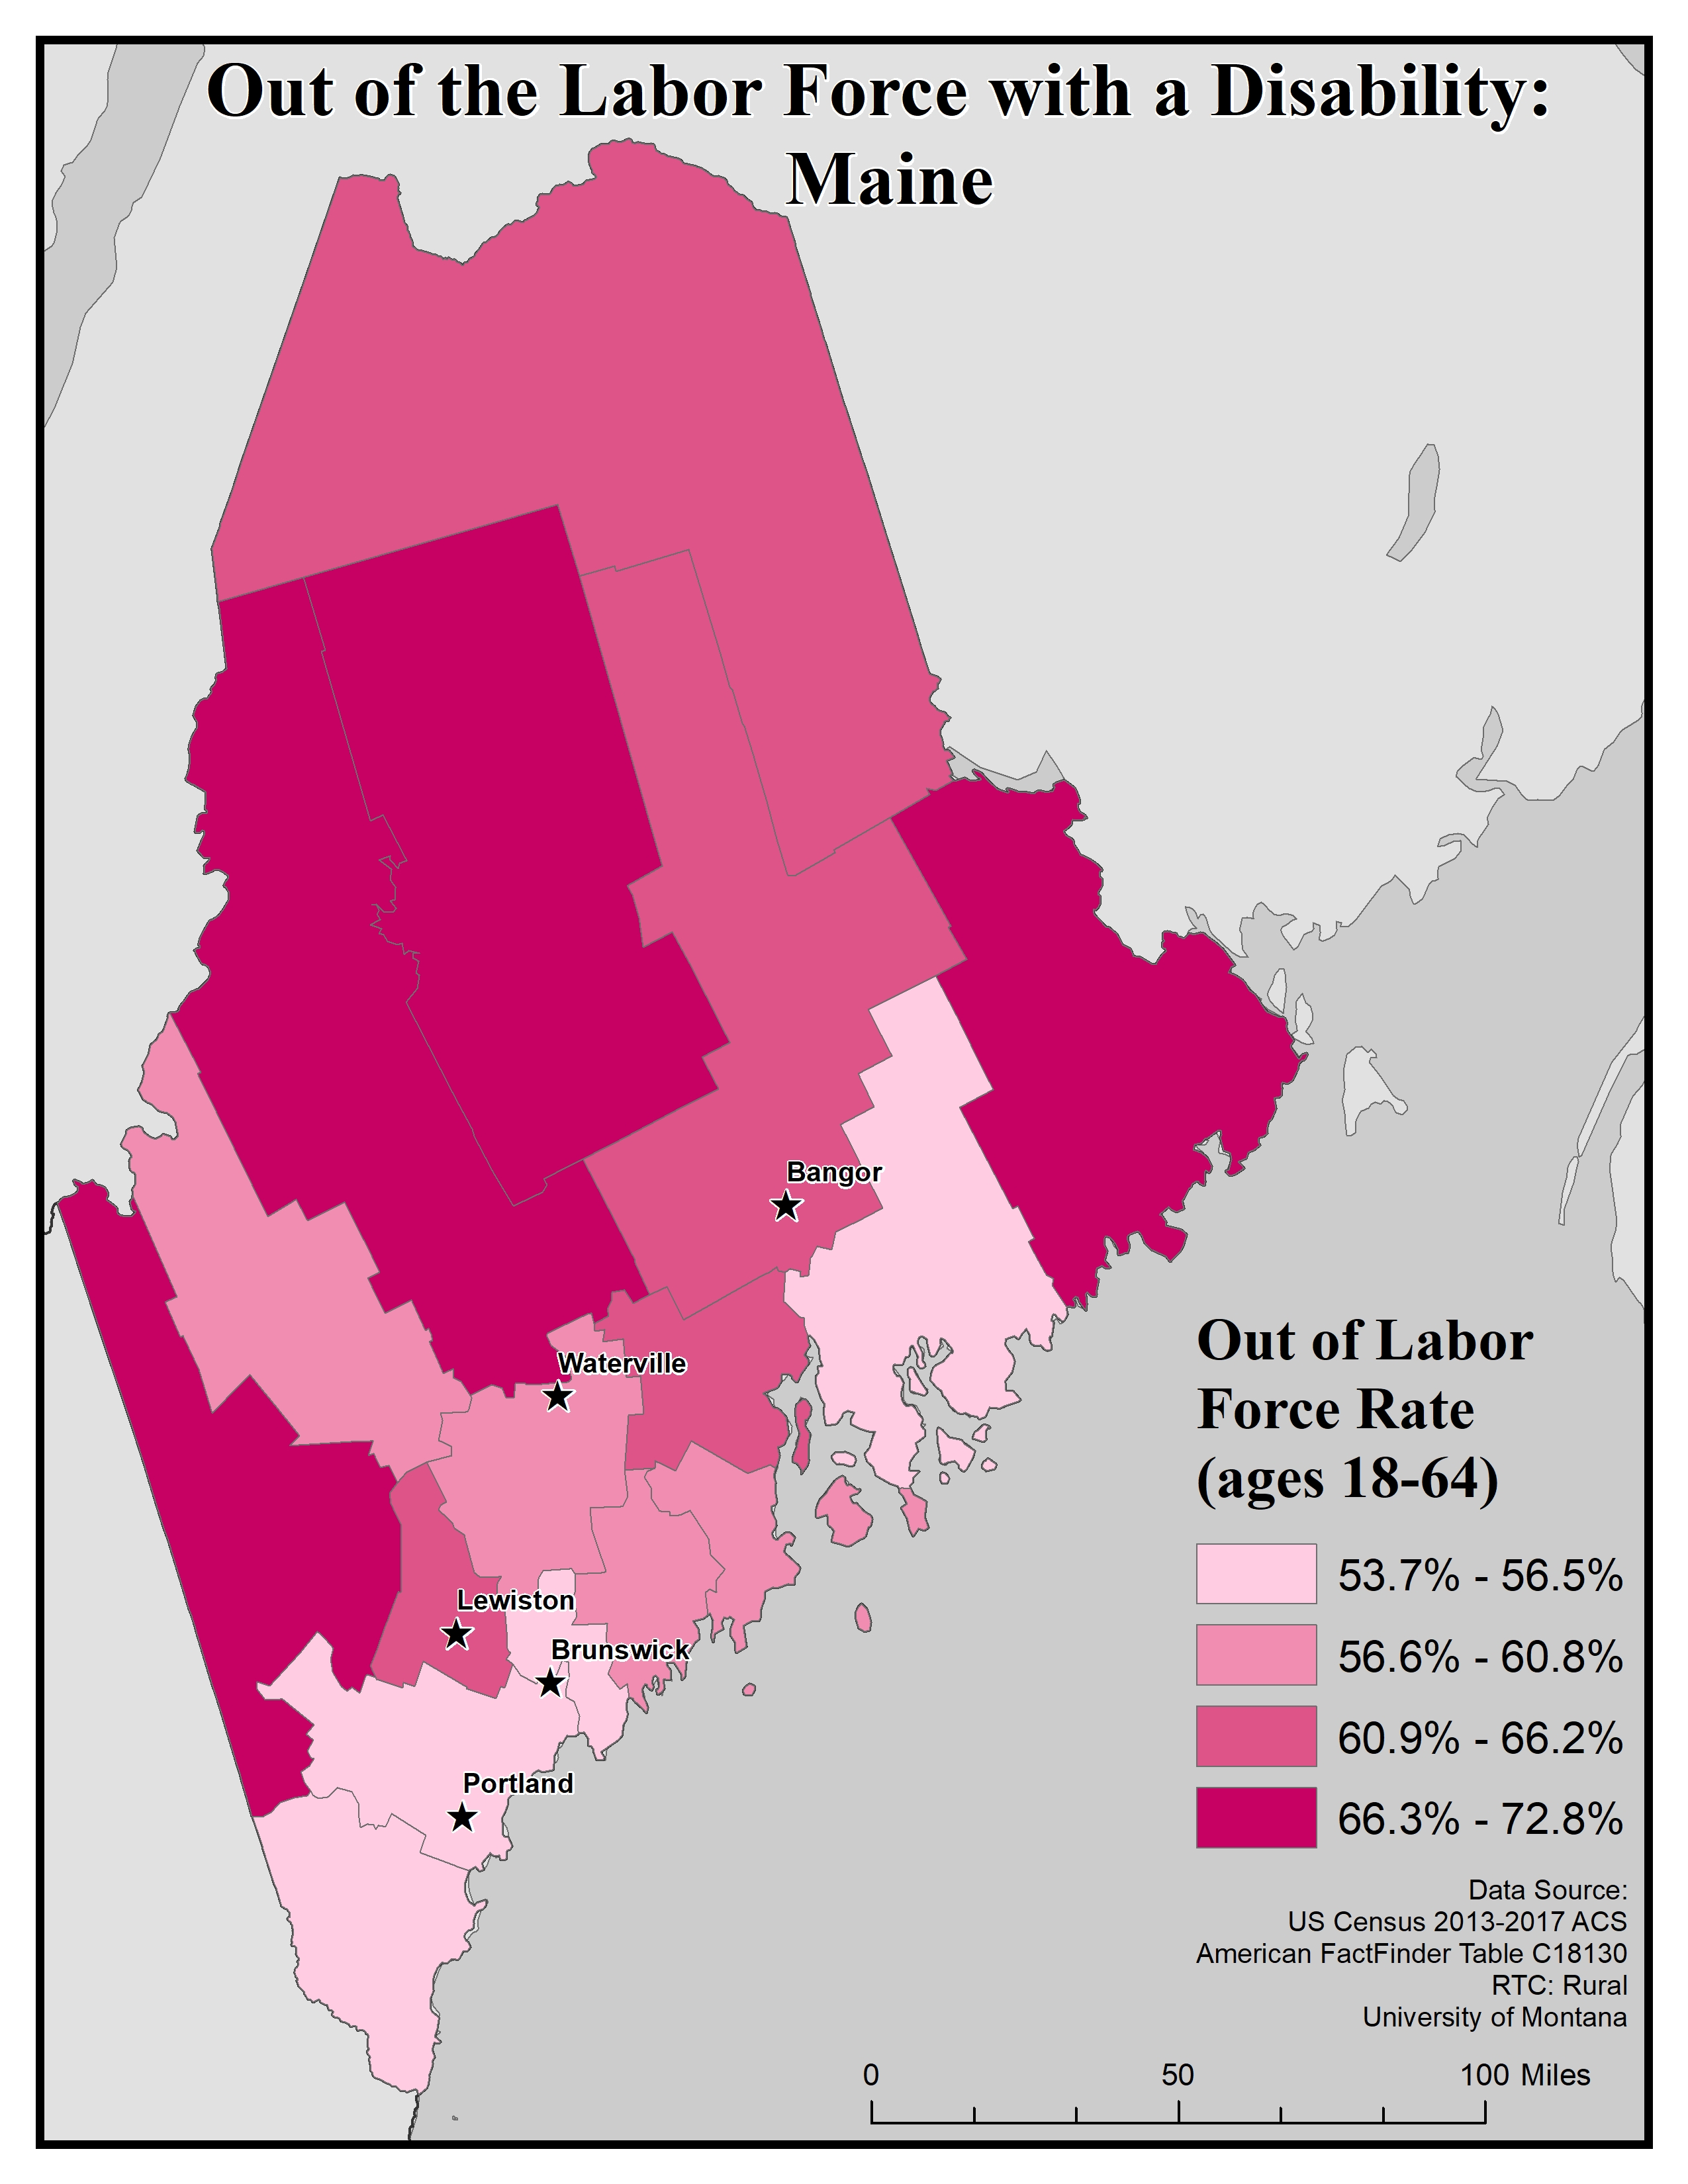
This map of Maine shows out of labor force rates among people with disabilities. The data includes people ages 18 to 64. Rates are broken into four categories from 53.7% to 72.8%.
The five largest urban areas (Bangor, Waterville, Lewiston, Brunswick and Portland) are labeled on the map to show if there are any differences between rates in urban compared to rural areas.
Rates varied across the state, however rural areas has overall higher rates of people with a disability who are out of the labor force. Additionally, the counties containing Bangor and Lewiston had higher rates than the other urban areas.
Of the five cities, Bangor and Lewiston are in the second highest bracket for out of labor force rates (60.9 to 66.2%), Waterville is in the second lowest bracket (56.6 to 60.8%), and both Brunswick and Portland are in the lowest bracket (53.7 to 56.5%).
Map produced February 2020 based on 2013-2017 American Community Survey data.
- Click on the map for a larger, downloadable version.
- To browse or download the data used to make this map, use our Disability Data Lookup Tool.


Disability Rates by Functional Limitation: Maine
-
This map explores the American Community Survey (ACS) 5-year data (Table S1810) on disability estimates by county.
For vision difficulty the ACS asks if a respondent is blind or has serious difficulty seeing, even when wearing glasses. If they answer “yes” they are classified as having a vision difficulty. This data is for all ages.
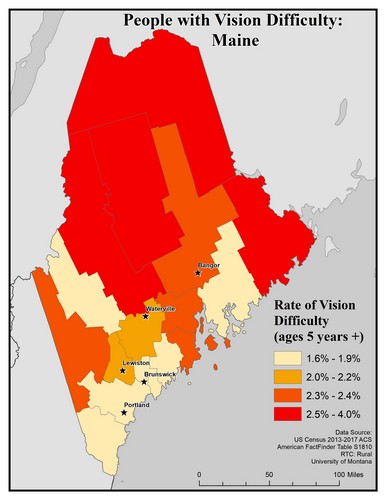
This map of the state of Maine shows rates of people with vision difficulty for ages 5 and older by county. Rates are broken into four categories from 1.6 to 4.0%.
The five largest urban areas (Bangor, Waterville, Lewiston, Brunswick and Portland) are labeled on the map to show if there are any differences between rates in urban compared to rural areas. Overall, rural counties have higher rates of people with vision difficulty (5 years of age and older) than urban ones, however the county containing Bangor has higher rates than other urban areas.
The majority of counties with the highest rates of people with vision difficulty are on the Northern edge of the state, with one county on the eastern edge.
Bangor is in a county containing the second highest rate of people with vision difficulty (2.3 to 2.4%), while Waterville and Lewiston are in counties with the second lowest rate (2.0 to 2.2%), and both Brunswick and Portland are in counties with the lowest rate of people with vision difficulty (1.6 to 1.9%)
Map produced February 2020 based on 2013-2017 American Community Survey data.
- Click on the map for a larger, downloadable version.
- To browse or download the data used to make this map, use our Disability Data Lookup Tool.
-
This map explores the American Community Survey (ACS) 5-year data (Table S1810) on disability estimates by county.
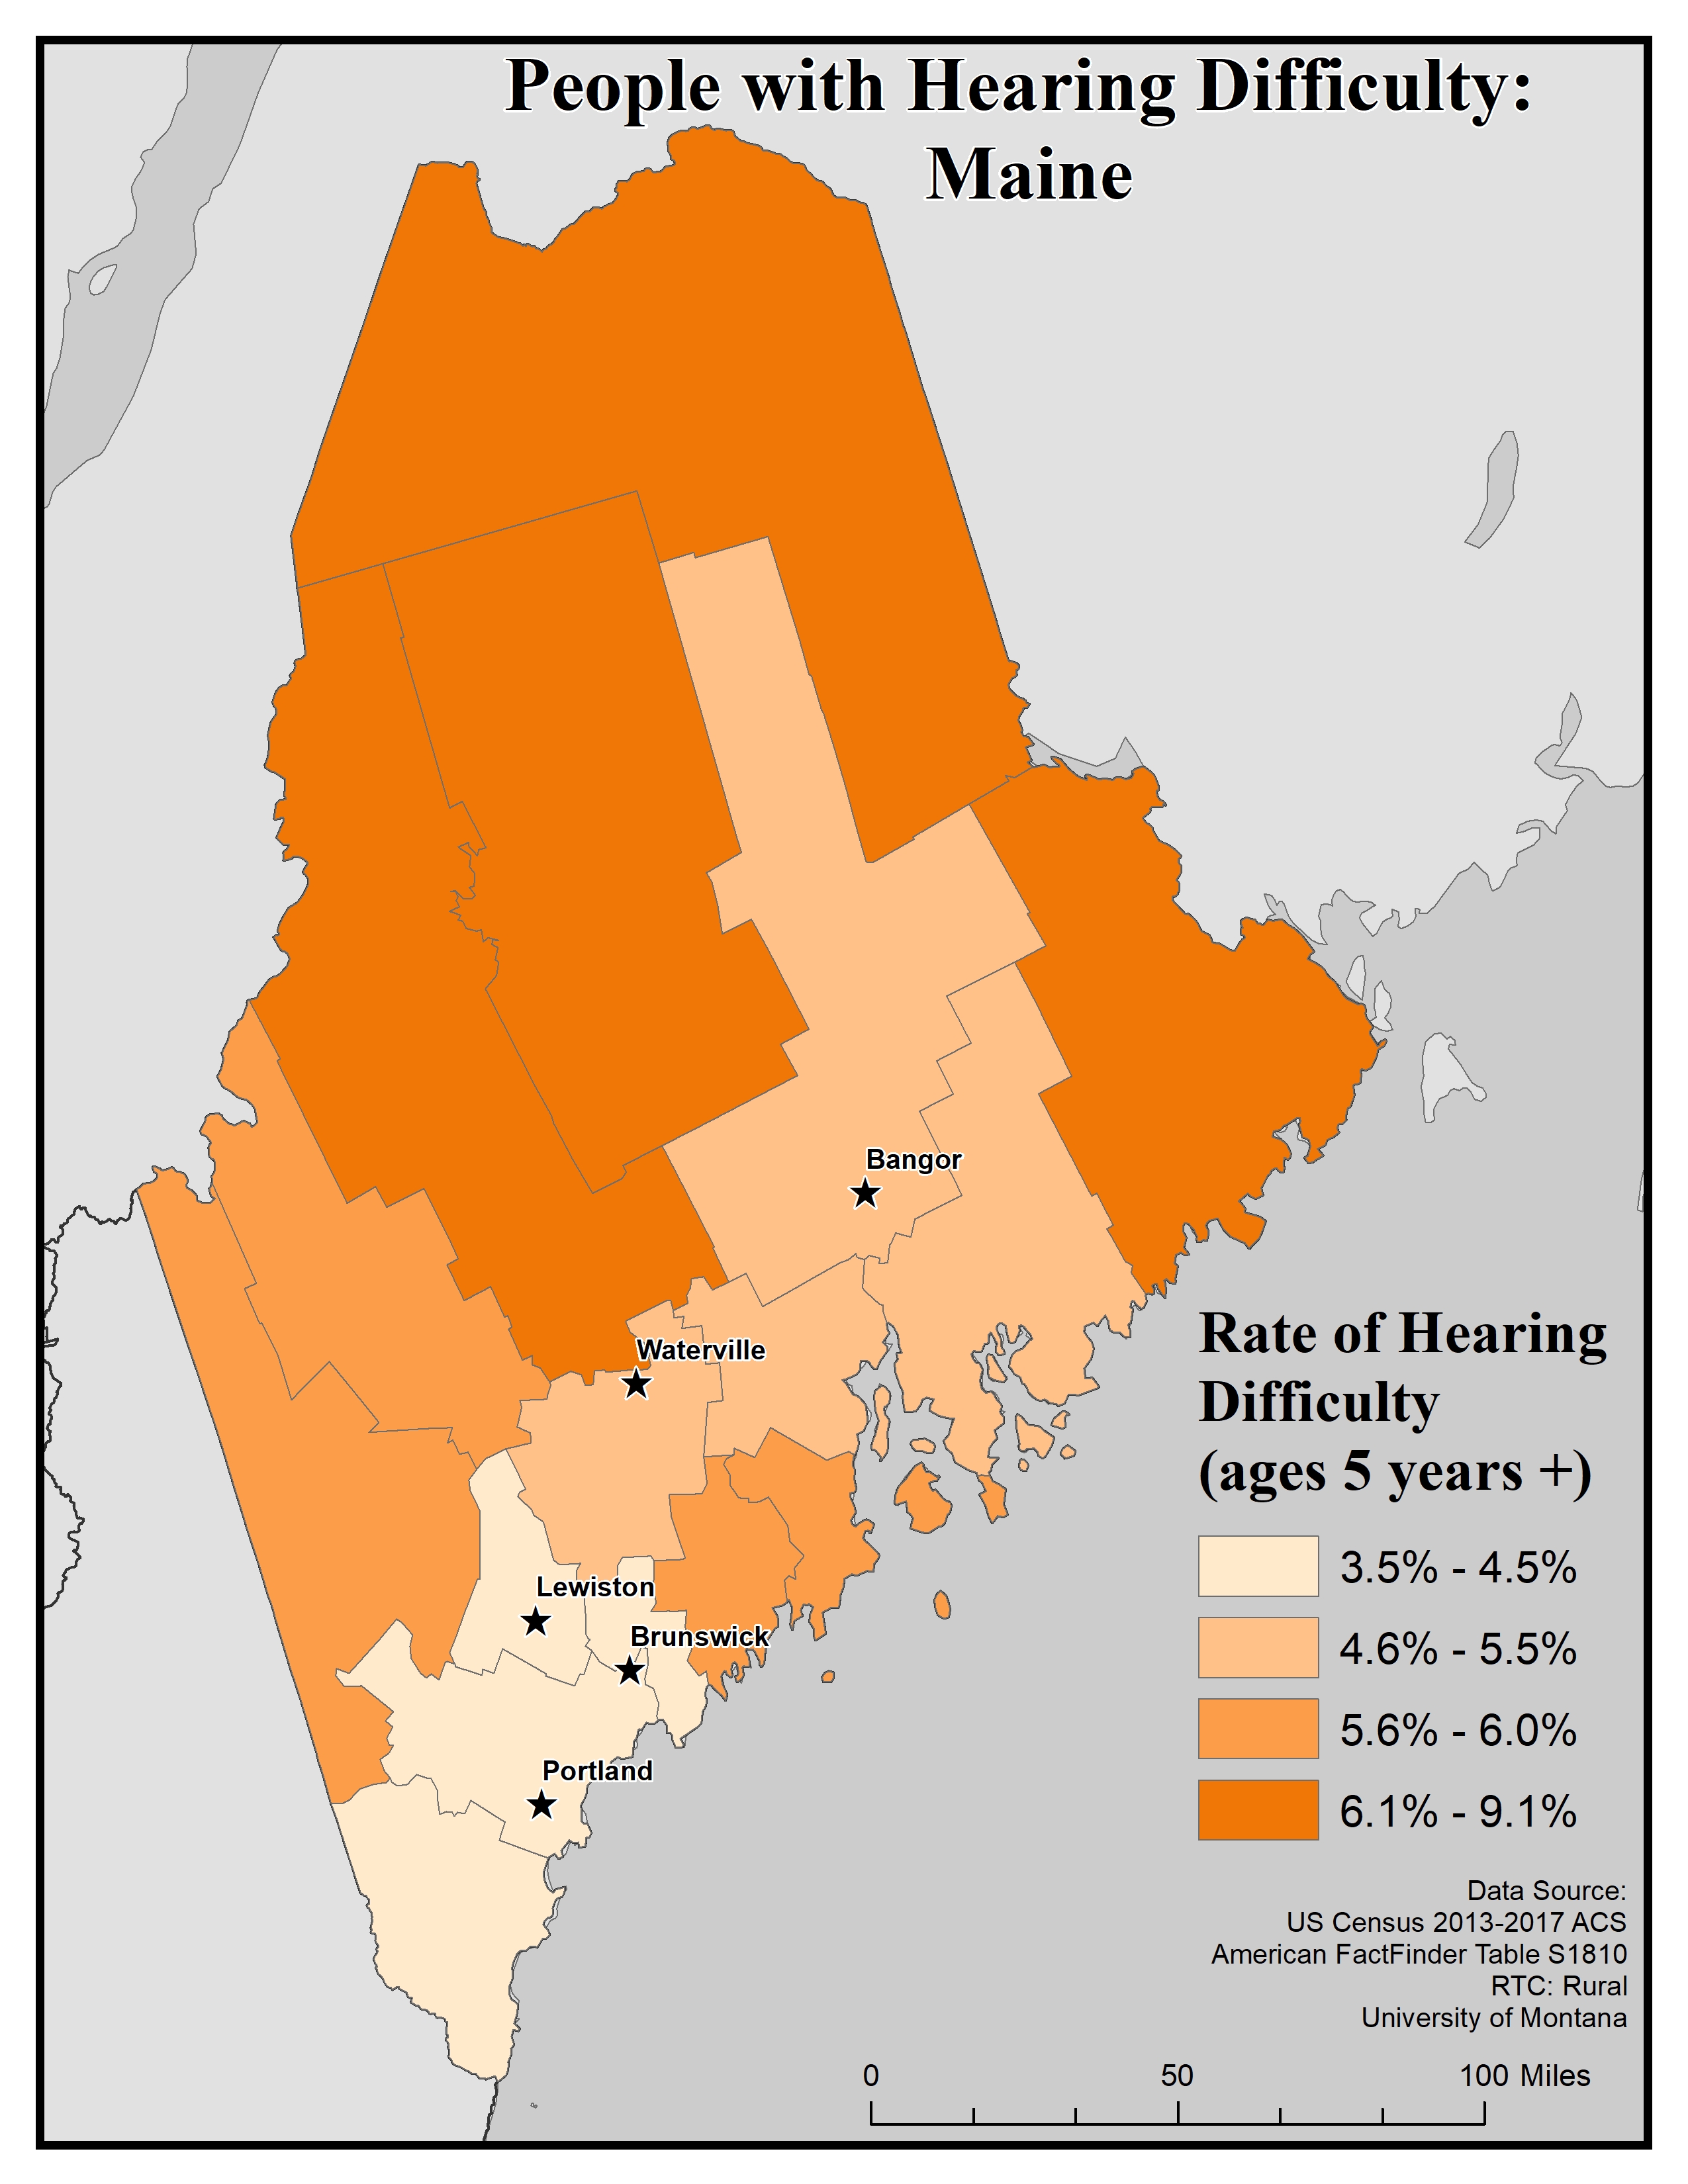
For hearing difficulty the ACS asks if a respondent is deaf or has serious difficulty hearing. If they answer “yes” they are classified as having a hearing difficulty. This data is for all ages.

This map of the state of Maine shows rates of people with hearing difficulty for ages 5 and older by county. Rates are broken into four categories from 3.5 to 9.1%.
Overall, there are higher rates of people with hearing difficulty (ages 5 and older) in rural counties than in urban ones. Counties with the highest rates of people with hearing difficulty are grouped on the northern edge of the state.
The five largest urban areas (Bangor, Waterville, Lewiston, Brunswick and Portland) are labeled on the map to show if there are any differences between rates in urban compared to rural areas.
Bangor and Waterville are in counties with the second lowest rate of 4.6 to 5.5%, while Lewiston, Brunswick, and Portland are all in counties with the lowest rate of 3.5 to 4.5%.
Map produced February 2020 based on 2013-2017 American Community Survey data.
- Click on the map for a larger, downloadable version.
- To browse or download the data used to make this map, use our Disability Data Lookup Tool.
-
This map explores the American Community Survey (ACS) 5-year data (Table S1810) on disability estimates by county.
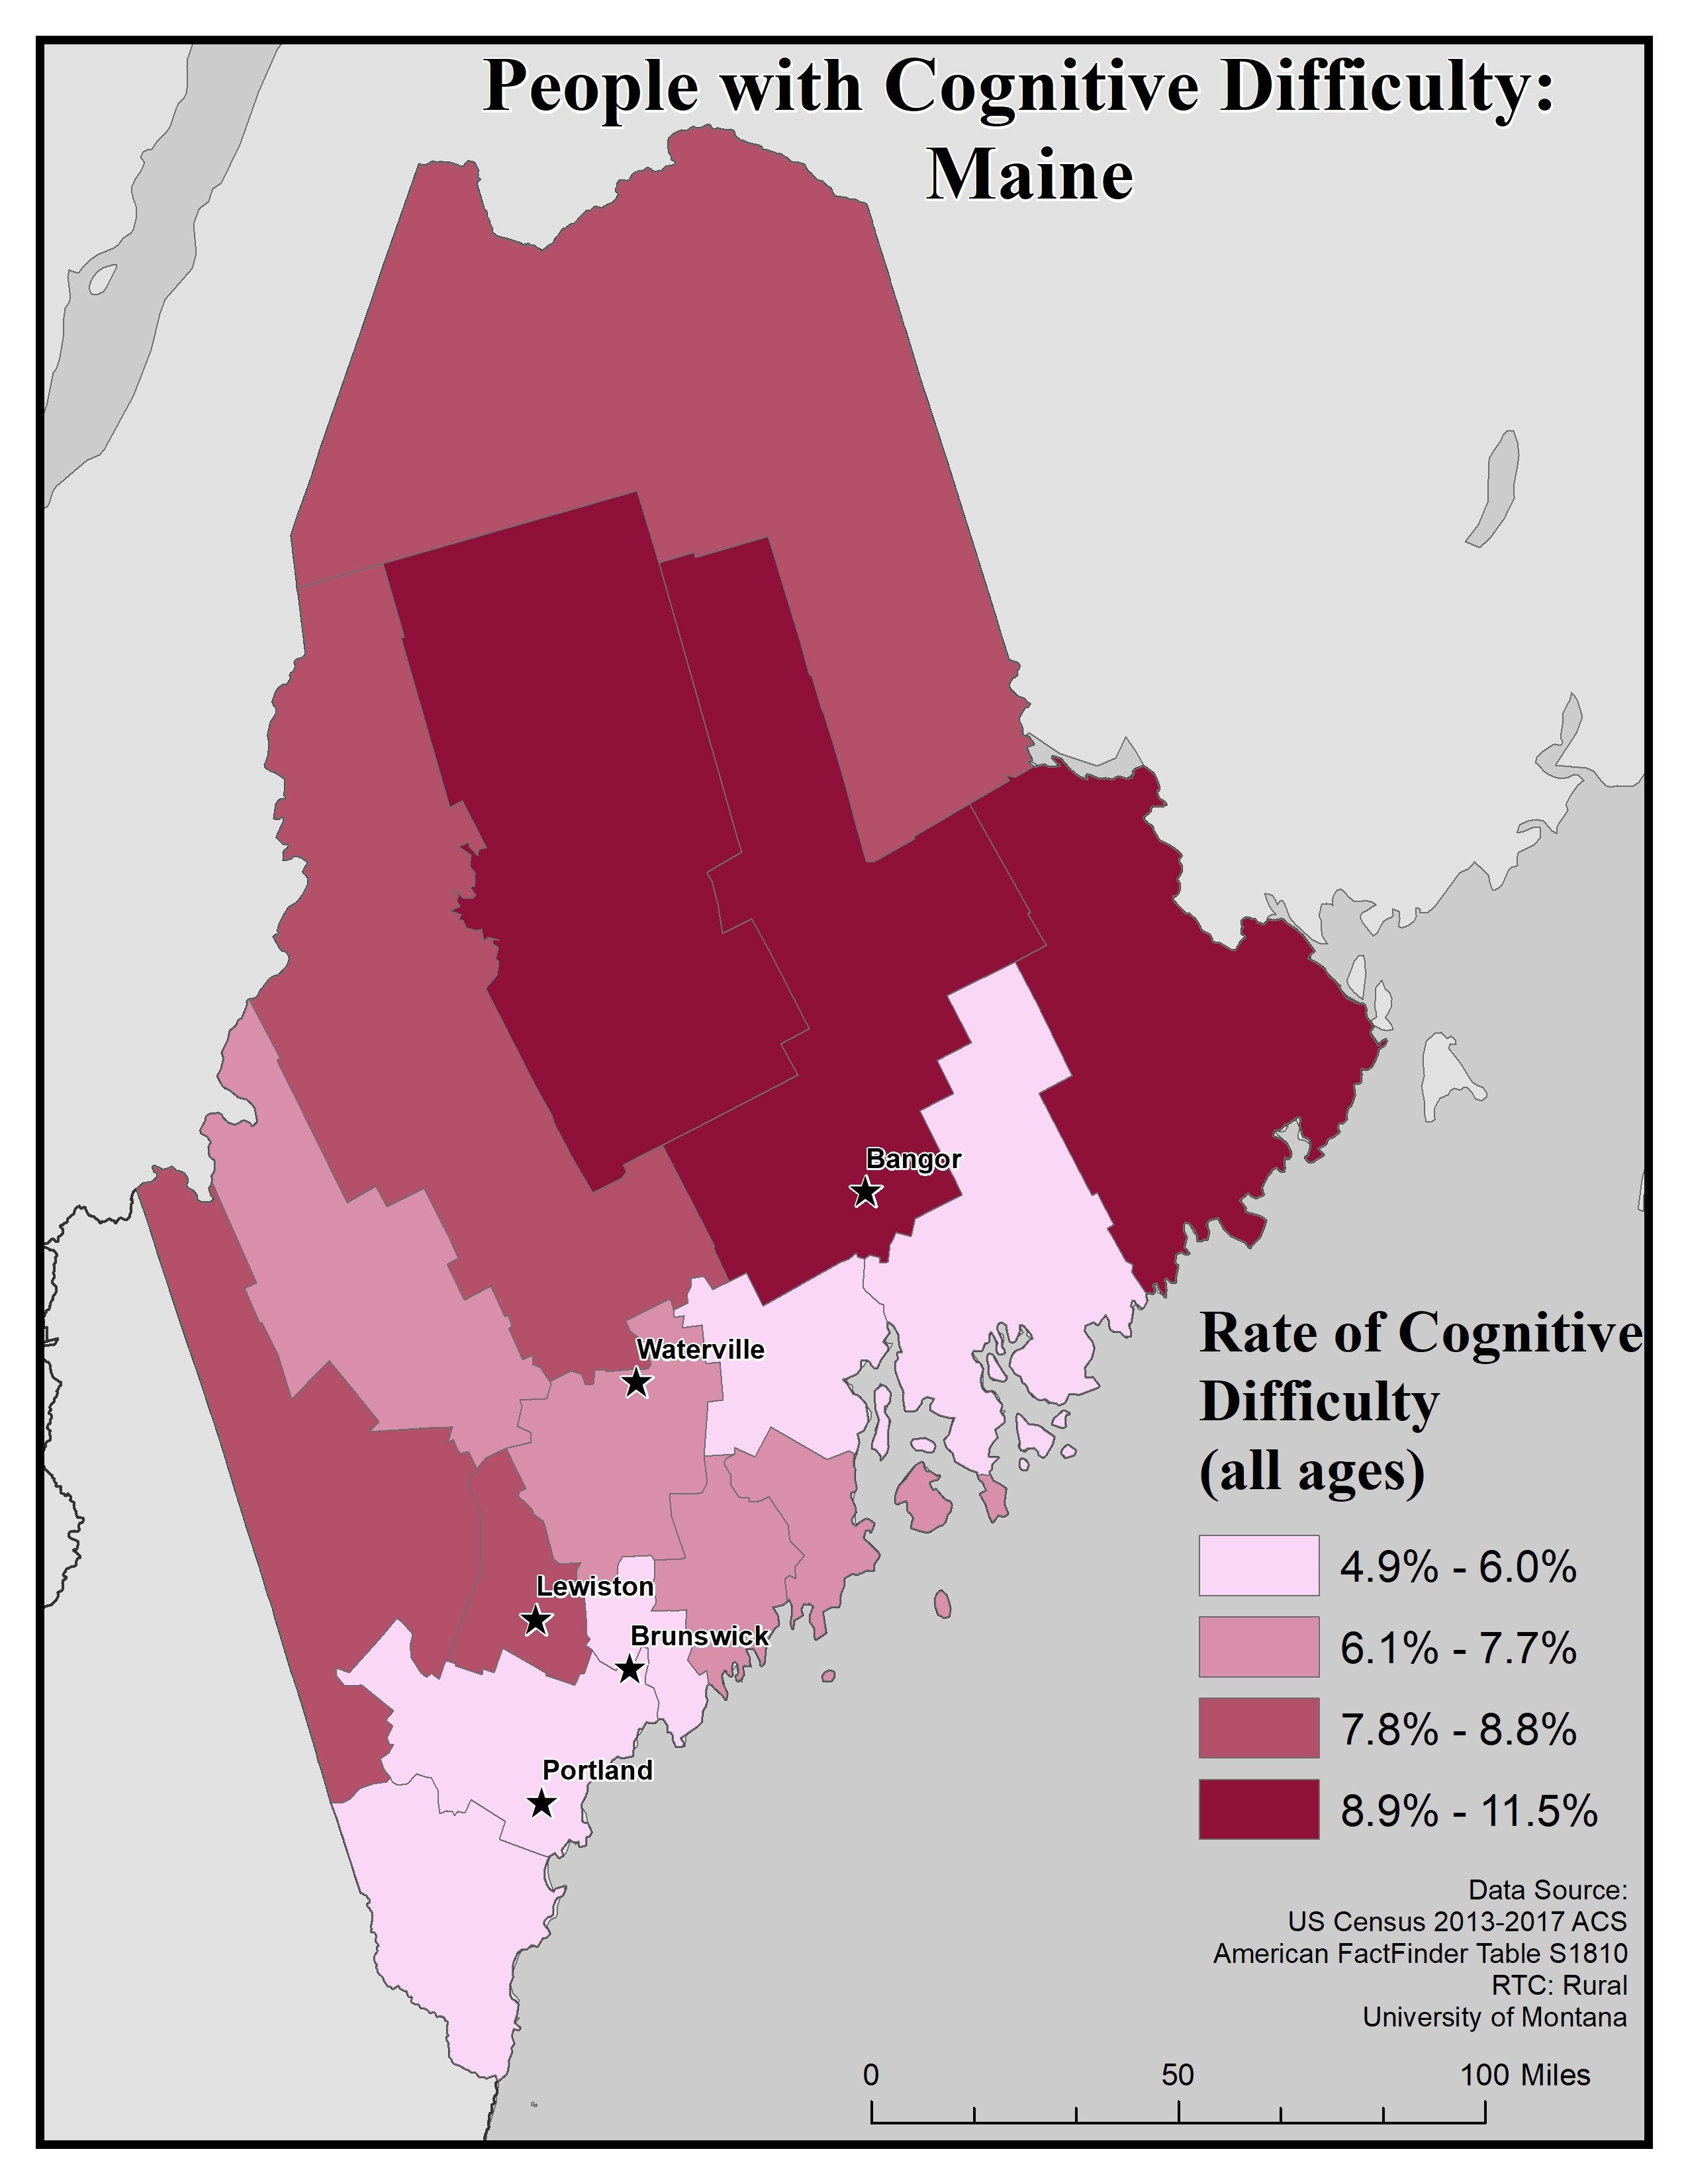
For cognitive difficulty the ACS asks because of a physical, mental, or emotional problem, does the respondent have difficulty remembering, concentrating, or making decisions. If they answer “yes” they are classified as having a cognitive difficulty. This data is for ages 5 and up.

This map of the state of Maine shows rates of people with cognitive difficulty by county. Rates are broken into four categories from 4.9 and 11.5%.
The five largest urban areas (Bangor, Waterville, Lewiston, Brunswick and Portland) are labeled on the map to show if there are any differences between rates in urban compared to rural areas. Overall, rates of people with cognitive difficulty varied throughout the state, with the highest rates occurring in the center of the state, in the county containing Bangor and two counties adjacent to that county.
Bangor is in a county containing the highest rate of people with cognitive difficulties (8.9 to 11.5%). Lewiston is in a county with the second highest rate of people with cognitive difficulties (7.8 to 8.8%), and Waterville is in a county with the second lowest rate (6.1 to 7.7%). Both Portland and Brunswick are in counties with the lowest rates (4.9 to 6.0%).
Map produced February 2020 based on 2013-2017 American Community Survey data.
- Click on the map for a larger, downloadable version.
- To browse or download the data used to make this map, use our Disability Data Lookup Tool.
-
This map explores the American Community Survey (ACS) 5-year data (Table S1810) on disability estimates by county.
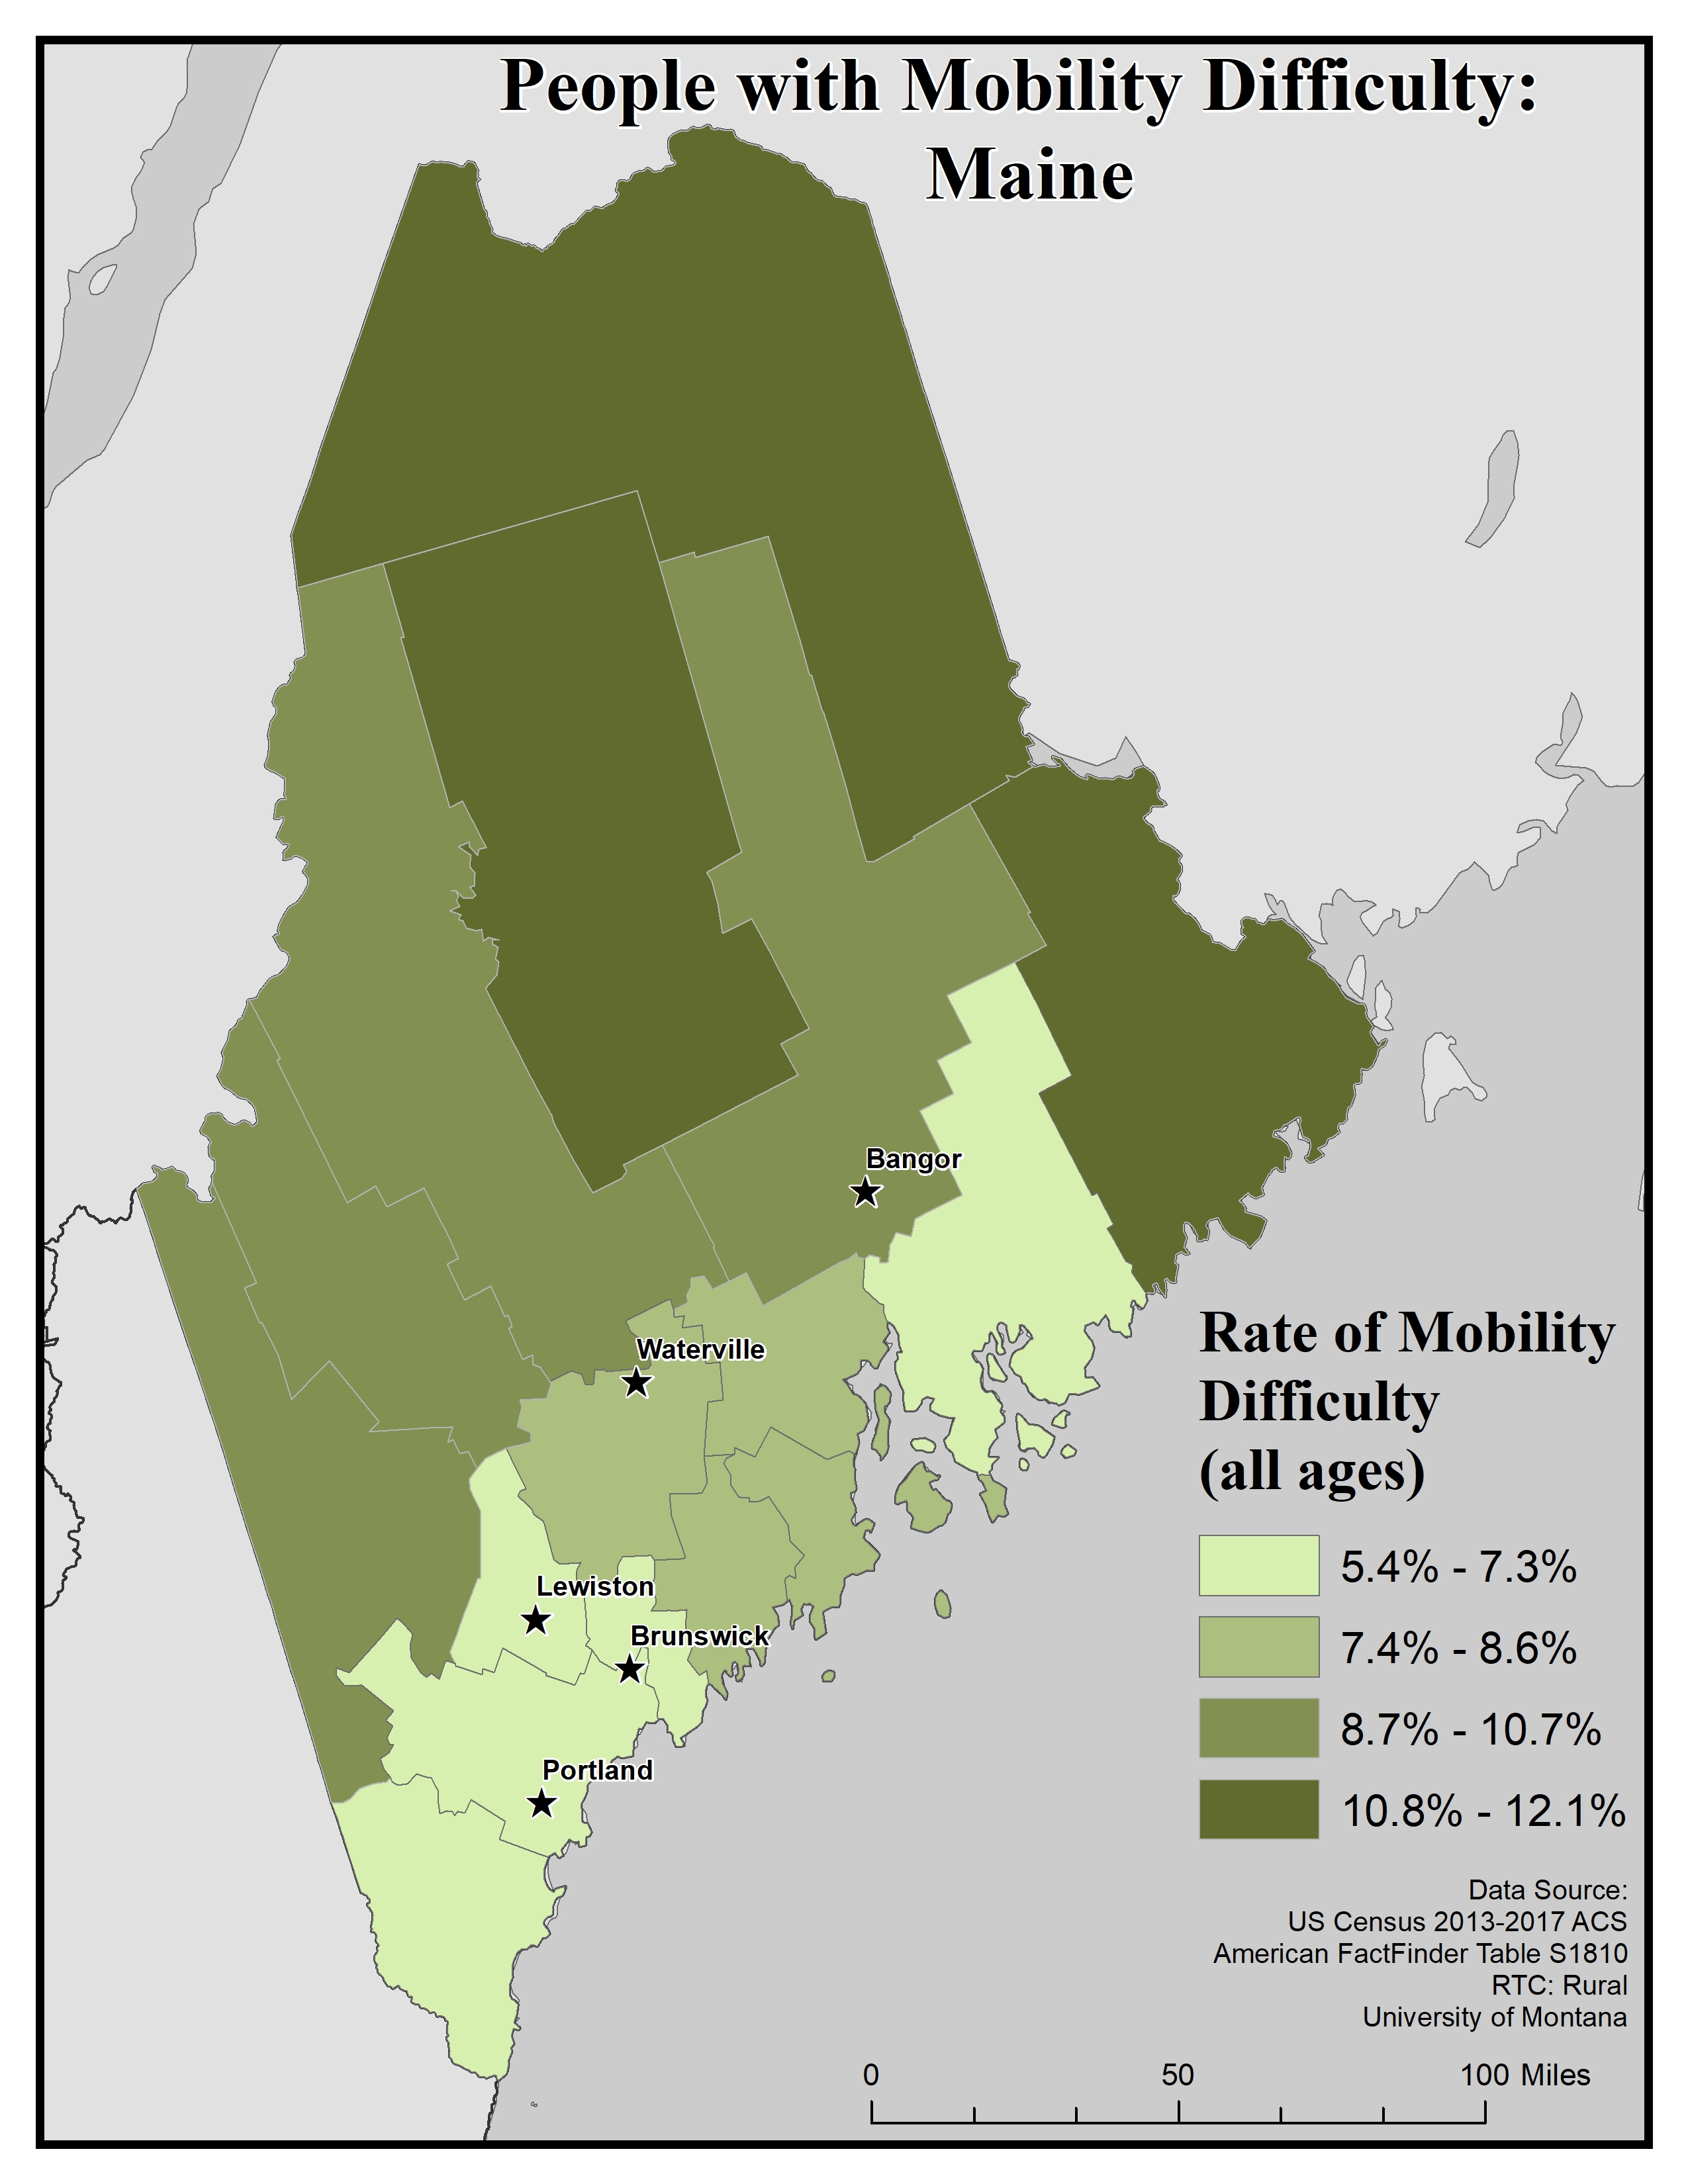
For ambulatory (i.e. mobility) difficulty the ACS asks if a respondent has serious difficulty walking or climbing stairs. If they answer “yes” they are classified as having a mobility difficulty. This data is for ages 5 and up.
 This map of the state of Maine shows rates of people with mobility difficulty for all ages by county. Rates are broken into four categories from 5.4 to 12.1%.
The five largest urban areas (Bangor, Waterville, Lewiston, Brunswick and Portland) are labeled on the map to show if there are any differences between rates of people with mobility difficulty in urban compared to rural areas
Overall, there are higher rates of mobility difficulty in rural counties than in urban ones, however the county containing Bangor has higher rates of people with mobility difficulty than other urban areas. Counties with the highest rates of people with mobility difficulty are grouped on the northern and eastern edges of the state.
Bangor is in a county with the second highest rate of people with mobility difficulty (8.7 to 10.7%), while Waterville is in a county with the second lowest rate (7.4 to 8.6%). Lewiston, Brunswick, and Portland are located in counties with the lowest rate of people with mobility difficulty (5.4 to 7.3%).
Map produced February 2020 based on 2013-2017 American Community Survey data.
- Click on the map for a larger, downloadable version.
- To browse or download the data used to make this map, use our Disability Data Lookup Tool.
-
This map explores the American Community Survey (ACS) 5-year data (Table S1810) on disability estimates by county.
For self-care difficulty the ACS asks if a respondent has difficulty bathing or dressing. If they answer “yes” they are classified as having a self-care difficulty. This data is for ages 5 and up.
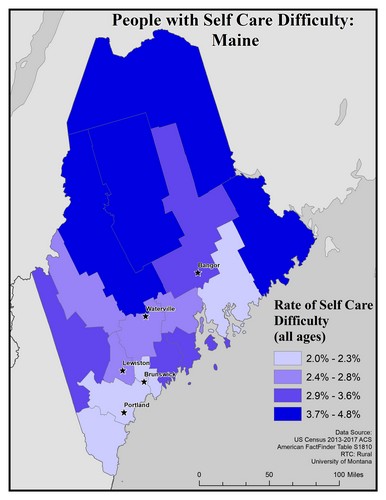
This map of the state of Maine shows rates of people with self care difficulty by county. Rates are broken into four categories from 2.0 to 4.8%.
The five largest urban areas (Bangor, Waterville, Lewiston, Brunswick and Portland) are labeled on the map to show if there are any differences between rates in urban compared to rural areas. Overall, there are higher rates of cognitive difficulty in rural counties than in urban ones, though the county in which Bangor is located has higher rates of people with self care difficulty than other urban areas.
The counties with the highest rates of people with self care difficulties are located on the northern and eastern edge of the map.
Bangor is in a county with the second highest rate of people with self care difficulty (2.9 to 3.6%), both Waterville and Lewiston are in counties with the second lowest rates (2.4 to 2.8%), and Brunswick and Portland are in counties with the lowest rates (2.0 to 2.3%).
Map produced February 2020 based on 2013-2017 American Community Survey data.
- Click on the map for a larger, downloadable version.
- To browse or download the data used to make this map, use our Disability Data Lookup Tool.
-
This map explores the American Community Survey (ACS) 5-year data (Table S1810) on disability estimates by county.
For independent living difficulty the ACS asks because of a physical, mental, or emotional problem, does the respondent have difficulty doing errands alone such as visiting a doctor’s office or shopping. If they answer “yes” they are classified as having an independent living difficulty. This data is for ages 18 and up.
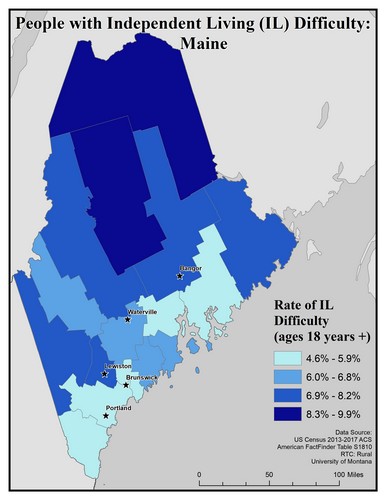
This map of the state of Maine shows rates of independent living (IL) difficulty for people 18 years of age and older by county. Rates are broken into four categories from 4.6 to 9.9%.
The five largest urban areas (Bangor, Waterville, Lewiston, Brunswick and Portland) are labeled on the map to show if there are any differences between rates of people with independent living difficulty in urban compared to rural areas. Rates of people with independent living difficulty varied throughout the state, with the highest rates concentrated at the northern edge of the state Bangor and Lewiston showed higher rates of independent living difficulty than other urban areas.
Of the five cities, Bangor and Lewiston were in counties with the second highest rate of independent living difficulty (6.9 to 8.2%). Waterville was in a county with the second lowest rate of independent living difficulty (6.0 to 6.8%), and both Brunswick and Portland were in counties with the lowest rate (4.6 to 5.9%).
Map produced February 2020 based on 2013-2017 American Community Survey data.
- Click on the map for a larger, downloadable version.
- To browse or download the data used to make this map, use our Disability Data Lookup Tool.