
CRP Statistics and Trends
About This Data
We're changing how we share CRP case data. Instead of publishing one year at a time, this page now shows Fiscal Years 2022 through 2026 side by side, so you can see how things have changed over time instead of just a single snapshot.
Before pulling these numbers together, we went back through the underlying case-by-case records and checked every figure by hand, rather than simply reusing what had been published in past annual reports. That process caught and fixed a handful of inconsistencies — the kind that happen naturally when data is entered by different people, in different systems, over several years — so the numbers you see here reflect one consistent, accurate way of counting across all five years.
A rise or fall in the number of cases from one year to the next can reflect a real change in what's happening on campus, but it can also reflect other factors — how comfortable people feel coming forward, changes in reporting requirements, or shifts in awareness of available resources. This data can't tell us on its own which of these is driving a given trend, so we'd encourage reading year-to-year changes as a starting point for questions rather than a conclusion on their own.
Even with that extra care, this data comes with some built-in limits. How cases have been tracked, categorized, and reported has evolved over the past five years, along with the policies that shape how they're handled. That means a few of the tables only cover more recent years, and some shifts in the numbers reflect changes in how something was tracked or defined, not necessarily a real change in what was happening on campus. Wherever that's the case, we've noted it next to the relevant data so it's not mistaken for a meaningful trend.
-
Every CRP case is sorted into one of five broad categories, based on the nature of the primary concern raised. These are Sexual Harassment, Discrimination, Faculty Matters, Institutional Conflict, and a catch-all "Other" category for matters that don't fit neatly elsewhere.
Sexual Harassment has consistently made up the largest share of cases each year, though that share has shifted, falling from just over half of all cases in FY22 (52.3%) to roughly a third to two-fifths of cases in more recent years. Discrimination cases have followed a similar downward pattern as a share of the total, from about a third of cases in FY22 and FY23 down to roughly a fifth in FY25 and FY26. It's important to note that this decline is in share, not in actual caseload. The number of Sexual Harassment and Discrimination cases handled each year has stayed fairly steady, and in FY26 both categories saw their raw numbers rise. What's changed is that these two categories now make up a smaller piece of a larger overall pie, as the office's scope has expanded to formally include additional case types.
Faculty Matters and Institutional Conflict show up as "N/A" in FY22 and FY23 because those matters weren't yet a formal part of CRP's portfolio. They began being introduced starting in FY24, with Faculty Matters not fully implemented until FY26, so the numbers for these two categories don't yet show a real trend over time. What they do show is that CRP's caseload outside of Sexual Harassment and Discrimination (referred to elsewhere on this page as non-EO/Title IX matters) has begun to grow as these areas have come online.
The "Other" category covers matters that don't clearly fall under one of the four main types. This includes reports where the allegations were unclear, matters outside CRP's scope, pregnancy accommodation requests, and other miscellaneous investigations. This category has grown from 15.0% of cases in FY22 to a high of nearly 30% in FY24, before settling back down to around a fifth of cases by FY26.
Taken together, CRP's total caseload has grown considerably over this period, from 193 cases in FY22 to 331 in FY26, an increase of about 71%. This growth largely reflects the office's expanded portfolio, including the addition of Faculty Matters and Institutional Conflict as formal case types, along with an expansion of mandated reporting requirements that took effect in August 2025. As the caseload has grown, so has the office itself, which has expanded from four employees to six over this same period.
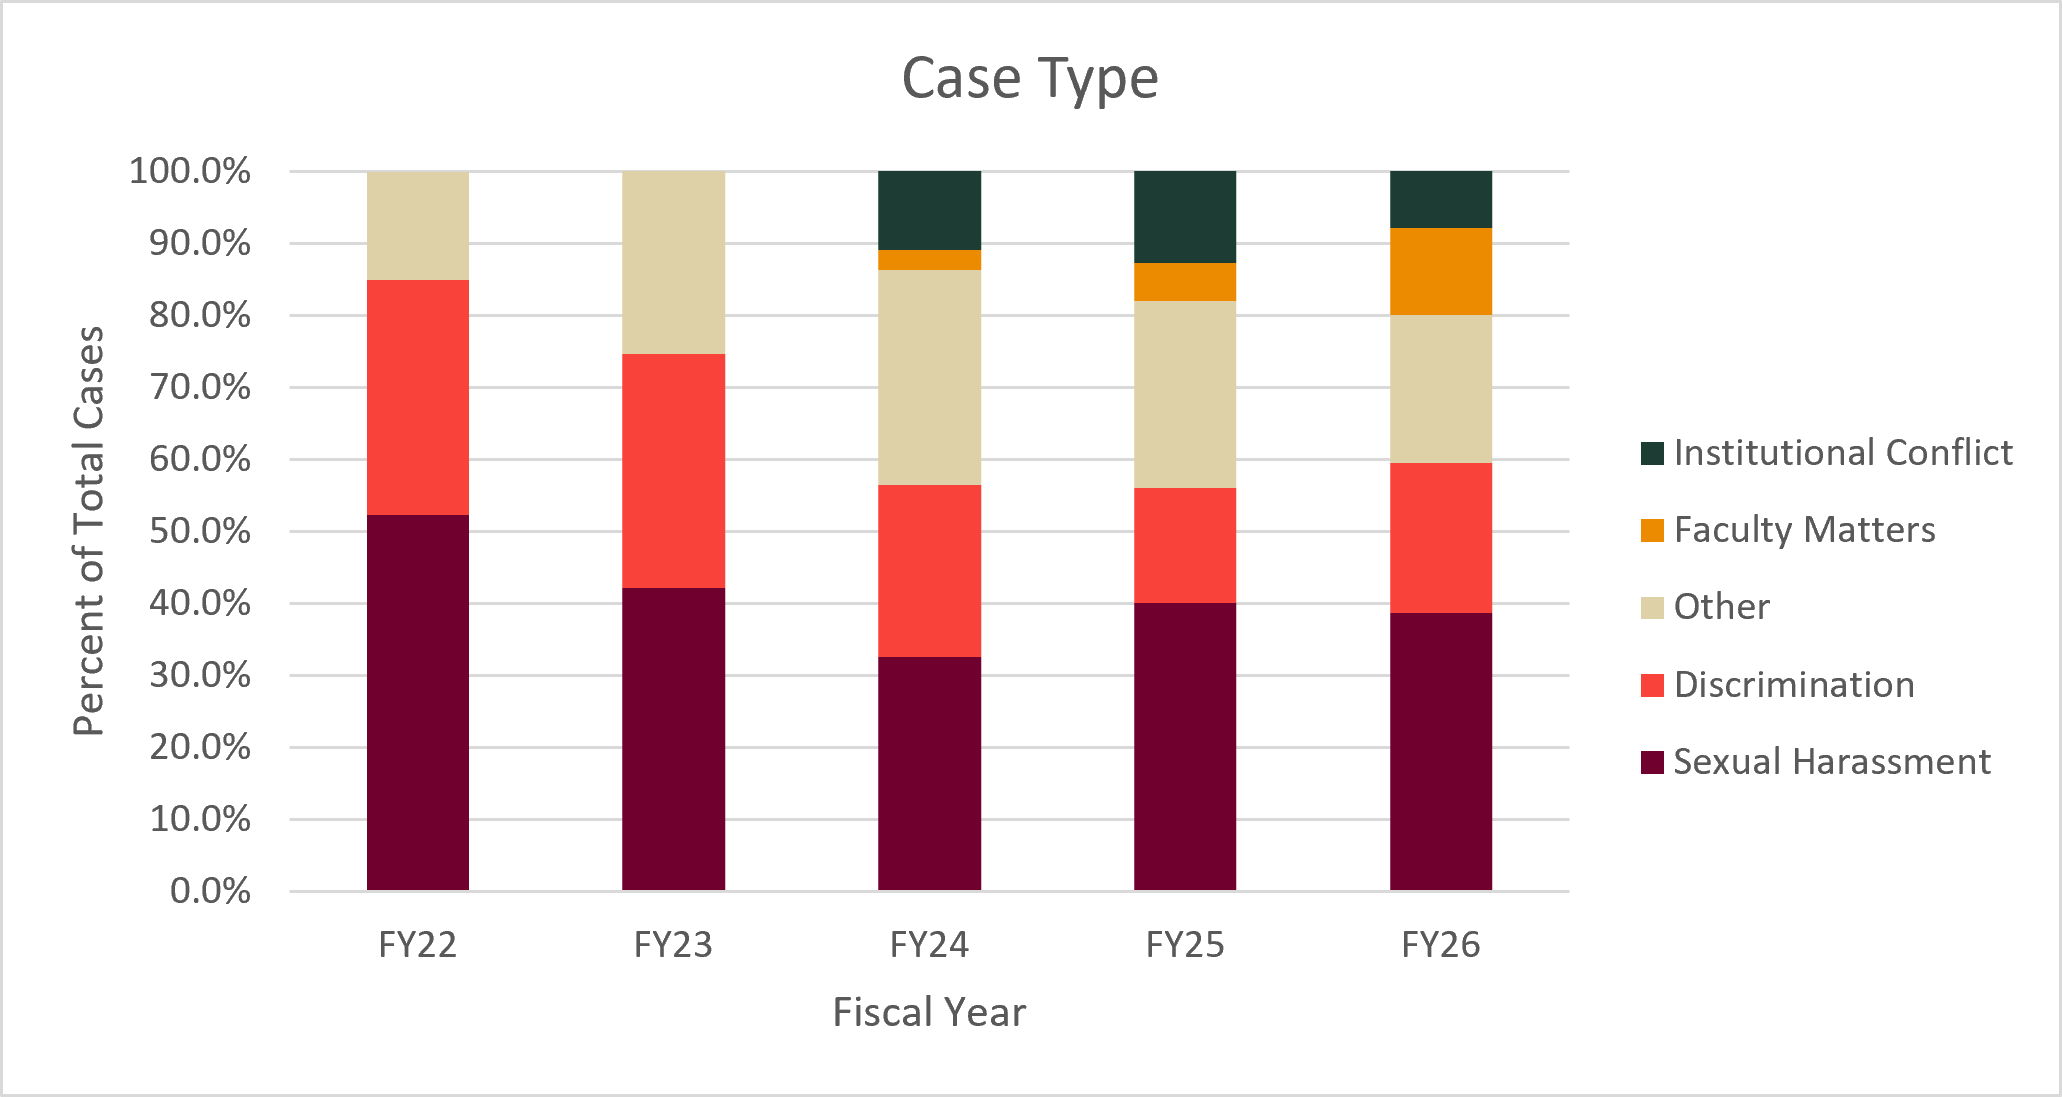
Case Types by Fiscal Year FY22 FY23 FY24 FY25 FY26 Sexual Harassment 52.3% 42.1% 32.6% 40.0% 38.7% Discrimination 32.6% 32.5% 23.8% 16.0% 20.8% Other 15.0% 25.4% 29.9% 26.0% 20.5% Faculty Matters N/A N/A 2.7% 5.2% 12.1% Institutional Conflict N/A N/A 11.1% 12.8% 7.9% Multiple Case Types
A small number of cases each year involve more than one CRP case type, for example, a case that involves both Discrimination and Institutional Conflict. Throughout this page, these cases are counted under their primary case type for most statistics, so the totals shown in tables like Case Type reflect one type per case rather than double-counting.
This has consistently affected a small share of CRP's total caseload, generally around 2 to 3% of cases each year, with the exception of FY23, when no cases involved more than one type. Because this affects such a small portion of the overall caseload, it has a limited impact on the trends shown elsewhere on this page.
-
Within Sexual Harassment cases, CRP tracks the specific type of conduct involved, such as stalking, sexual assault, or domestic violence. These categories are counted as a share of Sexual Harassment cases only, not the office's total caseload, so they show how the makeup of Sexual Harassment concerns has changed over time.
Sexual Assault, Stalking, and Hostile Environment Harassment have consistently been the most common subtypes each year, though which one leads has shifted. Sexual Assault was the largest share for most of this period, peaking at 57.6% of Sexual Harassment cases in FY24, but its share has fallen substantially since, down to 24.2% by FY26. Stalking has moved the opposite direction, rising from about a fifth of cases in FY22 to become the most common subtype in FY26 at 37.5%. Hostile Environment Harassment has remained in this top tier throughout, generally making up around a fifth to a quarter of cases each year.
The remaining subtypes, Domestic Violence, Dating Violence, Sex-Based Exploitation, and Quid Pro Quo, have made up a smaller and more variable share of cases. Domestic Violence has grown somewhat over the period, while Sex-Based Exploitation has declined. Dating Violence has stayed fairly steady, and Quid Pro Quo has remained rare throughout.
It's worth noting that because these are shares of a shifting pool of Sexual Harassment cases each year, and the total number of Sexual Harassment cases itself has varied, a rising or falling percentage doesn't always mean the same change in raw case counts. For example, Sexual Assault's share fell by more than half between FY24 and FY26, but the underlying caseload only dropped from 49 to 31 cases.
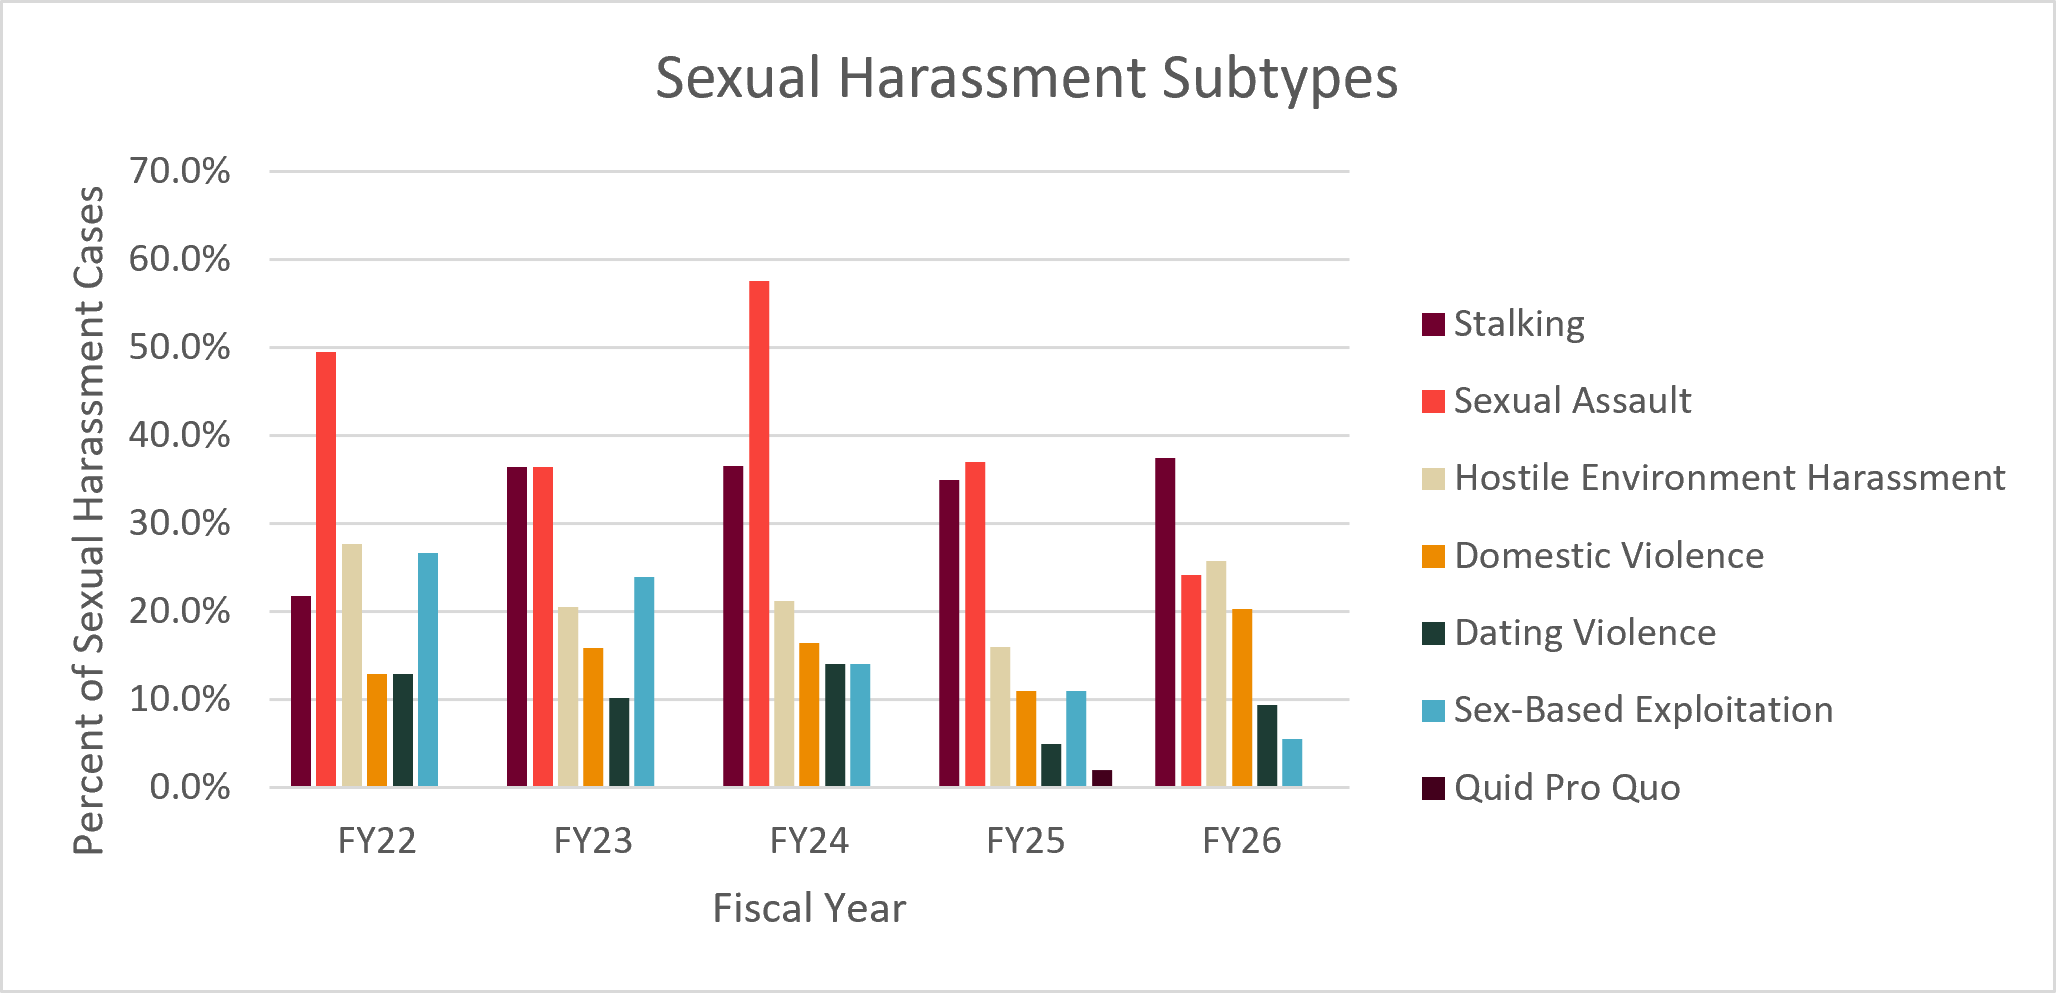
Sexual Harassment Subtypes by Fiscal Year FY22 FY23 FY24 FY25 FY26 Stalking 21.8% 36.4% 36.5% 35.0% 37.5% Sexual Assault 49.5% 36.4% 57.6% 37.0% 24.2% Hostile Environment Harassment 27.7% 20.5% 21.2% 16.0% 25.8% Domestic Violence 12.9% 15.9% 16.5% 11.0% 20.3% Dating Violence 12.9% 10.2% 14.1% 5.0% 9.4% Sex-Based Exploitation 26.7% 23.9% 14.1% 11.0% 5.5% Quid Pro Quo 0.0% 0.0% 0.0% 2.0% 0.0% -
Within Discrimination cases, CRP also tracks the specific type of charge involved, specifically Discrimination, Harassment, and Retaliation. A single case can involve more than one of these charges at once, so these percentages can add up to more than 100%, and aren't meant to be read as parts of a whole the way the Case Type chart is.
Harassment has been the most common charge type within Discrimination cases for most of this period, and in FY22 through FY24 it was recorded on more cases than there were Discrimination cases that year, reflecting that multiple Harassment-related charges were often tracked on the same case. That pattern shifted in FY25, when Harassment's share dropped sharply before partially recovering in FY26. Over that same stretch, Discrimination as its own charge type has climbed steadily, rising from about 30% of cases in FY22 to roughly 59% in FY26, and has become the more consistently present charge type in the two most recent years. Retaliation has remained the least common of the three charge types throughout, though its share has grown gradually over the five years.
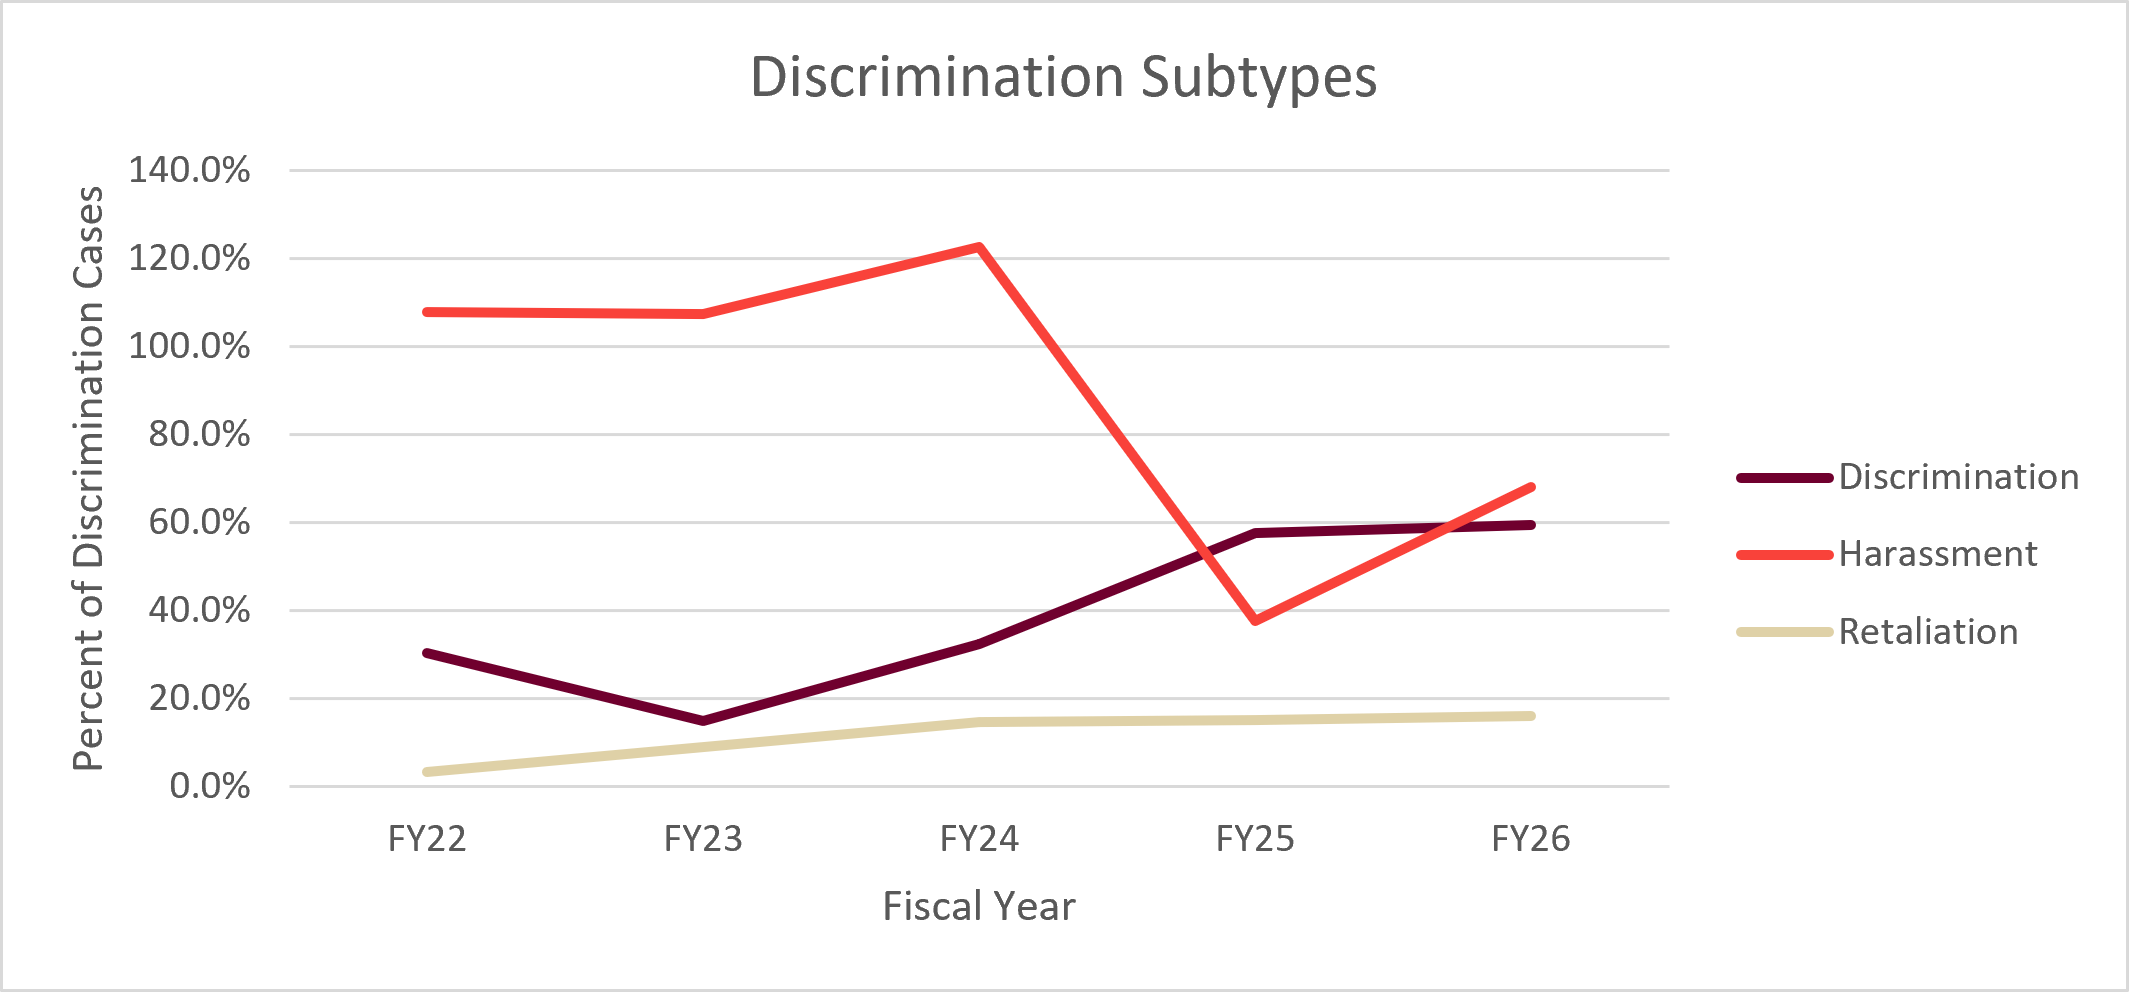
Discrimination Subtypes by Fiscal Year FY22 FY23 FY24 FY25 FY26 Discrimination 30.2% 14.7% 32.3% 57.5% 59.4% Harassment 107.9% 107.4% 122.6% 37.5% 68.1% Retaliation 3.2% 8.8% 14.5% 15.0% 15.9% -
For Discrimination cases, CRP tracks which protected status the concern was based on. In total, 14 protected statuses are tracked, including categories like race, religion, national origin, marital or family status, age, and veteran status, among others. The five shown here (Race, Physical/Mental Disability, Sex, Gender, and Sexual Orientation) are consistently the five most commonly cited each year, though their order has shifted. A case can involve more than one protected status, and Sexual Harassment cases are not included in this breakdown.
Sex was the most commonly cited protected status early in this period, present in over half of Discrimination cases in FY22, but its share has declined steadily since, falling to about 10% by FY26. Part of this decline reflects a change in tracking practice rather than a change in what was occurring. Sex-based Hostile Environment Harassment allegations were previously tracked under both Discrimination and Sexual Harassment at once, but that dual-tracking practice was discontinued so these cases are now counted only under Sexual Harassment, which has reduced the Sex count shown here for Discrimination.
Race and Physical/Mental Disability have both trended upward over the same period and were the two most commonly cited protected statuses in FY26, each present in about a third of Discrimination cases. Some of the FY26 increase across statuses beyond Sex, Gender, and Sexual Orientation also reflects a policy change: until August 2025, mandated reporting requirements applied only to concerns involving sex, gender, and sexual orientation. Starting in FY26, mandated reporting was expanded to cover all 14 protected statuses, which is likely contributing to the higher case volume seen this year for categories like Race and Physical/Mental Disability.
Gender has stayed in a more moderate, fluctuating range throughout. Sexual Orientation has consistently been the least commonly cited of the five shown here. Because the underlying case counts for this category are small in every year, its percentages are more sensitive to change from just one or two cases, and year-to-year shifts here should be read with that in mind rather than as a strong trend.
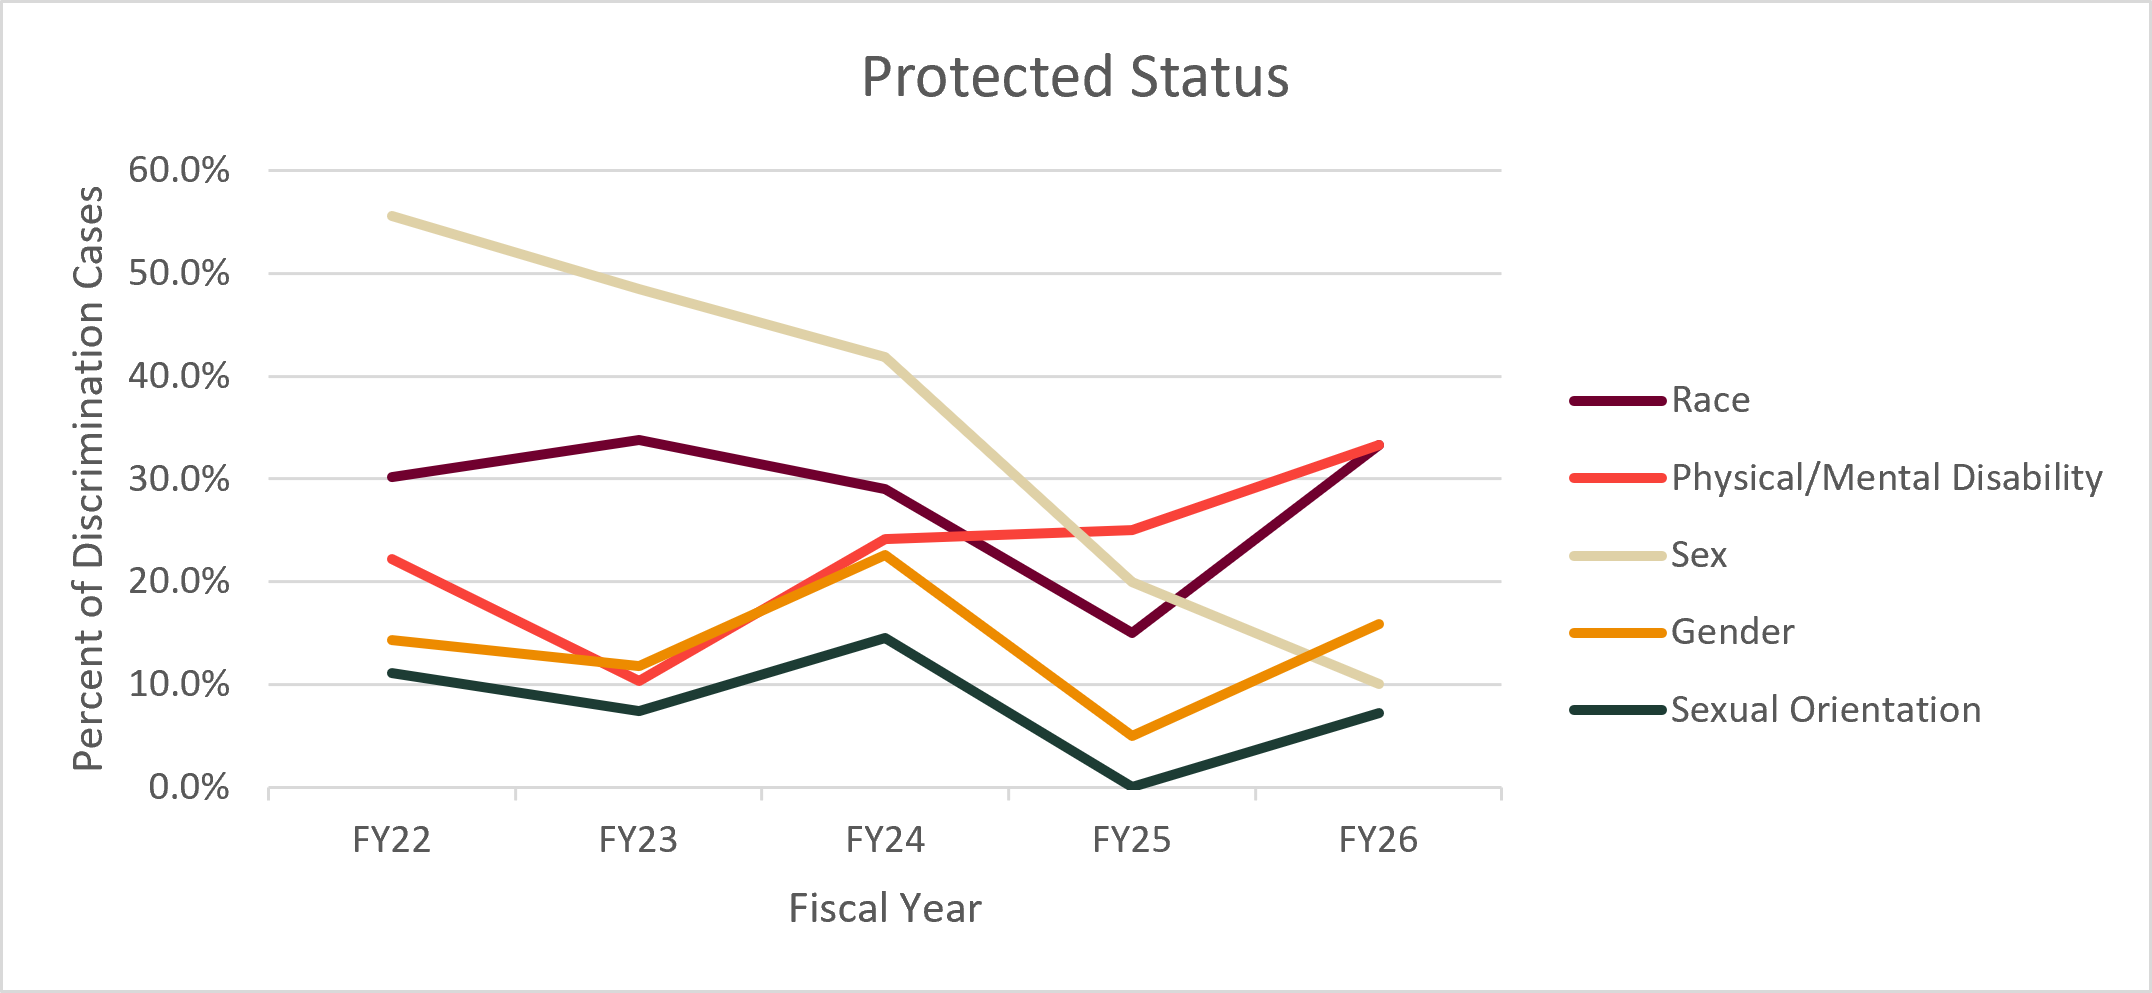
Protected Status by Fiscal Year FY22 FY23 FY24 FY25 FY26 Race 30.2% 33.8% 29.0% 15.0% 33.3% Physical/Mental Disability 22.2% 10.3% 24.2% 25.0% 33.3% Sex 55.6% 48.5% 41.9% 20.0% 10.1% Gender 14.3% 11.8% 22.6% 5.0% 15.9% Sexual Orientation 11.1% 7.4% 14.5% 0.0% 7.2% -
This table shows who initially referred EO/Title IX matters, which include Sexual Harassment and Discrimination cases, to CRP, tracked at the case level with one referral source recorded per case.
UM Employee and UM Student represent CRP's two largest general populations, so it follows that they're consistently the top two referral sources, with UM Employee generally accounting for around 40% to 45% of referrals and UM Student holding steady in the low-to-mid 20% range. UM Housing, Dean of Students, and UMPD are smaller, specific offices that have consistently referred a meaningful and fairly steady share of cases relative to their size.
Dean of Students shows a notable shift in FY26, growing to about 14% of referrals and becoming the third most common source that year. This largely reflects a structural change rather than a new source of concerns: the Dean of Students office was reestablished in FY24, and before that, its functions, including student conduct and the CARES team, were embedded within UM Housing. This is also part of why UM Housing's referral share dropped in FY26, as some of what it previously handled and referred is now being reported through Dean of Students instead. UMPD has remained a smaller, steady referral source throughout the period. The "Other" category, covering smaller or less common referral sources, has fluctuated year to year without a clear directional trend.
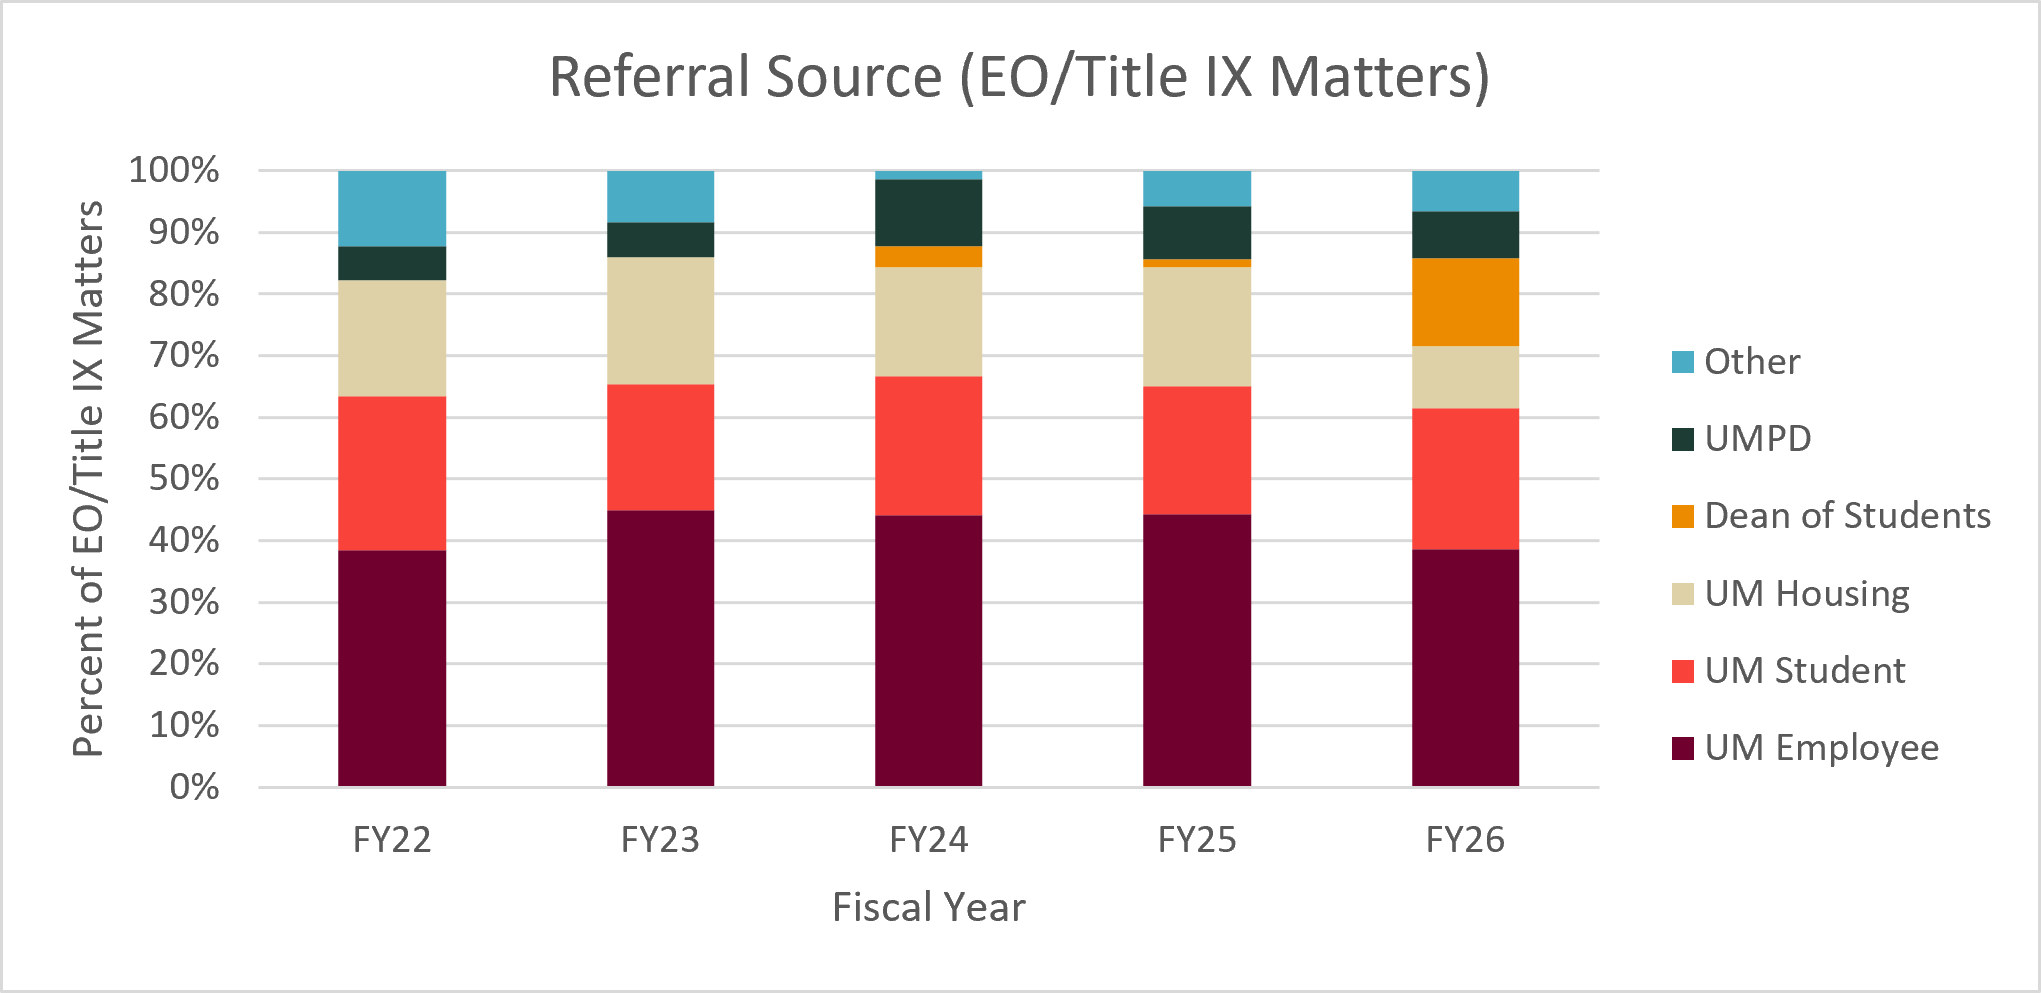
Referral Source by Fiscal Year FY22 FY23 FY24 FY25 FY26 UM Employee 38.4% 44.9% 44.2% 44.3% 38.6% UM Student 25.0% 20.5% 22.4% 20.7% 22.8% UM Housing 18.9% 20.5% 17.7% 19.3% 10.2% Dean of Students N/A N/A 3.4% 1.4% 14.2% UMPD 5.5% 5.8% 10.9% 8.6% 7.6% Other 12.2% 8.3% 1.4% 5.7% 6.6% -
This table shows how EO/Title IX matters, meaning Sexual Harassment and Discrimination cases, initially came to CRP's attention: through a mandated report from an employee obligated to report, a first-hand report from someone directly involved, or a third-party report from someone else aware of the situation.
Mandated Report has been the most common referral type in every year shown, consistently accounting for around half to just over half of all referrals. First-Hand Report has been the second most common type throughout, generally making up around a third of referrals, though it dipped somewhat in FY23. Third-Party Report has consistently been the smallest of the three categories, generally in the low-to-mid teens as a share of referrals.
Overall, the relative mix of these three referral types has stayed fairly consistent across all five years, even as the total number of EO/Title IX matters referred each year has grown.
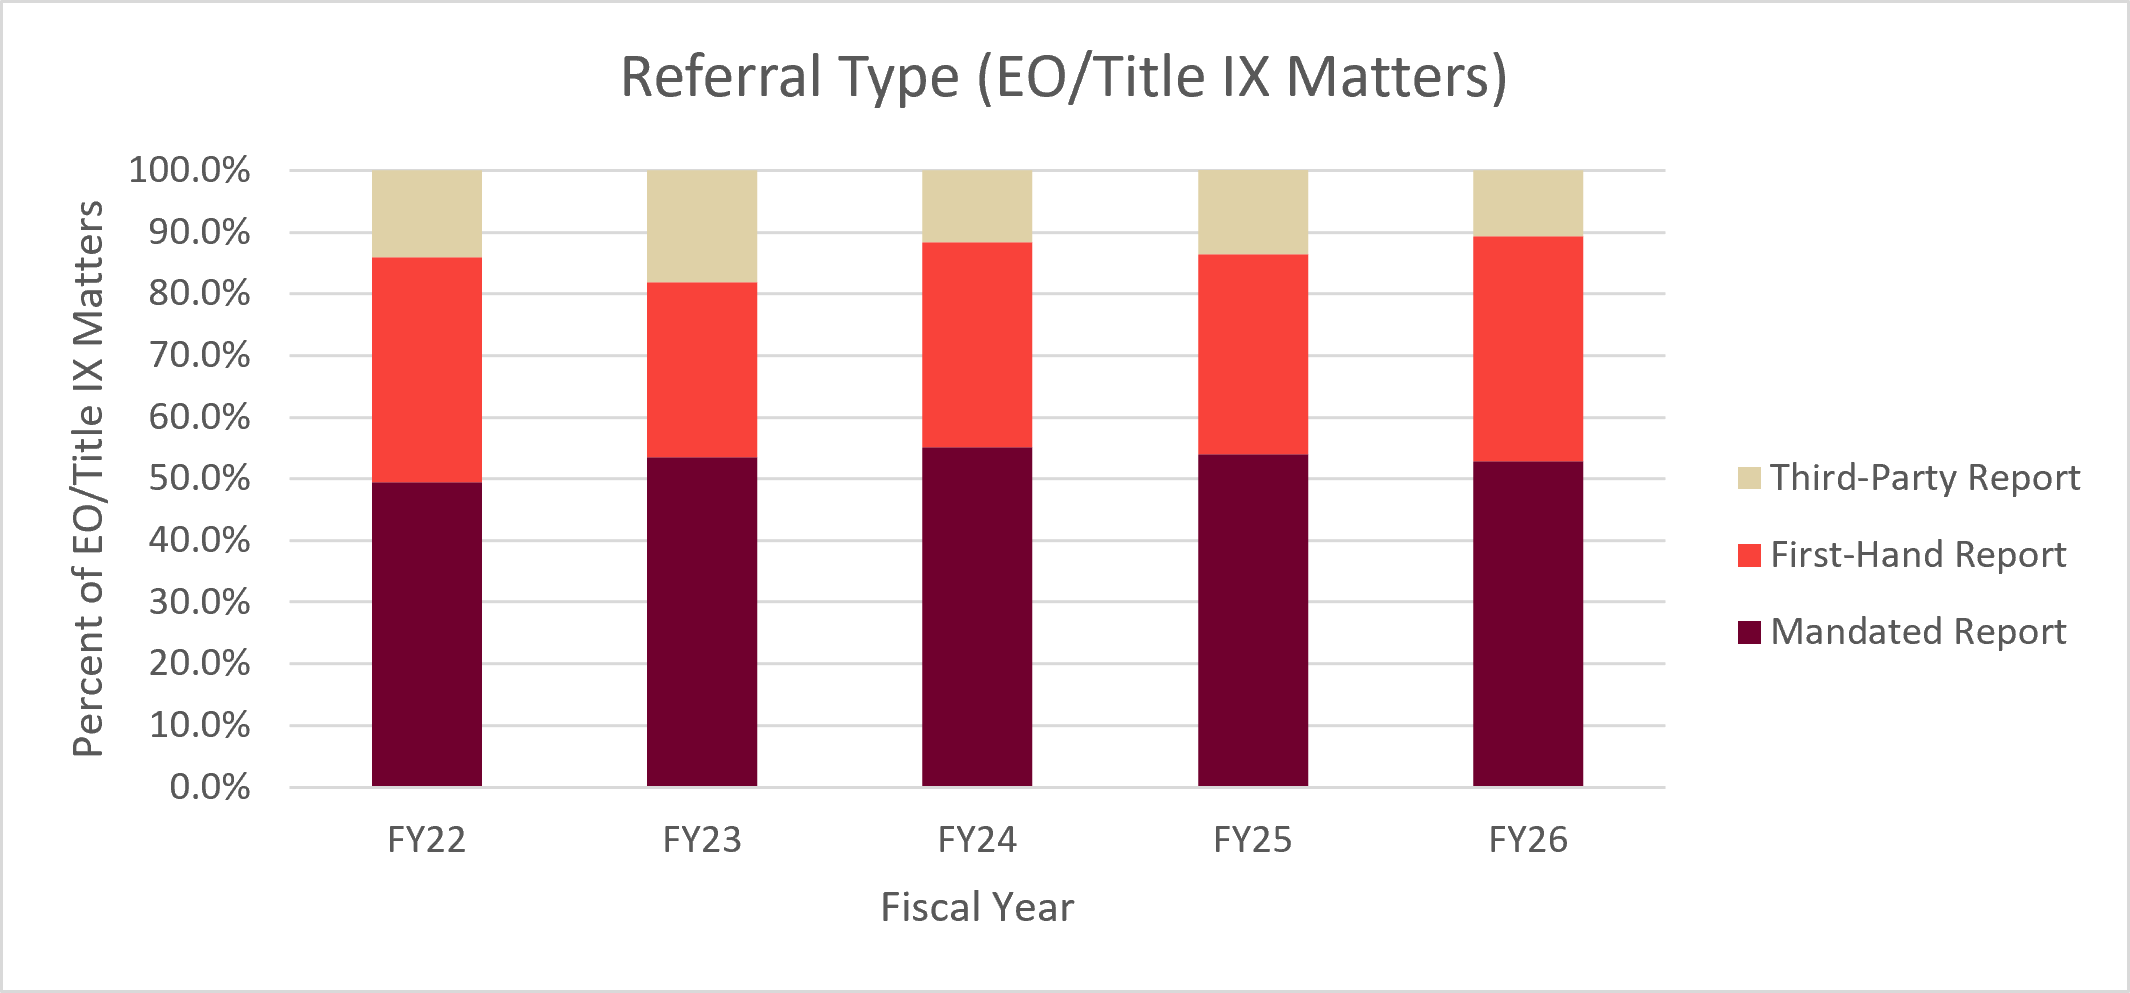
Referral Type by Fiscal Year FY22 FY23 FY24 FY25 FY26 Mandated Report 49.4% 53.5% 55.1% 54.0% 52.8% First-Hand Report 36.6% 28.4% 33.3% 32.4% 36.5% Third-Party Report 14.0% 18.1% 11.6% 13.7% 10.7% -
This table shows the affiliation of Complainants (the person impacted by the conduct) in cases where that affiliation was known. This is calculated as a share of Complainants with a known affiliation, not of total cases, since a case's Complainant isn't always recorded.
Students have made up the large majority of Complainants in every year shown, consistently in the mid-to-high 80% range or higher. That share peaked in FY25 at about 91.5% before returning closer to its typical range in FY26. Employees have consistently made up a much smaller share, generally in the range of 8% to 13% of Complainants, and individuals not affiliated with or enrolled at the university have made up the smallest share throughout, generally under 4%.
Overall, the mix of who brings concerns to CRP as a Complainant has stayed fairly consistent across all five years.
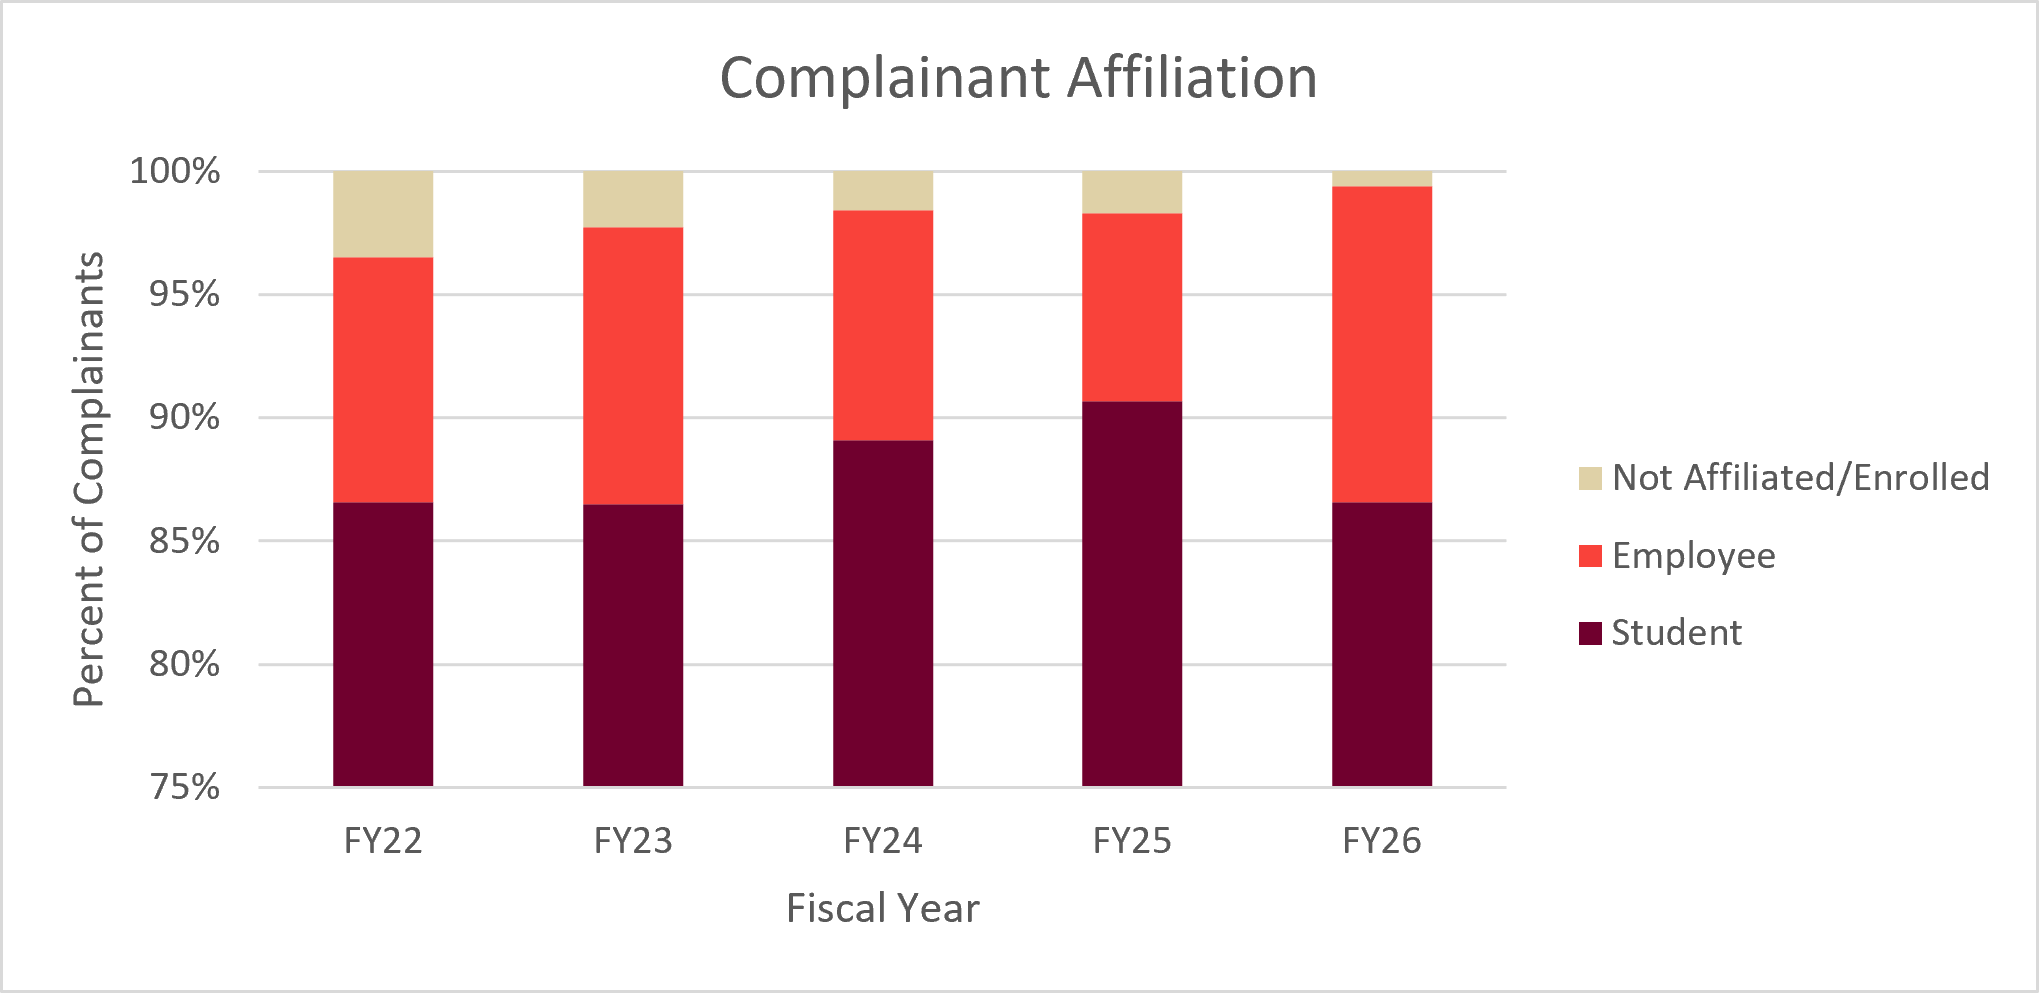
Complainant Affiliation by Fiscal Year FY22 FY23 FY24 FY25 FY26 Student 86.5% 87.2% 89.8% 91.5% 87.1% Employee 9.9% 11.3% 9.4% 7.7% 12.9% Not Affiliated/Enrolled 3.5% 2.3% 1.6% 1.7% 0.6% -
This table shows the affiliation of Respondents (the person the concern was raised about) in cases where that affiliation was known, calculated as a share of Respondents with a known affiliation. This pool tends to be meaningfully smaller than the total number of cases, since Respondent information isn't always recorded.
Students have consistently made up the largest share of Respondents, though that share has fluctuated more from year to year than it does for Complainants, ranging from about 54% to 68% across the five years without a clear upward or downward trend. Employees have made up the second largest share throughout, also fluctuating, from a low of about 19% in FY25 to closer to 37% in FY22 and FY26. Individuals not affiliated with or enrolled at the university have made up a smaller share, generally under 10%, though that rose to about 13% in FY25. Administrator/Department has been the smallest and least consistent category, appearing at low single-digit percentages most years.
Compared to Complainant Affiliation, which has stayed fairly steady year over year, Respondent Affiliation shows more year-to-year movement between Students and Employees specifically, though both have remained the two largest groups throughout.
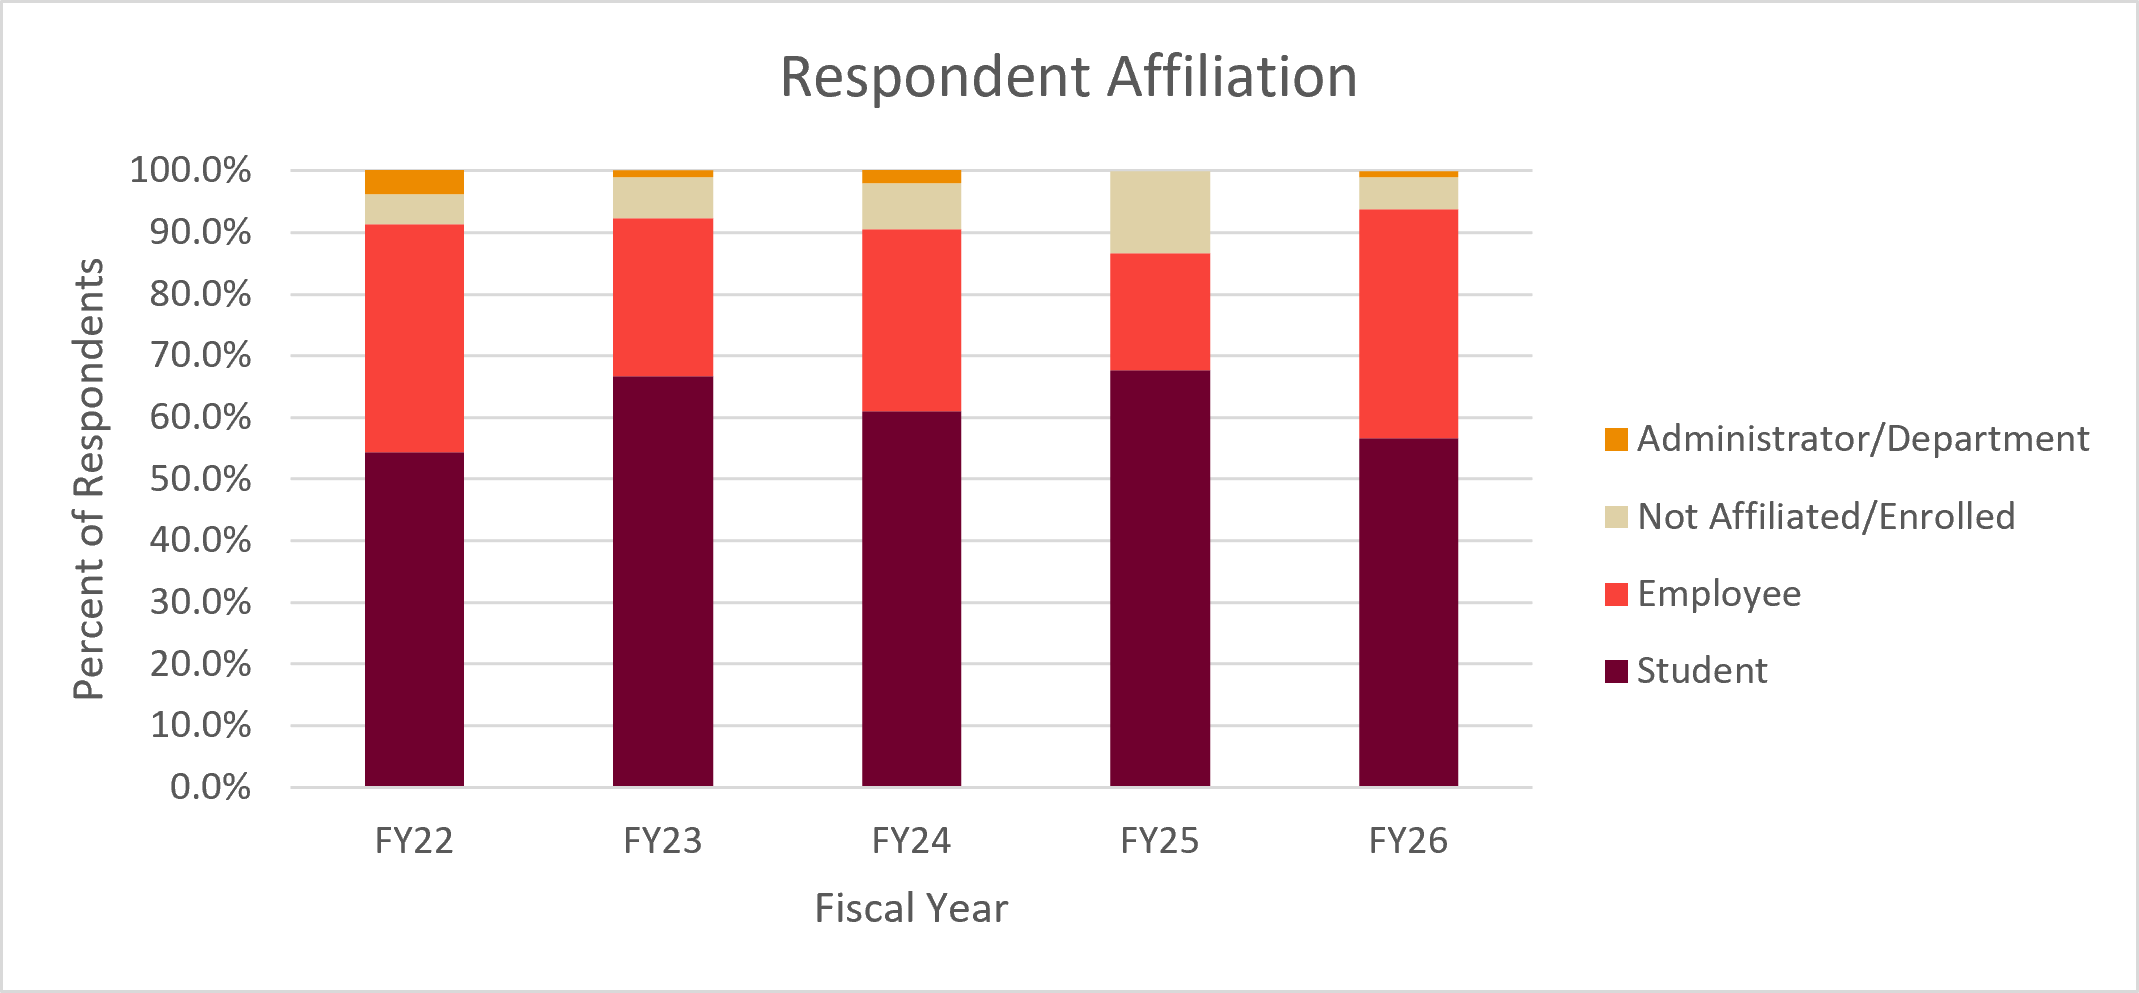
Complainant Affiliation by Fiscal Year FY22 FY23 FY24 FY25 FY26 Student 54.4% 66.7% 61.1% 67.6% 56.7% Employee 36.9% 25.6% 29.5% 19.1% 37.1% Not Affiliated/Enrolled 4.9% 6.7% 7.4% 13.2% 5.2% Administrator/Department 5.8% 1.1% 3.2% 0.0% 1.0% -
This table shows how EO/Title IX matters, meaning Sexual Harassment and Discrimination cases, were resolved, among cases that had a recorded resolution.
No Action means the case did not meet jurisdiction, or the Complainant asked that no action be taken. Supportive measures are still offered and coordinated in these cases regardless. No Action has grown substantially over this period, nearly doubling in share from about 33% of resolved cases in FY22 to just under half of all resolved cases in FY26.
No Response means the Complainant did not respond to CRP's outreach, which is entirely within their choice about whether to engage further. No Response was the most common resolution type in three of the first four years shown, but its share has declined markedly since, falling from a high of about 44.5% in FY25 to about 22% in FY26.
Informal Action means CRP took some action outside of a formal grievance process, such as a case referral, informal intervention, or guidance provided to those involved. Informal Action has fluctuated over the period but reached its highest share yet in FY26, at about 22% of resolved cases.
Formal Grievance/Investigatory Process means a Formal Complaint was signed, which can lead to a full investigation and finding, an adaptive resolution, or dismissal on established grounds. This category has trended downward across the five years, from about 18% of resolved cases in FY22 to roughly 6% in FY26.
Read together, the drop in No Response alongside the rise in No Action may point to a shift in how Complainants are engaging with CRP. Rather than disengaging from the process altogether, more Complainants appear to be responding to outreach and participating, for example to access supportive measures, while still deciding that a formal investigation isn't the outcome they're seeking. In other words, more engagement doesn't necessarily mean more formal action, and Complainants understand that engaging with CRP does not automatically lead to one.
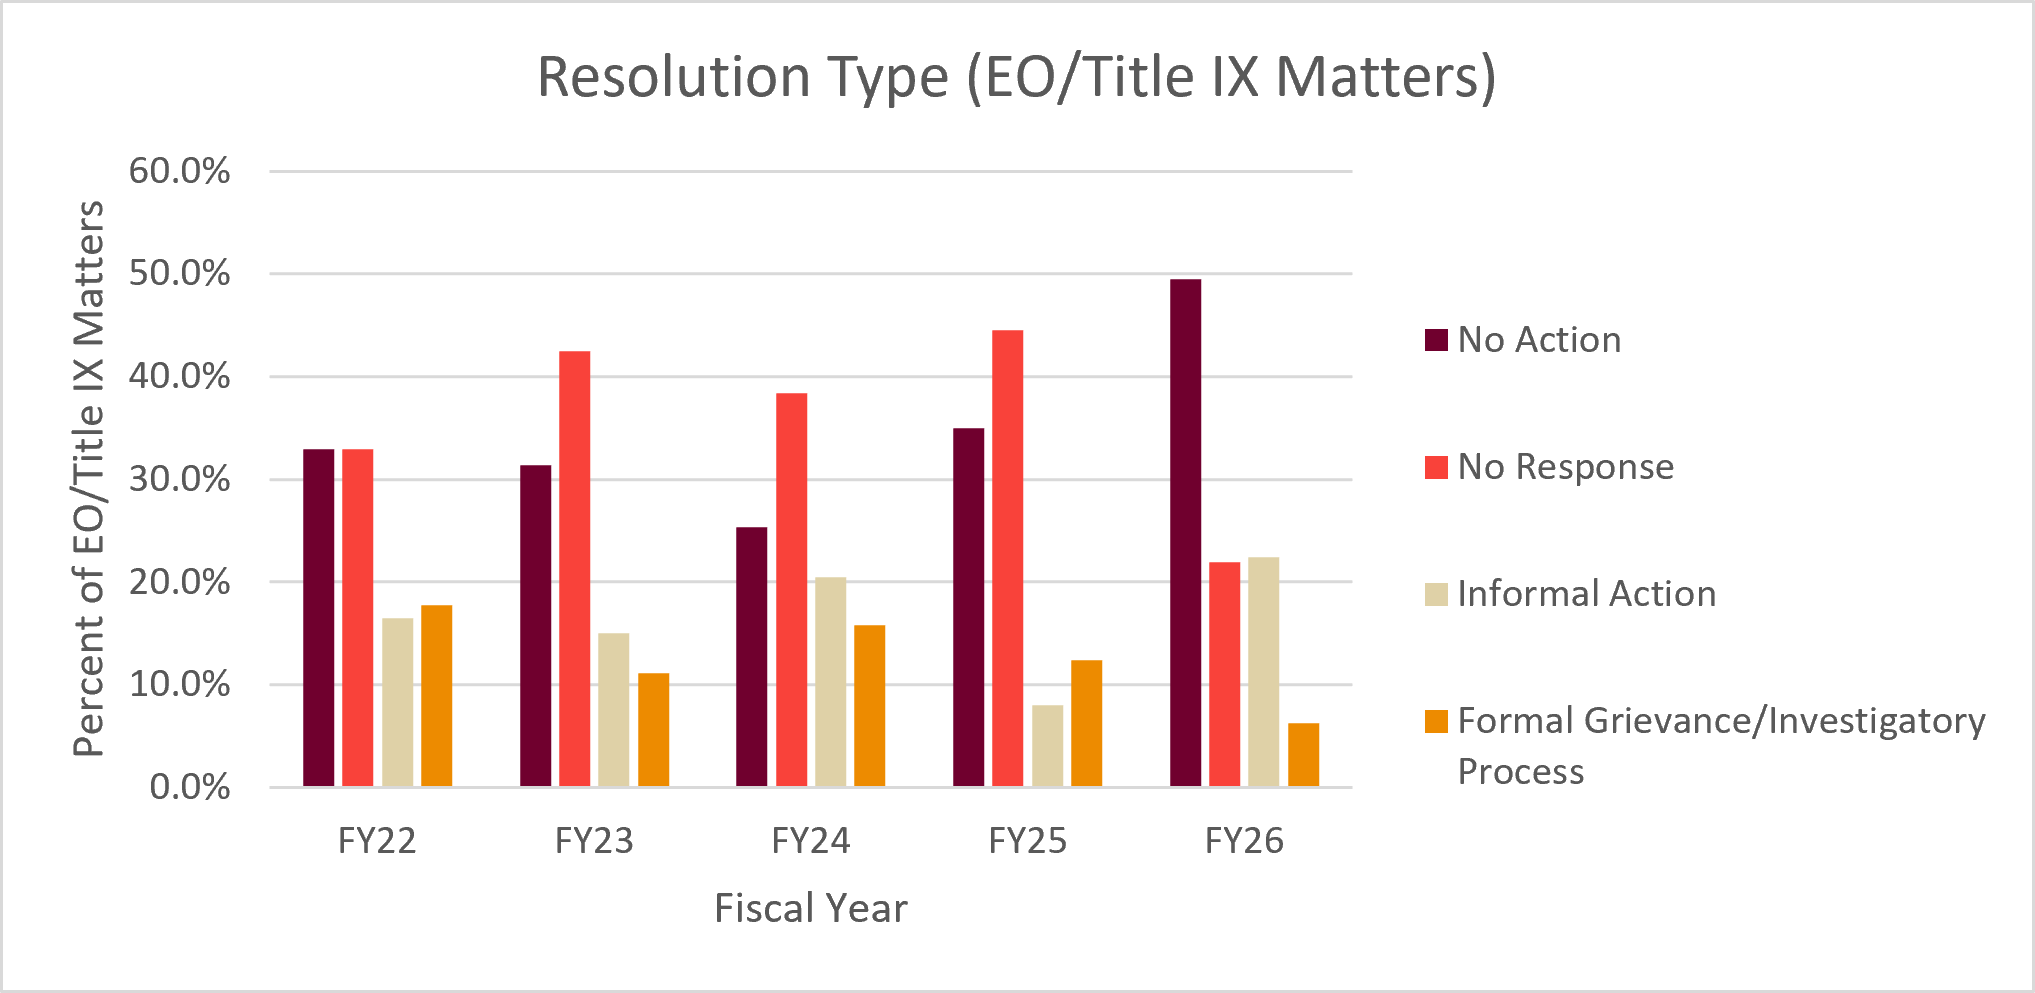
Resolution Type by Fiscal Year FY22 FY23 FY24 FY25 FY26 No Action 32.9% 31.4% 25.3% 35.0% 49.5% No Response 32.9% 42.5% 38.4% 44.5% 21.9% Informal Action 16.5% 15.0% 20.5% 8.0% 22.4% Formal Grievance/Investigatory Process 17.7% 11.1% 15.8% 12.4% 6.3% -
This table is shown for FY26 only, since the audit process it draws from was newly introduced that year and doesn't yet have prior-year data to compare against. It combines figures for Complainants and Respondents together.
In FY26, CRP sent 264 outreach letters offering supportive measures.
Among those who did engage, most accepted the supportive measures offered to them: about 62% accepted and had measures coordinated, while about 38% were offered measures but declined them.
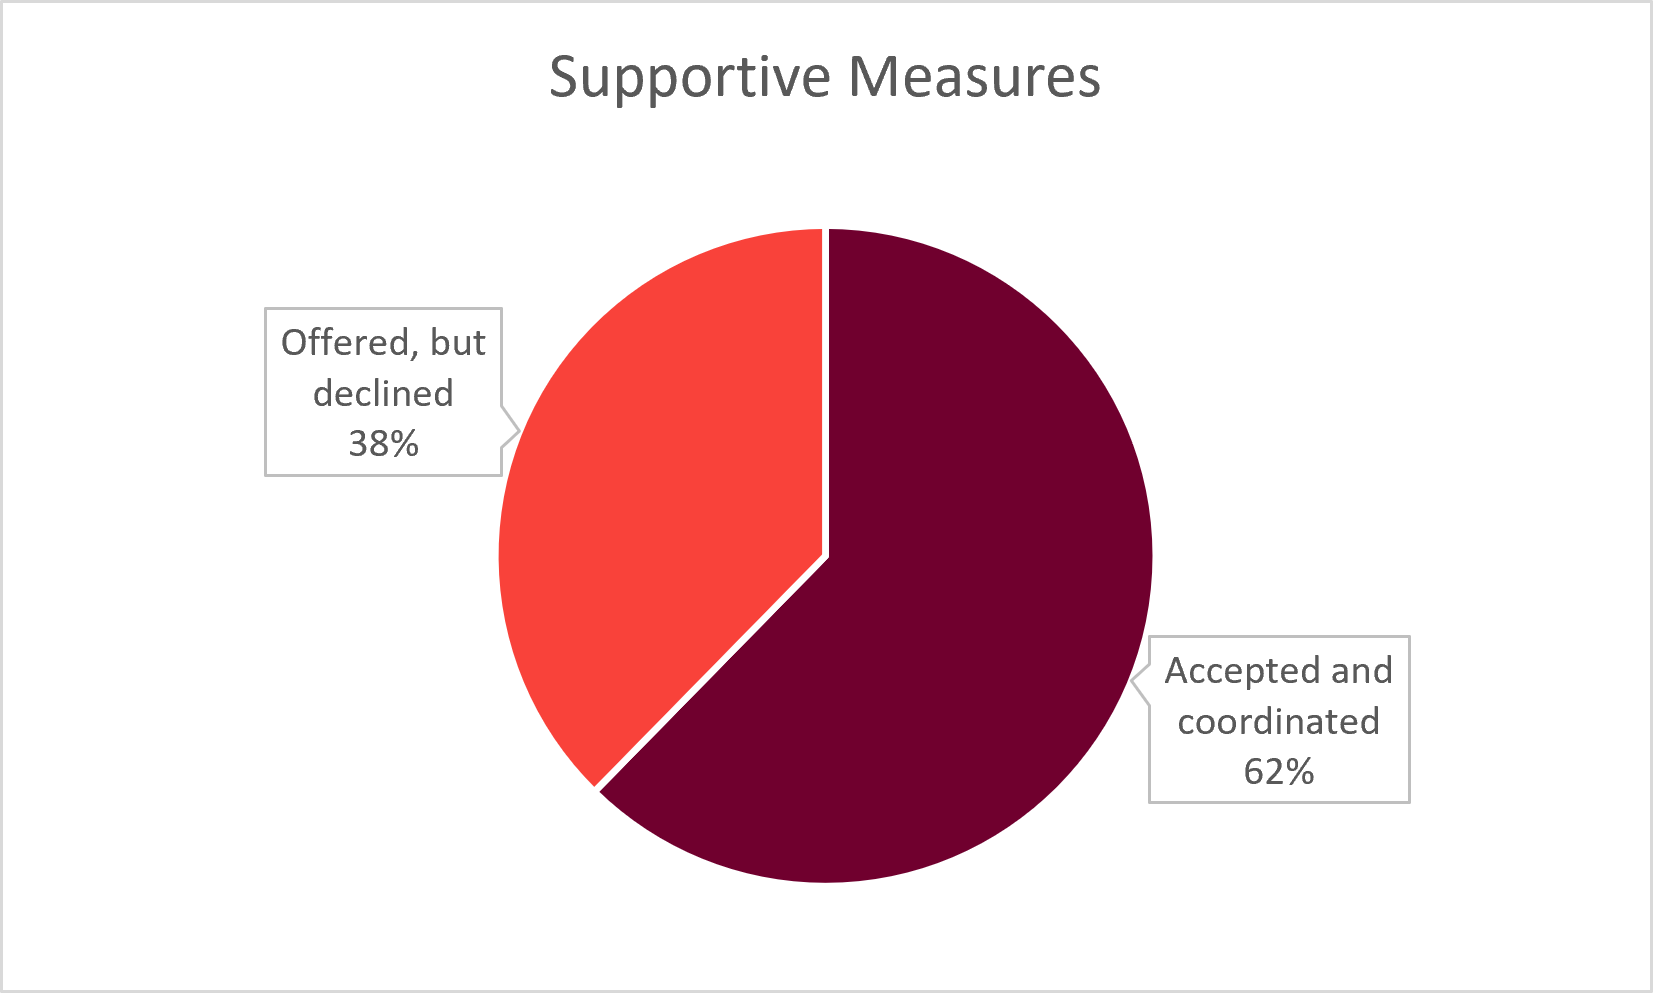
Percent of individuals who accepted or declined supportive measures. FY26 Accepted and coordinated 62.3% Offered, but declined 37.7% Looking at the types of measures involved, each measure type breaks down into three groups: individuals who were offered that measure and accepted it, individuals who were offered it but declined, and individuals who weren't offered that particular measure at all.
Counseling Referral was the measure most people encountered overall, with about 27% of engaged individuals accepting it and another 42% being offered it but declining, meaning only about 4% of engaged individuals weren't offered a counseling referral at all. Academic Accommodations for a specific course showed a similar pattern of wide reach, offered to the large majority of engaged individuals, with just over a quarter accepting it. Advocacy Referral was offered somewhat less broadly, reaching about 65% of engaged individuals, with around a fifth accepting it.
Housing Accommodations, general Academic Accommodations, and Other Referral occupied a middle tier, each reaching roughly a quarter to a third of engaged individuals and being accepted by about 10% to 14%. Mutual No Contact Directives, Letters of Support, and Employment Accommodations were the least commonly offered measures, each reaching less than a fifth of engaged individuals, with Employment Accommodations in particular going unoffered to over 90% of engaged individuals, likely reflecting that it's only relevant to a smaller subset of cases involving an employment relationship.
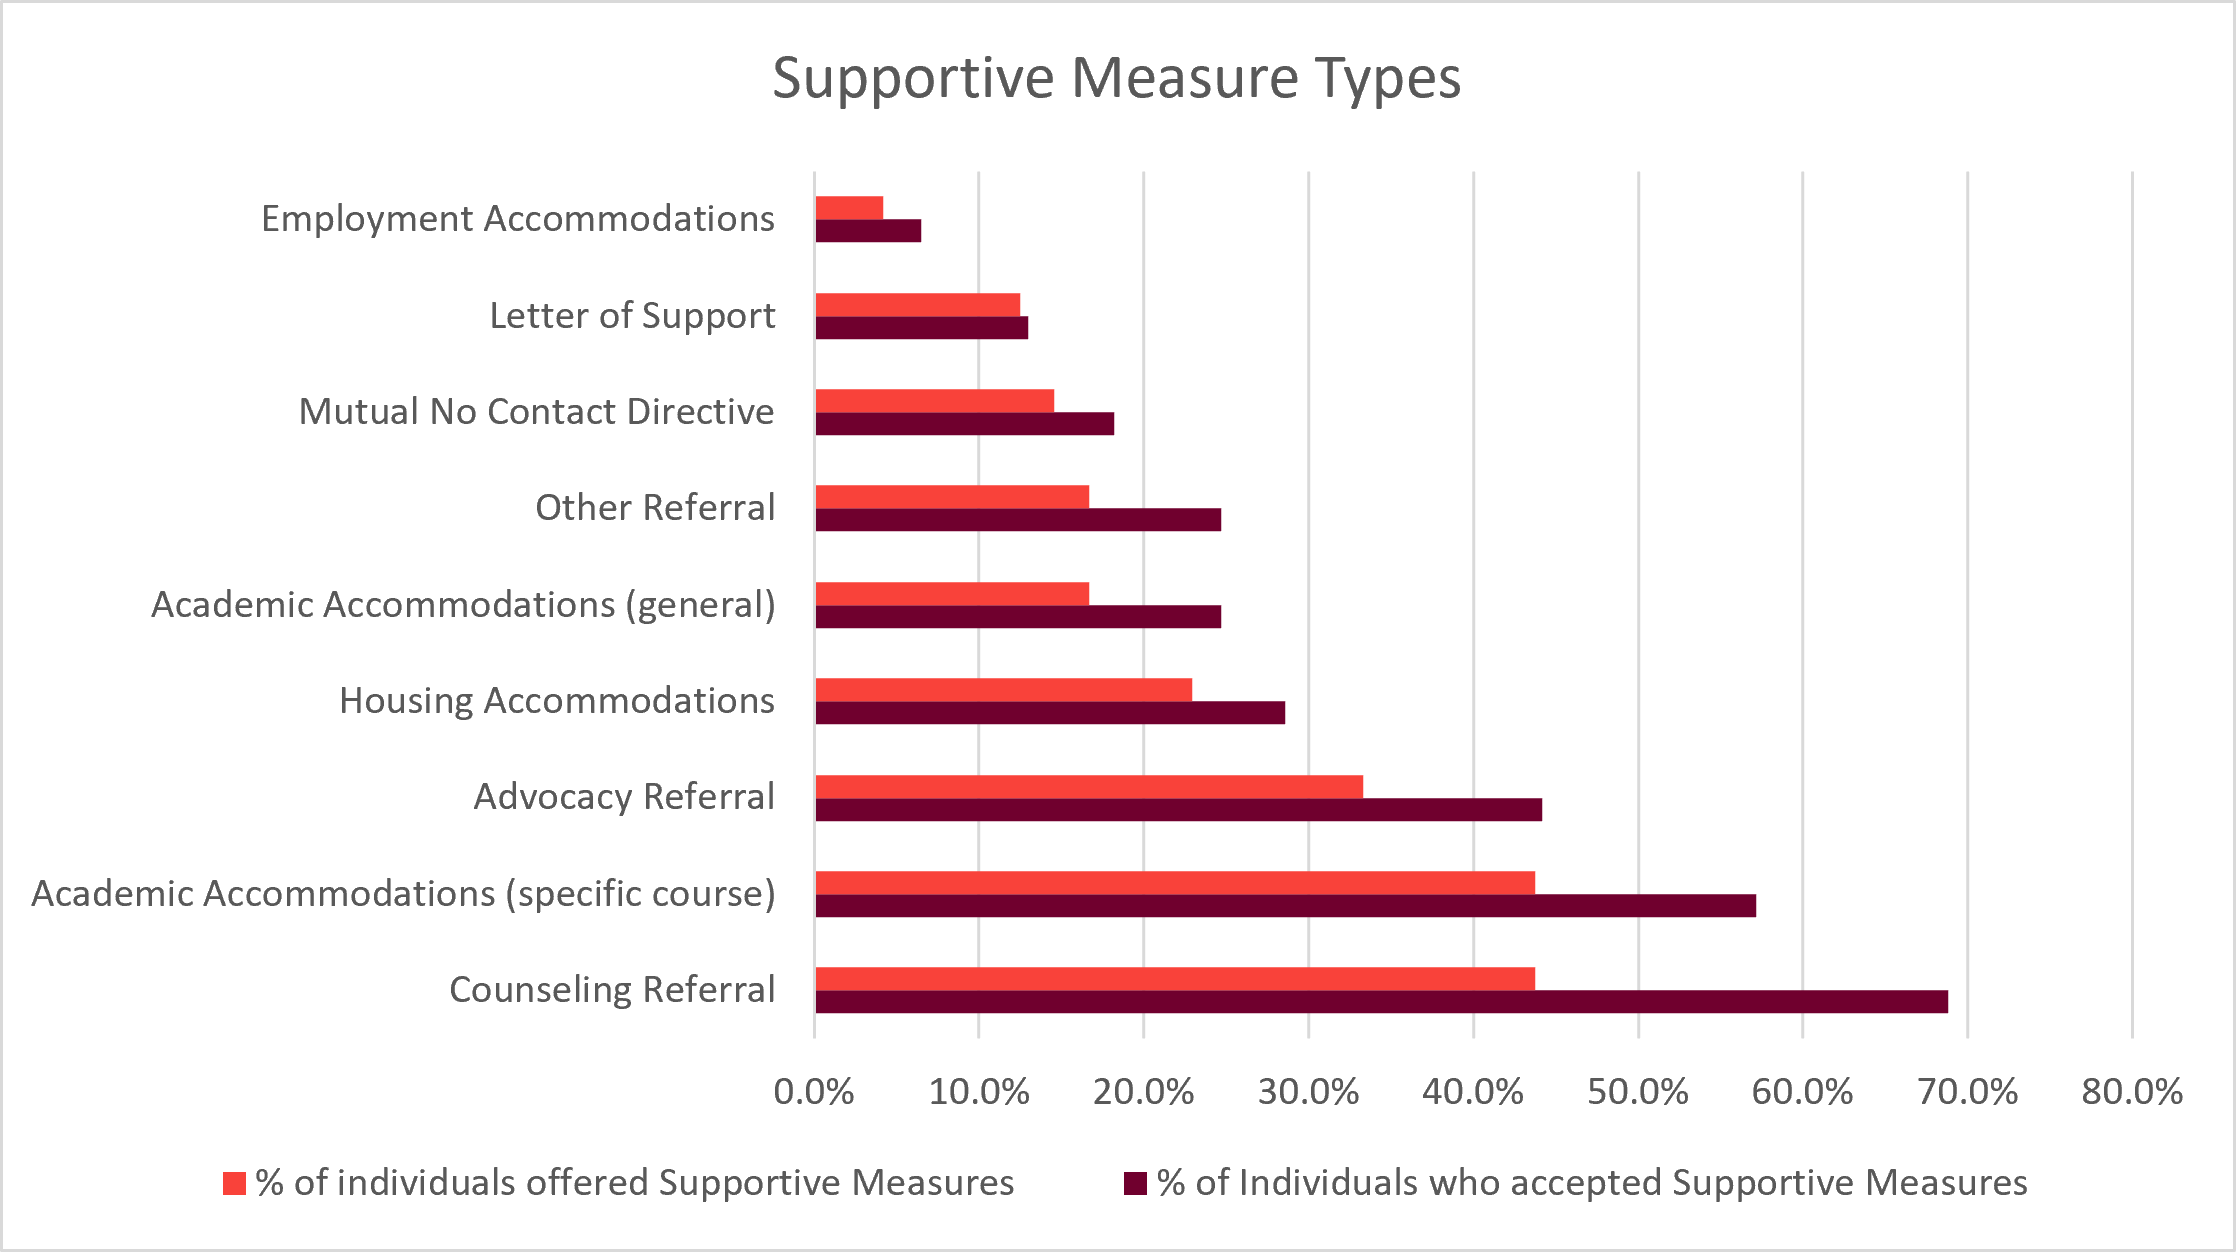
Supportive Measure Type Breakdown of Accepted, Declined, and Not Accepted Offered, but Declined Accepted Not Offered Counseling Referral 68.8% 27.3% 3.9% Academic Accommodations (specific course) 57.1% 27.3% 15.6% Advocacy Referral 44.2% 20.8% 35.1% Housing Accommodations 28.6% 14.3% 57.1% Academic Accommodations (general) 24.7% 10.4% 64.9% Other Referral 24.7% 10.4% 64.9% Mutual No Contact Directive 18.2% 9.1% 72.7% Letter of Support 13.0% 7.8% 79.2% Employment Accommodations 6.5% 2.6% 90.9% -
Faculty Matters is one of CRP's newer case types, and subtype tracking for it wasn't fully in place until FY26, so this breakdown is shown for FY26 only rather than as a multi-year trend. As more years of consistent tracking become available, this will grow into a longitudinal view like the tables above.
Within FY26, Faculty Misconduct was by far the most common subtype, accounting for about two-thirds of all Faculty Matters cases. Employment Contracts was a distant second, making up about a quarter of cases. Faculty Evaluation Process, Conflict of Interest, and Program/Curriculum each made up a small share of the remaining cases.
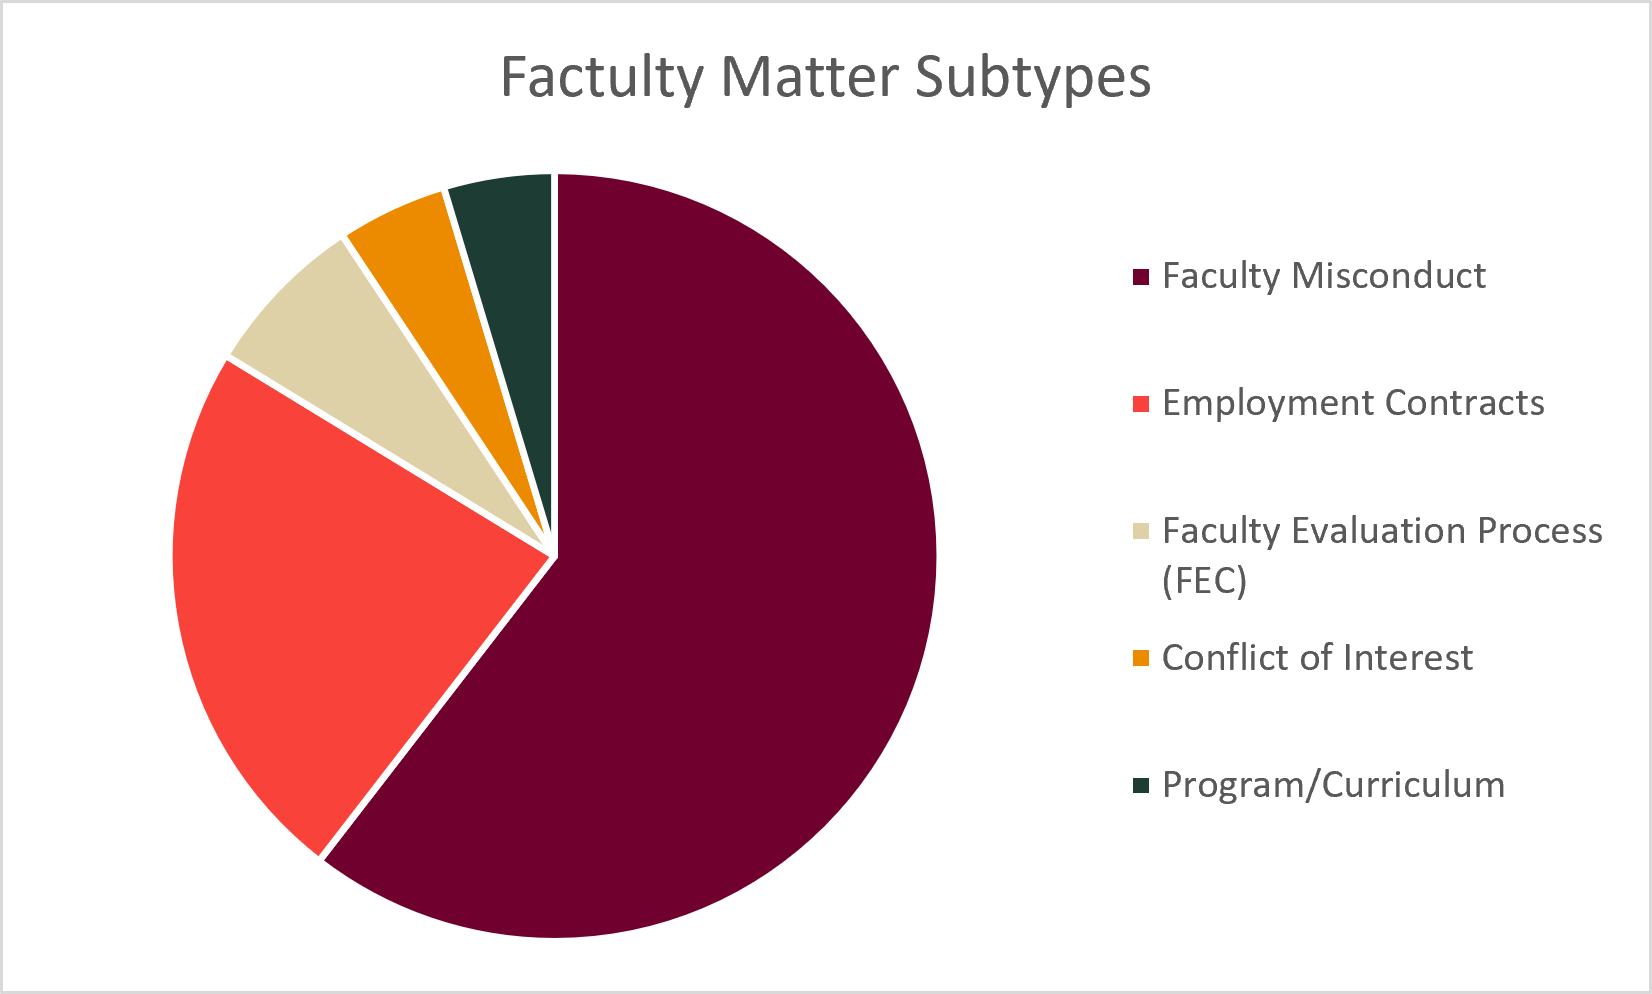
Faculty Matters Subtypes in FY26 FY26 Faculty Misconduct 65.0% Employment Contracts 25.0% Faculty Evaluation Process (FEC) 7.5% Conflict of Interest 5.0% Program/Curriculum 5.0% -
Institutional Conflict cases are grouped into three subtypes. Employee-Involved means all parties in the conflict are employees. Student-Involved means at least one party is a student, which includes conflicts between a student and an advisor or instructor, not only conflicts between students. Data Dispute is a separate, smaller category covering disputes over institutional data. A case can be counted under more than one group if it genuinely involves both, so these percentages can add up to more than 100% and aren't meant to be read as parts of a whole. This breakdown is available for FY24 through FY26 only, since Institutional Conflict wasn't formally tracked as its own case type before then.
Employee-Involved matters have consistently made up the majority of Institutional Conflict cases and have grown more dominant over time, rising from about two-thirds of cases in FY24 to roughly four-fifths in FY26. Student-Involved matters have moved in the opposite direction, declining from about 41% of cases in FY24 to a much smaller share by FY26. Data Dispute cases have remained a small share of the total throughout, though that share has grown gradually each year.
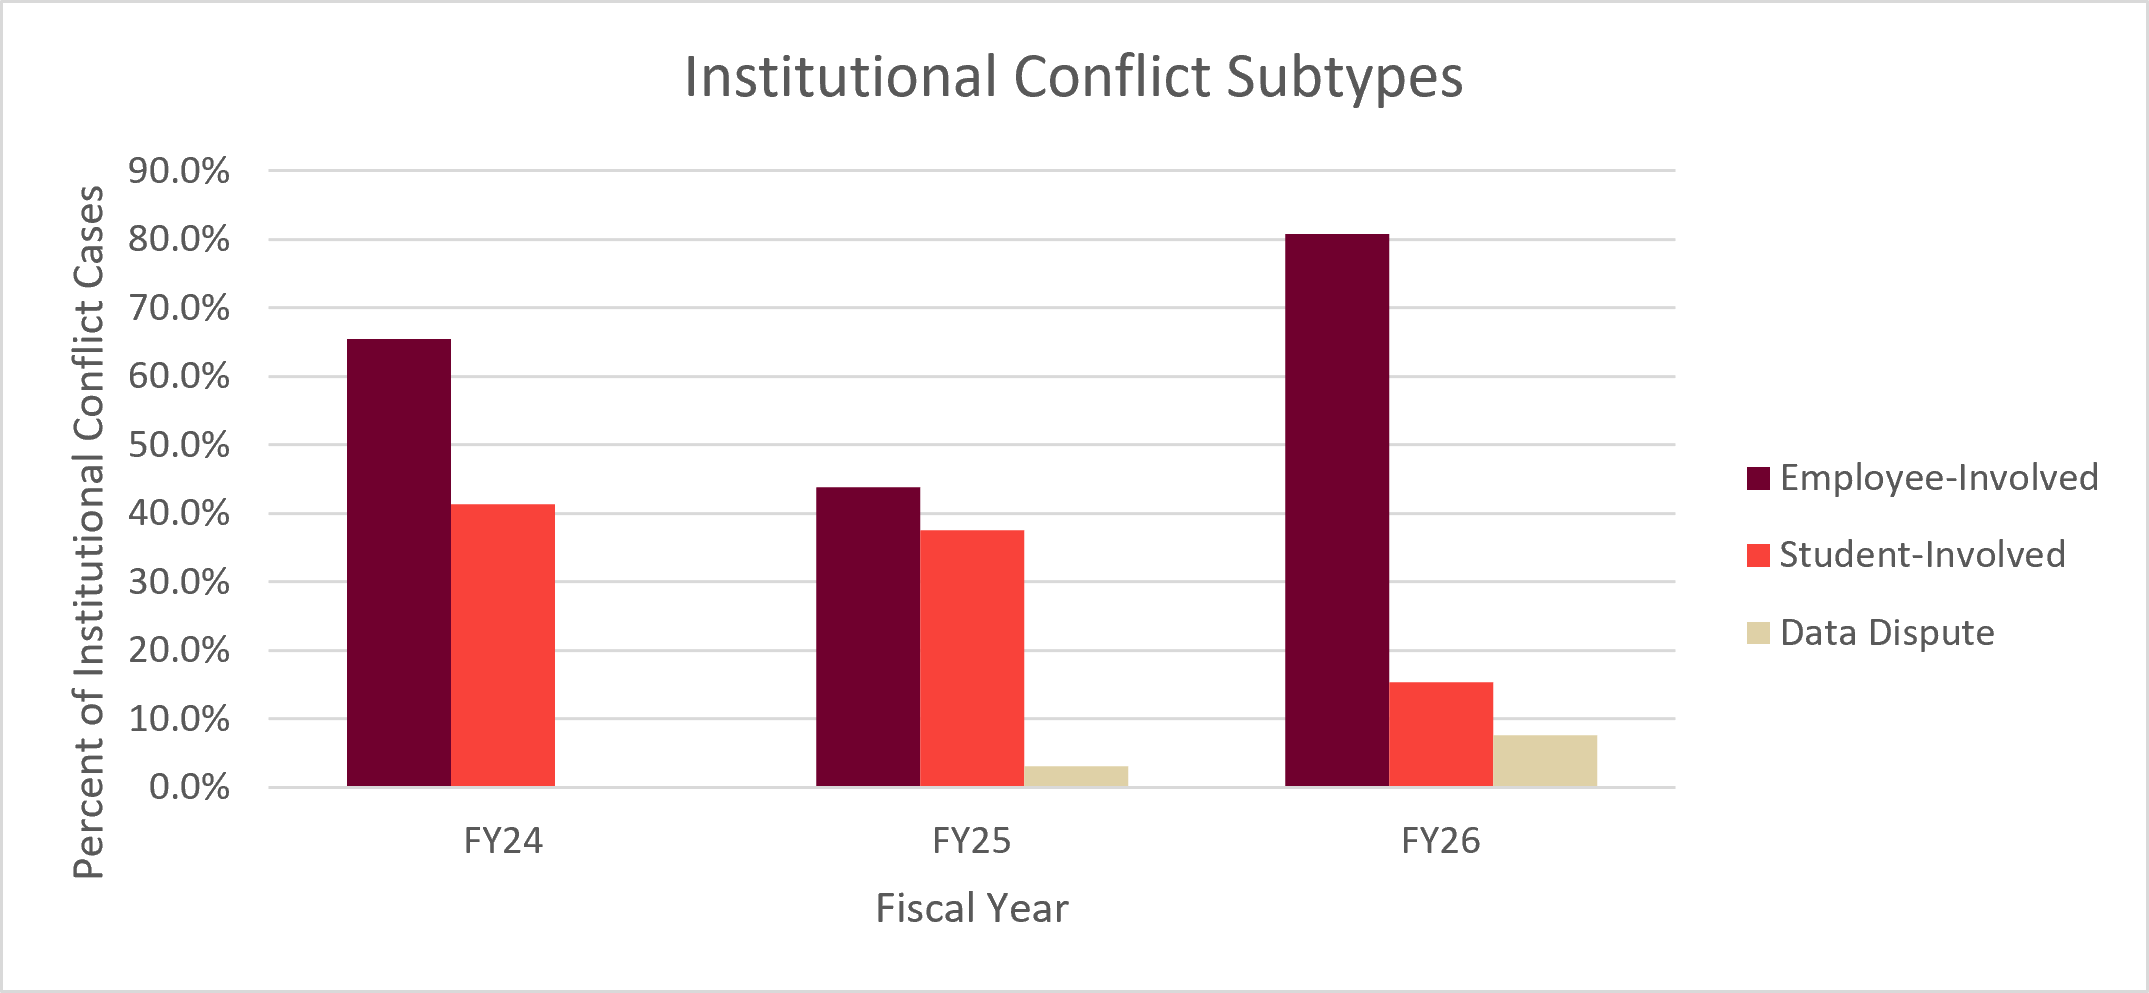
Institutional Subtypes by Fiscal Year FY24 FY25 FY26 Employee-Involved 65.5% 43.8% 80.8% Student-Involved 41.4% 37.5% 15.4% Data Dispute 0.0% 3.1% 7.7% -
This table shows who referred non-EO/Title IX matters, meaning Faculty Matters, Institutional Conflict, and other case types outside Sexual Harassment and Discrimination, to CRP. Case volume for this table is notably lower in FY22 and FY23 than in later years, so year-to-year comparisons in the earliest years should be read with some caution.
UM Employee has generally been the largest referral source, though its share has varied more from year to year than in the EO/Title IX table, ranging from under a fifth of referrals in FY22 up to about two-thirds in FY23. UM Student and UM Housing have each made up a meaningful but more modest share of referrals across most years.
FY26 stands out with the introduction of Academic Unit/College as a new referral source, reflecting that colleges began being tracked individually that year rather than being folded into other categories. This new source quickly became one of the largest referral sources in FY26, making up over a third of referrals, and its introduction also explains why other categories, particularly UM Employee, show a smaller share of the total that year even as CRP's overall non-EO/Title IX caseload continued to grow. The "Other" category, covering smaller or less common referral sources, has fluctuated across the period without a clear directional trend.
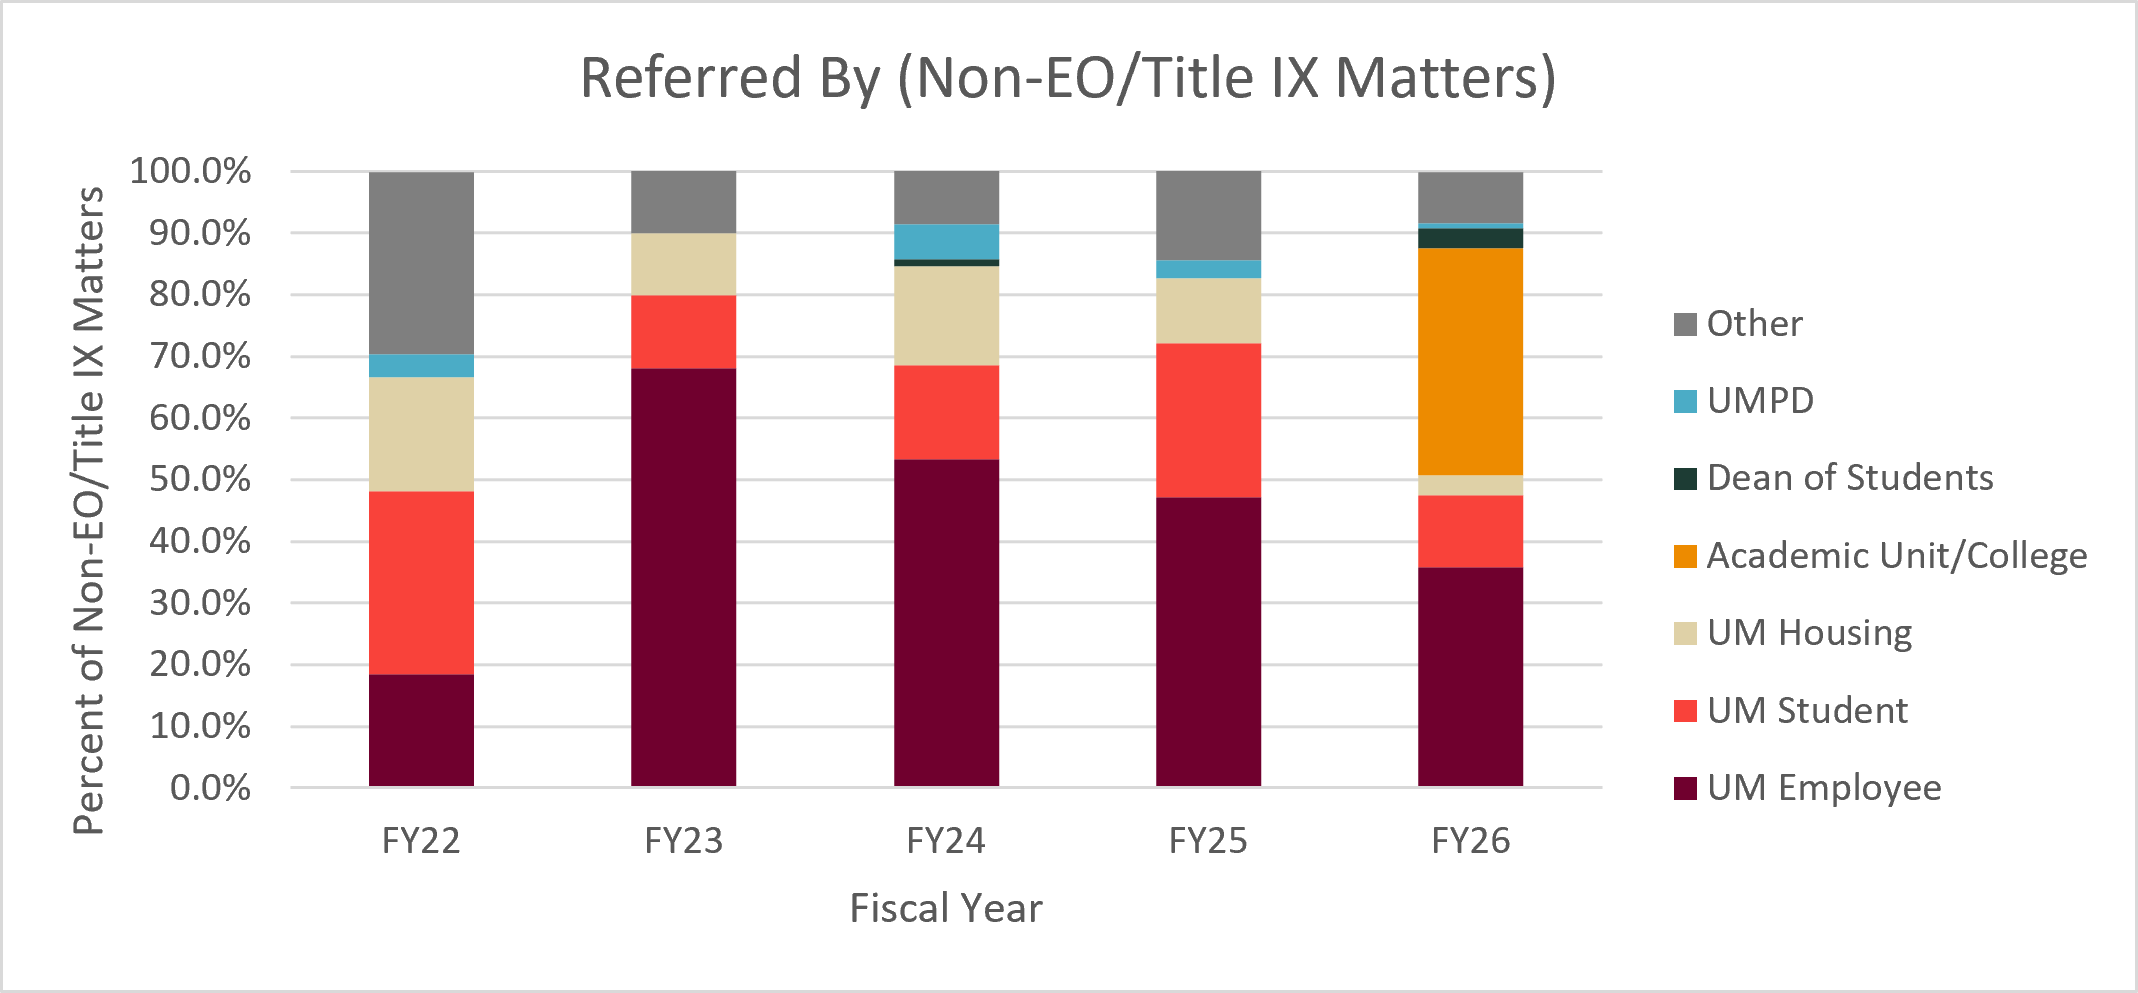
Referral Source by Fiscal Year FY22 FY23 FY24 FY25 FY26 UM Employee 18.5% 68.0% 53.3% 47.1% 35.8% UM Student 29.6% 12.0% 15.2% 25.0% 11.7% UM Housing 18.5% 10.0% 16.2% 10.6% 3.3% Academic Unit/College 0.0% 0.0% 0.0% 0.0% 36.7% Dean of Students 0.0% 0.0% 1.0% 0.0% 3.3% UMPD 3.7% 0.0% 5.7% 2.9% 0.8% Other 29.6% 10.0% 8.6% 14.4% 8.3% -
This table shows how non-EO/Title IX matters, meaning Faculty Matters, Institutional Conflict, and other case types outside Sexual Harassment and Discrimination, were resolved. Case volume for this table is notably lower in FY22 and FY23 than in later years, so those two years should be read with some caution.
No Action means the matter did not meet jurisdiction, or the reporting party asked that no action be taken. No Action made up the large majority of resolutions in FY22 and FY23, as the vast majority of non-EO/Title IX matters were outside CRP's scope at the time, but its share has declined sharply since, falling to about 26% by FY26.
Case Referral means CRP determined it did not have jurisdiction over the matter and referred it elsewhere on the reporting party's behalf. This category was essentially nonexistent in FY22 and FY23, but has grown substantially since, reaching about 22% of resolutions by FY26.
Informal Action means CRP provided guidance or an informal intervention short of a formal process. This category has grown substantially as well, from under 10% of resolutions in FY22 and FY23 to about half of resolutions by FY26, making it the most common resolution type in recent years.
Formal Proceedings means the matter proceeded to a formal process, such as an investigation or a performance management action. This category has remained a small share of resolutions throughout.
Read together, the decline in No Action alongside the rise in Case Referral reflects a deliberate shift in how CRP handles matters outside its jurisdiction. Rather than simply closing a case as no action, CRP has increasingly taken on the work of referring the matter to the appropriate office on the reporting party's behalf, so the reporting party doesn't have to navigate that step alone.
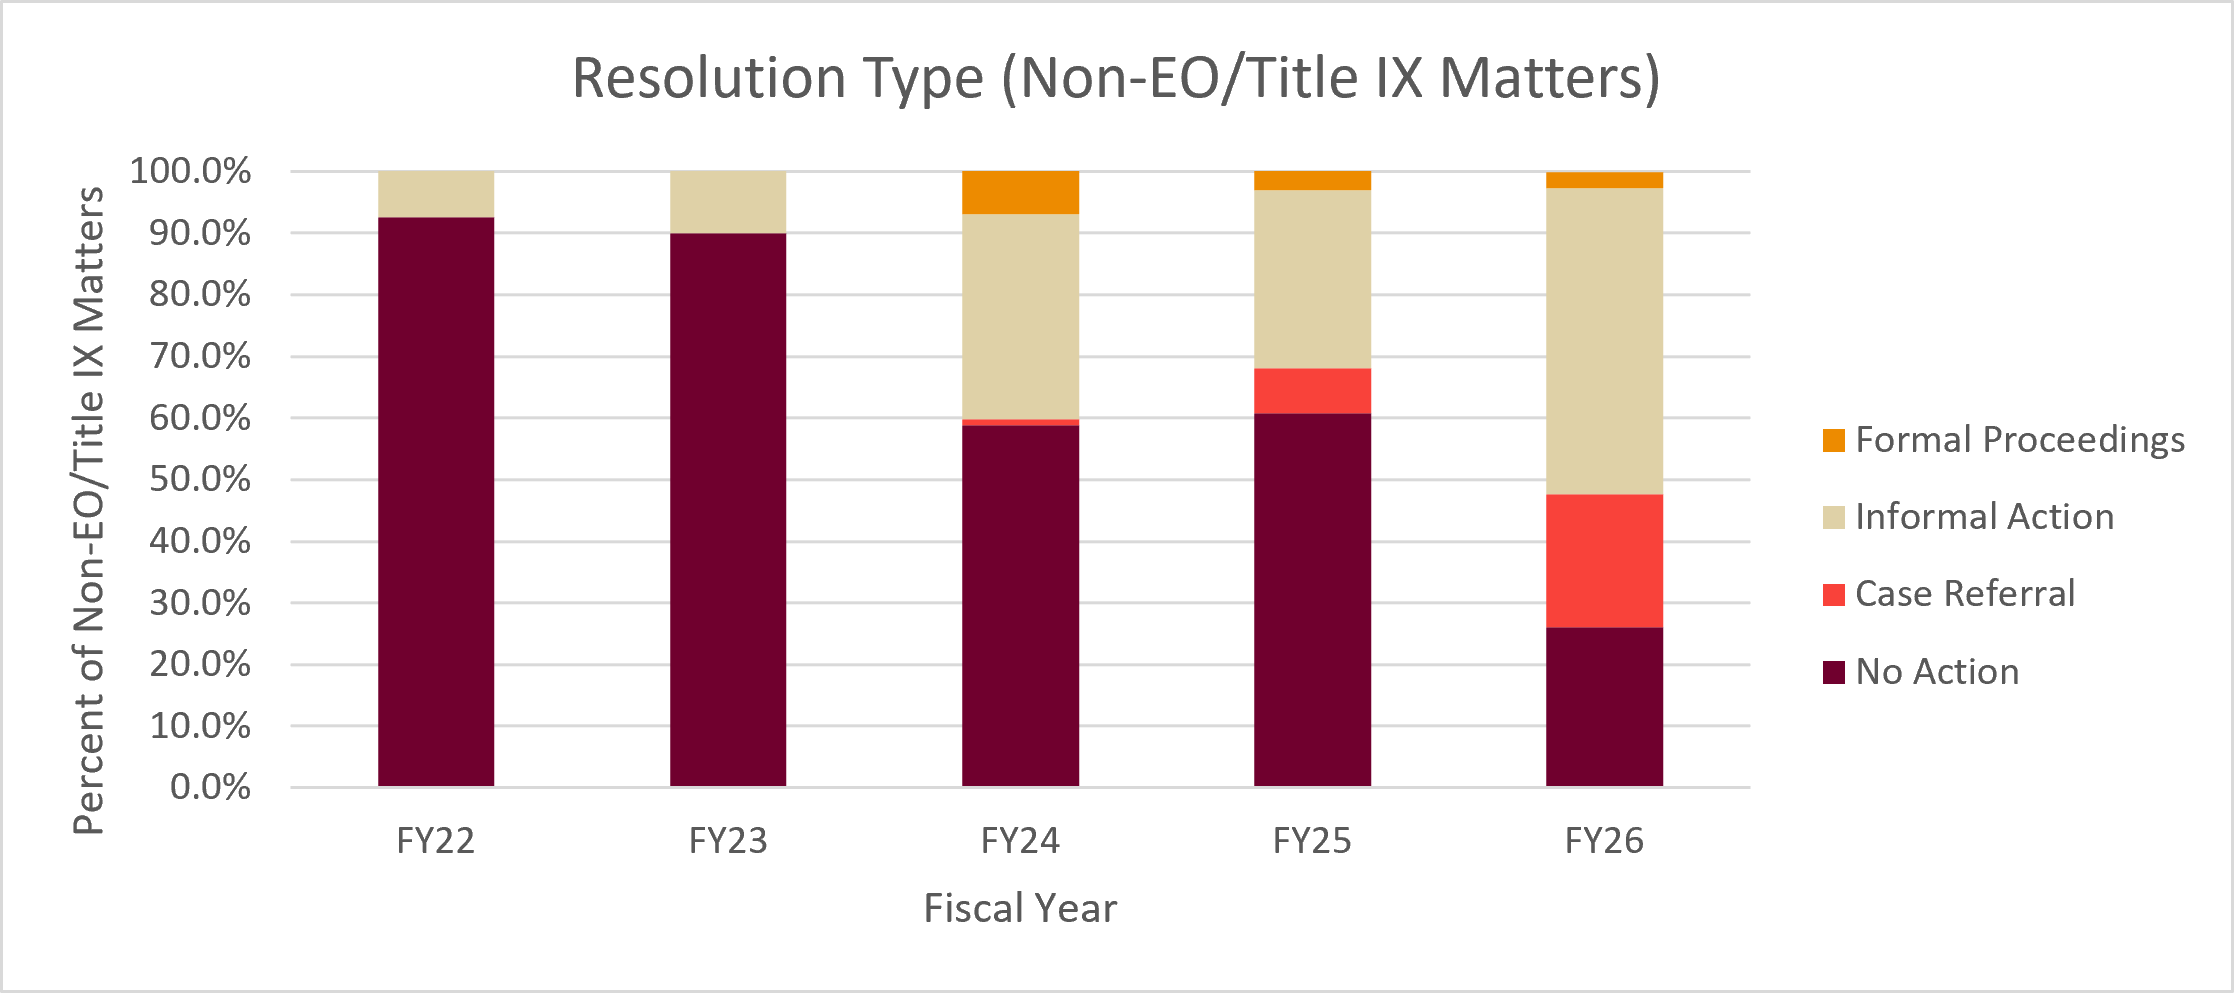
Resolution Type by Fiscal Year FY22 FY23 FY24 FY25 FY26 No Action 92.6% 90.0% 58.8% 60.8% 26.1% Case Referral 0.0% 0.0% 1.0% 7.2% 21.6% Informal Action 7.4% 10.0% 33.3% 28.9% 49.5% Formal Proceedings 0.0% 0.0% 6.9% 3.1% 2.7%