MPA Graduation Rates and Employment
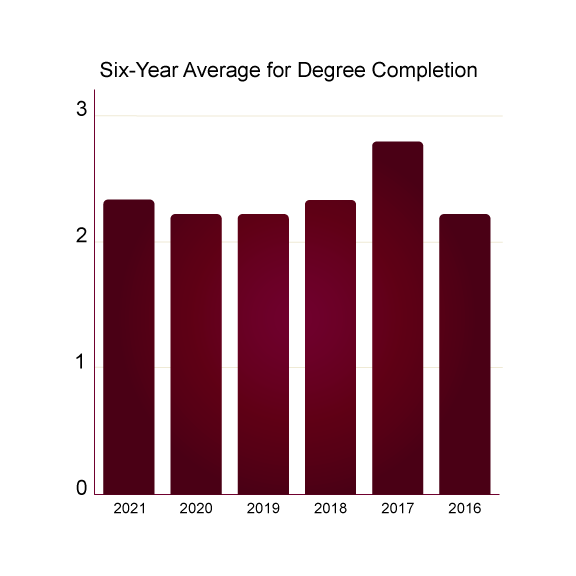
 The MPA degree is designed for students to complete their degree in two years (four semesters). Our students, however, have the option to take coursework at their own pace. Over the last six years, it takes our students an average of 2.31 years to complete the MPA degree.
Six-Year Average for Degree Completion
|
Year |
Average Years for Degree Completion |
|
2021 |
2.3 |
|
2020 |
2.2 |
|
2019 |
2.2 |
|
2018 |
2.3 |
|
2017 |
2.7 |
|
2016 |
2.2 |
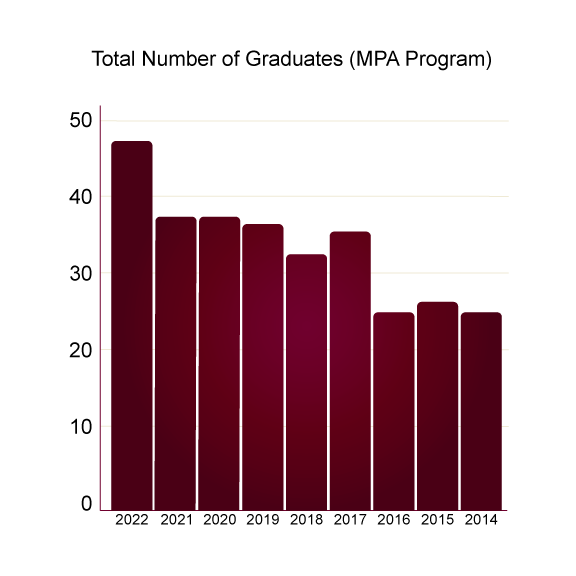
Total Number of Graduates
|
Year |
Number of Graduates |
|
2022 |
47 |
|
2021 |
37 |
|
2020 |
37 |
|
2019 |
36 |
|
2018 |
32 |
|
2017 |
35 |
|
2016 |
24 |
|
2015 |
26 |
|
2014 |
24 |
Graduation Rates In Perspective
How Many MPA students entered the program in 2015-2016 academic year and graduated?
| Initially Enrolled | Graduated Withing 2 Years | Graduated Within 3 Years | Graduated Within 4 Years | Total Students Graduated/Persisting to Graduation |
| 26 | 14 | 21 | 0 | 21 |
Employment
Where are our 2021-22 graduates?
|
Employed full-time in the private sector |
6 |
|
Employed full-time in the nonprofit sector |
8 |
|
Employed full-time in the public sector (federal government) |
1 |
|
Employed part-time in the private sector |
3 |
|
Employed part-time in the nonprofit sector |
2 |
|
Employed part-time in the public sector |
1 |
|
Employed full-time in the public sector (local government) |
3 |
|
Employed full-time in the public sector (state government) |
16 |
|
Unpaid intern |
1 |
|
Looking for work |
1 |
|
Other |
0 |
|
Military |
0 |
|
Self-employed |
0 |
|
Pursuing further education |
5 |