
Project Summary
As part of the MODIS global terrestrial evapotranspiration project, the goal of the Drought Severity Index (DSI) is to use satellite remote sensing data to monitor and detect drought on Earths land surface. The DSI enhances near-real-time drought monitoring capabilities that can assist decision makers in regional drought assessment and mitigation efforts, but without many of the constraints of more traditional drought monitoring methods.
The remotely-sensed DSI uses operational global land products derived from NASA satellite observations, namely the MODIS terrestrial evapotranspiration (ET) and vegetation greenness products. ET is a metric of ecosystem functional status and is directly related to the water, carbon and energy cycles of the land surface. The ratio of ET to potential ET (PET) is commonly used as an indicator of terrestrial water availability and associated wetness or drought. Satellite vegetation greenness indices (VIs), especially the Normalized Difference VI (NDVI), can potentially link climate changes (e.g. increasing frequency and severity of drought) and vegetation responses with land-atmosphere water, carbon and energy fluxes, and associated climate feedbacks (Atkinson et al., 2011). The DSI incorporates NDVI and the ratio of ET to PET into a single index theoretically ranging from unlimited negative values (drier than normal) to unlimited positive values (wetter than normal). More detailed information on the DSI can be found on Scholar Works
Main Data Inputs
- Evapotranspiration and potential evapotranspiration from the MODIS MOD16 evapotranspiration data product
- Normalized Difference Vegetation Index from the MODIS MOD13 vegetation indices product
Key Datasets
The DSI dataset for Earths entire 109.03 million km2 global vegetated land surface from 2000 - 2011 at 8-day and annual time intervals, and 0.5 and 0.05 degree spatial resolution. Future years will be produced and posted periodically, but not in real time.
Images
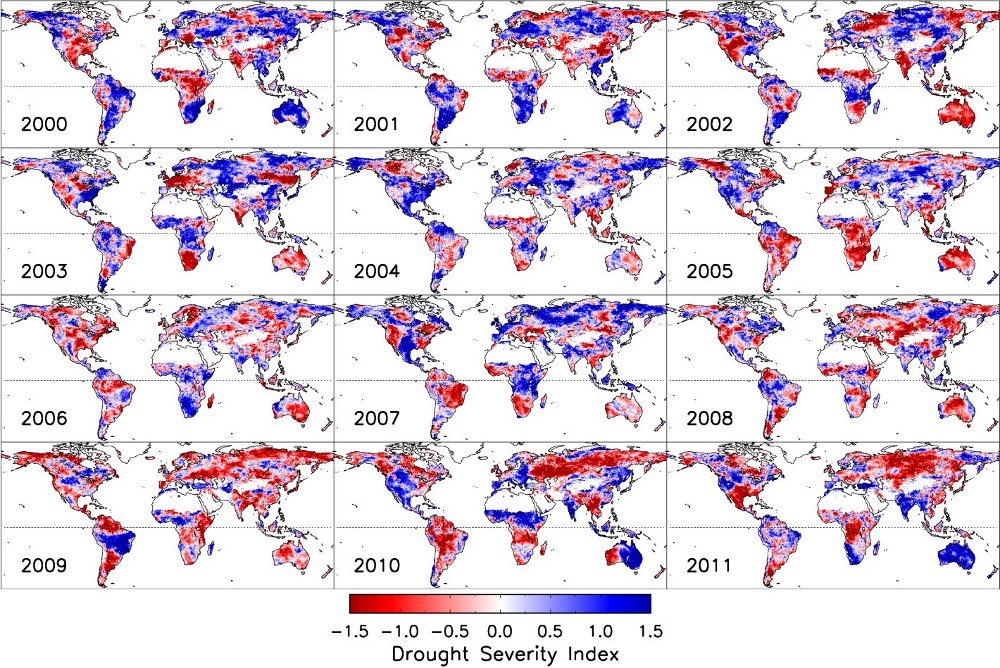
Annual global terrestrial Drought Severity Index (DSI) data over the 2000-2011 MODIS record. The DSI ranges theoretically from unlimited negative values to unlimited positive values for respective dry to wet climate deviations from prevailing conditions.
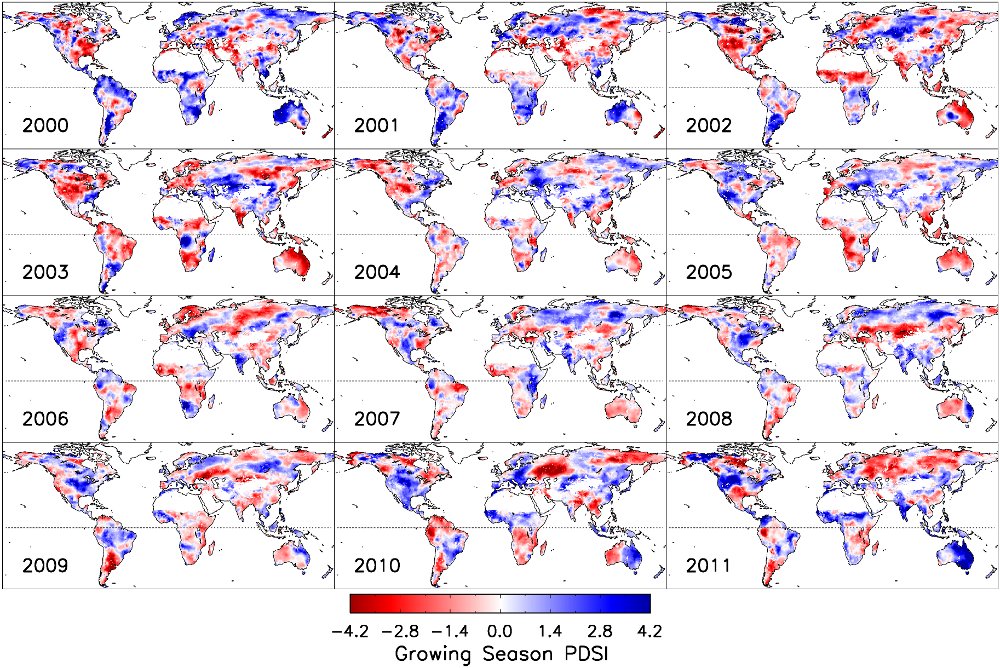
Annual global Palmer Drought Severity Index (PDSI) data over the 2000-2011 MODIS record. The PDSI ranges theoretically from unlimited negative values to unlimited positive values for respective dry to wet climate deviations from prevailing conditions.
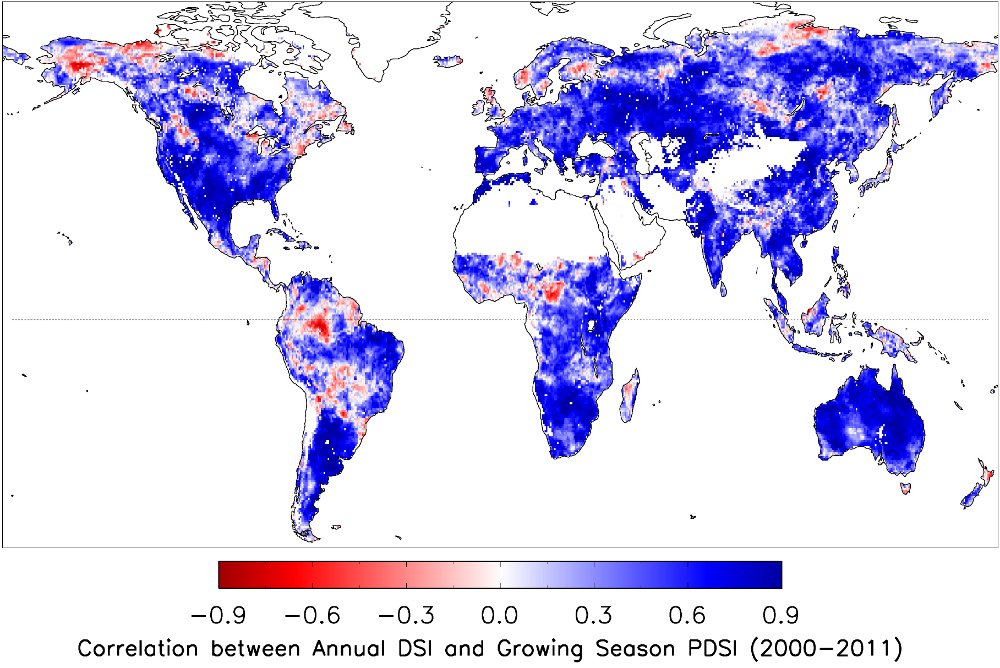
Spatial correlation coefficient between 12-year annual global DSI and precipitation data (Chen et al., 2002) from 2000-2011.
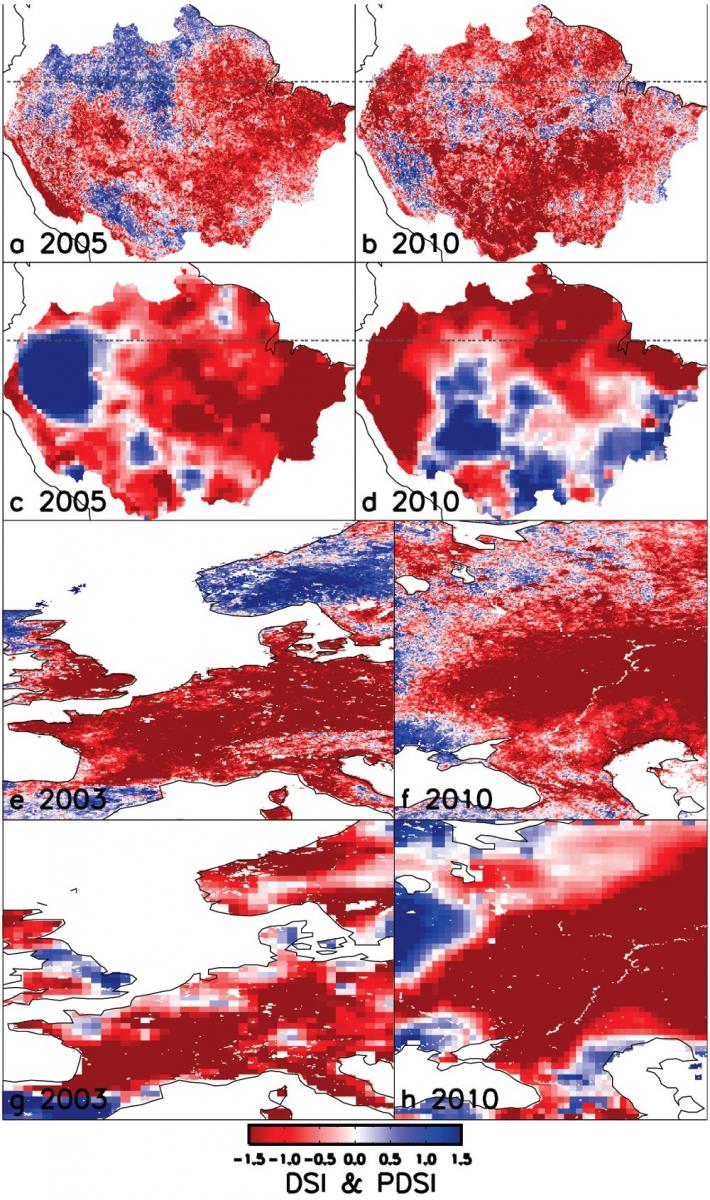
Spatial patterns of annual DSI (a, b, e, f) and growing-season PDSI (c, d, g, h) for selected sub regions, including the Amazon (the region as in Lewis et al., 2011) in 2005 (a, c) and 2010 (b, d), western Europe (40°N ~ 66.5°N and -5°E ~ 15°E) in 2003 (e, g), and western Russia (40°N ~ 66.5°N and 30°E ~ 55°E) in 2010 (f, h).
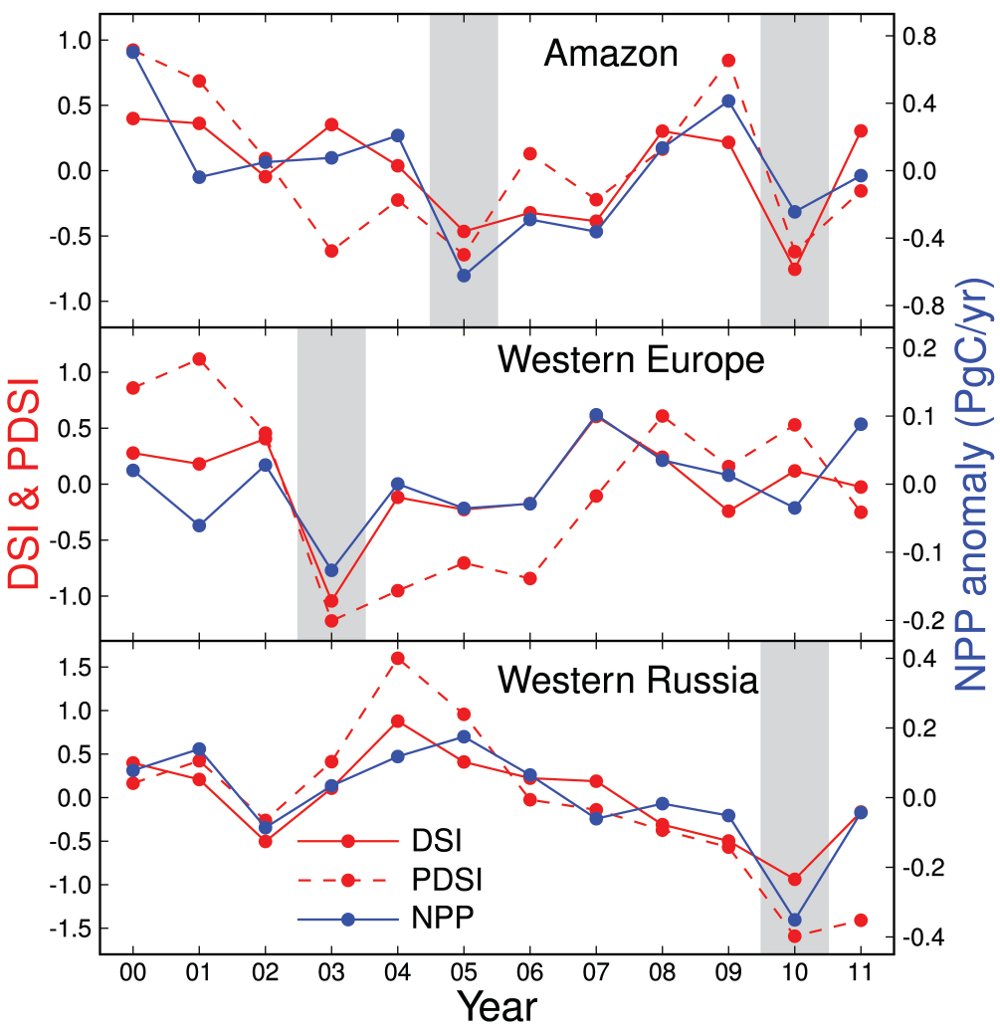
Annual DSI, growing-season PDSI and MODIS (MOD17) NPP data for selected sub regions, including the Amazon (the region as in Lewis et al., 2011), western Europe (40°N ~ 66.5°N and -5°E ~ 15°E) and western Russia (40°N ~ 66.5°N and 30°E ~ 55°E) regions, and 2000-2011 period. Vertical grey bars denote years with documented droughts within each region.
Selected Publications
A Remotely Sensed Global Terrestrial Drought Severity Index;Mu, Q., M. Zhao, J. S. Kimball, N. G. McDowell, S. W. Running (2013) Bulletin of the American Meteorological Society, 01/2013, Volume 94, Issue 1, Number 1, p.83.98, DOI:10.1175/BAMS-D-11-00213.1
Development of a global evapotranspiration algorithm based onMODIS and global meteorology data Mu, Q., F.A. Heinsch, M. Zhao, S.W. Running (2007) Remote Sensing of Environment, 111, 519-536 (doi: 10.1016/j.rse.2007.04.015)
Improvements to a MODIS Global Terrestrial Evapotranspiration Algorithm Mu, Q., M. Zhao, S. W. Running (2011) Remote Sensing of Environment, Volume 115, pages 1781-1800 (doi:10.1016/j.rse.2011.02.019)
Drought-induced reduction in global terrestrial net primary production from 2000 through 2009 Zhao, M., S. W. Running (2010) Science, 329: 940-943.
Improvements of the MODIS terrestrial gross and net primary production global data set Zhao, M., F. A. Heinsch, R. R. Nemani, and S. W. Running. (2005) Remote Sensing of Environment, 95: 164.176.
Sensitivity of Moderate Resolution Imaging Spectroradiometer (MODIS) terrestrial primary production to the accuracy of meteorological reanalyses Zhao, M., S. W. Running, and R. R. Nemani. (2006) Journal of Geophysical Research, 111, G01002, doi:10.1029/2004JG000004.
NTSG Personnel
- Qiaozhen Mu
- Maosheng Zhao
- John Kimball
- Steve Running