
Project Summary
This project is part of NASA/EOS project to estimate global terrestrial evapotranspiration from earth land surface by using satellite remote sensing data. MOD16 global evapotranspiration product can be used to calculate regional water and energy balance, soil water status; hence, it provides key information for water resource management. With long-term ET data, the effects of changes in climate, land use, and ecosystems disturbances (e.g. wildfires and insect outbreaks) on regional water resources and land surface energy change can be quantified.
The MOD16 global evapotranspiration (ET)/latent heat flux (LE)/potential ET (PET)/potential LE (PLE) datasets are regular 1-km2 land surface ET datasets for the 109.03 Million km2 global vegetated land areas at 8-day, monthly and annual intervals. The dataset covers the time period 2000 - 2010. Future years will be produced and posted periodically, but not in near-real time.
The MOD16 ET datasets are estimated using Mu et al.s improved ET algorithm (2011) over previous Mu et al.s paper (2007a). The ET algorithm is based on the Penman-Monteith equation (Monteith, 1965). Surface resistance is an effective resistance to evaporation from land surface and transpiration from the plant canopy.
Terrestrial ET includes evaporation from wet and moist soil, from rain water intercepted by the canopy before it reaches the ground, and the transpiration through stomata on plant leaves and stems. Evaporation of water intercepted by the canopy is a very important water flux for ecosystems with a high LAI. Canopy conductance for plant transpiration is calculated by using LAI to scale stomatal conductance up to canopy level. For many plant species during growing seasons, stomatal conductance is controlled by vapor pressure deficit (VPD) (Oren et al., 1999; Mu et al., 2007b; Running Kimball, 2005) and daily minimum air temperature (Tmin). Tmin is used to control dormant and active growing seasons for evergreen biomes. High temperatures are often accompanied by high VPDs, leading to partial or complete closure of stomata. For a given biome type, two threshold values for Tmin and VPD are listed in the Biome-Property-Look-Up-Table (BPLUT) to control stomatal conductance (Mu et al., 2007a; 2009; 2011).
MOD16 products includes 8-day, monthly and annual ET, LE, PET, PLE and 8-day, annual quality control (ET_QC). The 8-day MOD16A2 QC field is inherited from MOD15A2 in the same period. However, the cloud-contaminated FPAR/LAI has been temporally filled with those having good QC. For annual QC of MOD16A3 products, we used the method proposed by Zhao et al. (2005) to define a more meaningful annual ET QC as
QC=100.0 X NUg/Totalg
where NUg is the number of days during growing season with unreliable or missing MODIS LAI inputs, and Totalg is total number of days in the growing season. The growing season is defined as all days with Tmin above the value where stomata close as in the BPLUT. The MOD16 ET algorithm has a good performance in generating global ET data products, providing critical information on global terrestrial water and energy cycles and environmental changes (Mu et al., 2007a, 2009, 2011).
Note: For some pixels in African rainforest, the MODIS albedo data from MCD43B2/MCD43B3 have no cloud free data throughout an entire year. As a result, corresponding fill values of ET/LE/PET/PLE are assigned for these pixels in that year.
Documentation
Release Notes:
The 8-day ET (0.1mm/8days or 0.1mm/5days) is the sum of ET during these 8-day time periods (5 days for 361 composite data in 2001, 2002, 2003, 2005, 2006, 2007, 2009, 2010, 6 days for 361 in 2000, 2004, 2008). The monthly ET (0.1mm/month) is the sum of monthly ET. For February, there are 29 days in a leap year and 28 days in normal years. The annual ET (0.1mm/yr) is the sum of the ET during each year. There are 366 days in 2000, 2004, 2008, and 365 days in 2001, 2002, 2003, 2005, 2006, 2007, 2009, 2010. The 8-day, monthly and annual LE/PLE (1.0e4 J/m2/day) is the average daily LE/PLE over the corresponding time period.
The users should multiply 0.1 to get the real ET/PET values in mm/8day or mm/month, or mm/yr, and 1.0e4 to get LE/PLE in J/m2/day.
For the 8-day and monthly ET/LE/PET/PLE, annual LE/PLE, the valid value range is -32767-32700.
Fill value, out of the earth 32767
Water body 32766
Barren or sparsely vegetated 32765
Permanent snow and ice 32764
Permanent wetland 32763
Urban or Built-up 32762
Unclassified 32761
For the annual ET/PET, the valid value range is 0- 65500.
Fill value, out of the earth 65535
Water body 65534
Barren or sparsely vegetated 65533
Permanent snow and ice 65532
Permanent wetland 65531
Urban or Built-up 65530
Unclassified 65529
Images
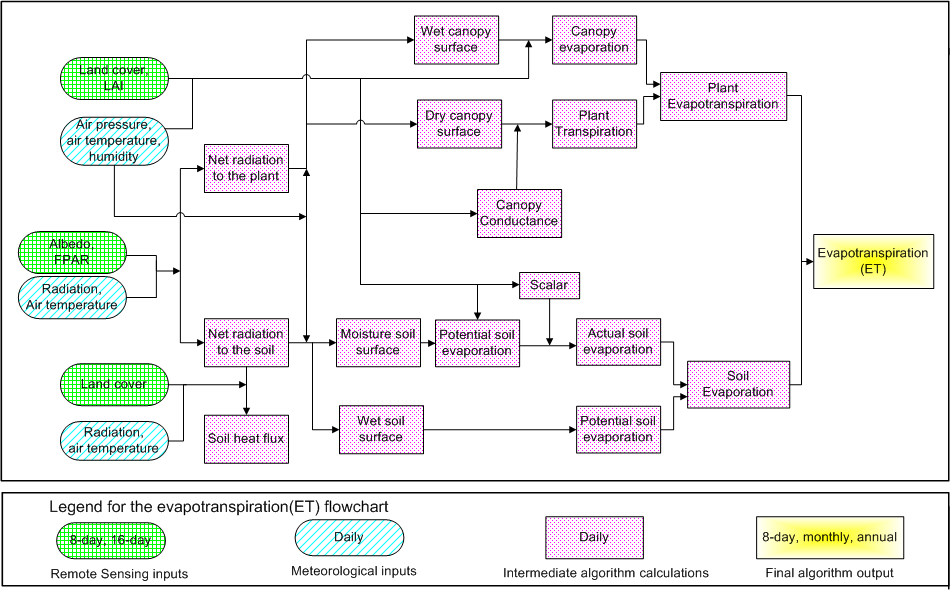
Flowchart showing the logic behind MOD16 ET Algorithm for calculating daily MODIS ET (Mu et al., 2011):
Flux Tower Validation
Evapotranspiration by vegetation type:

Global Evapotranspiration
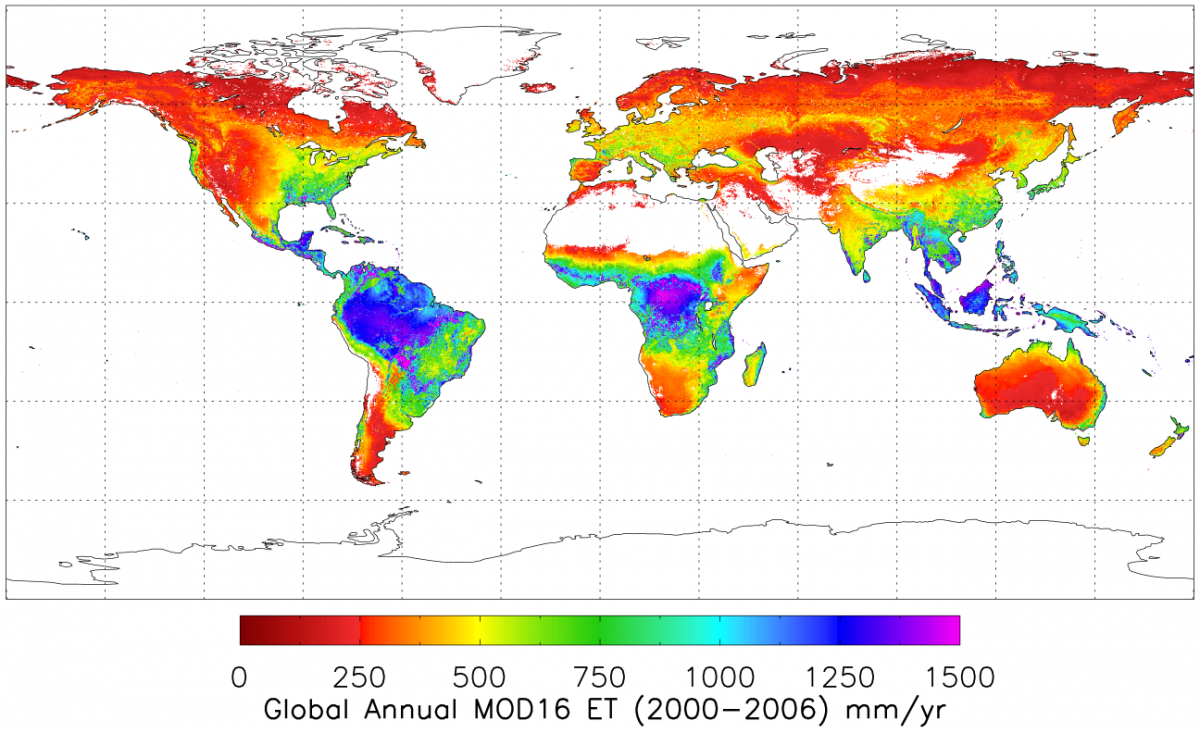
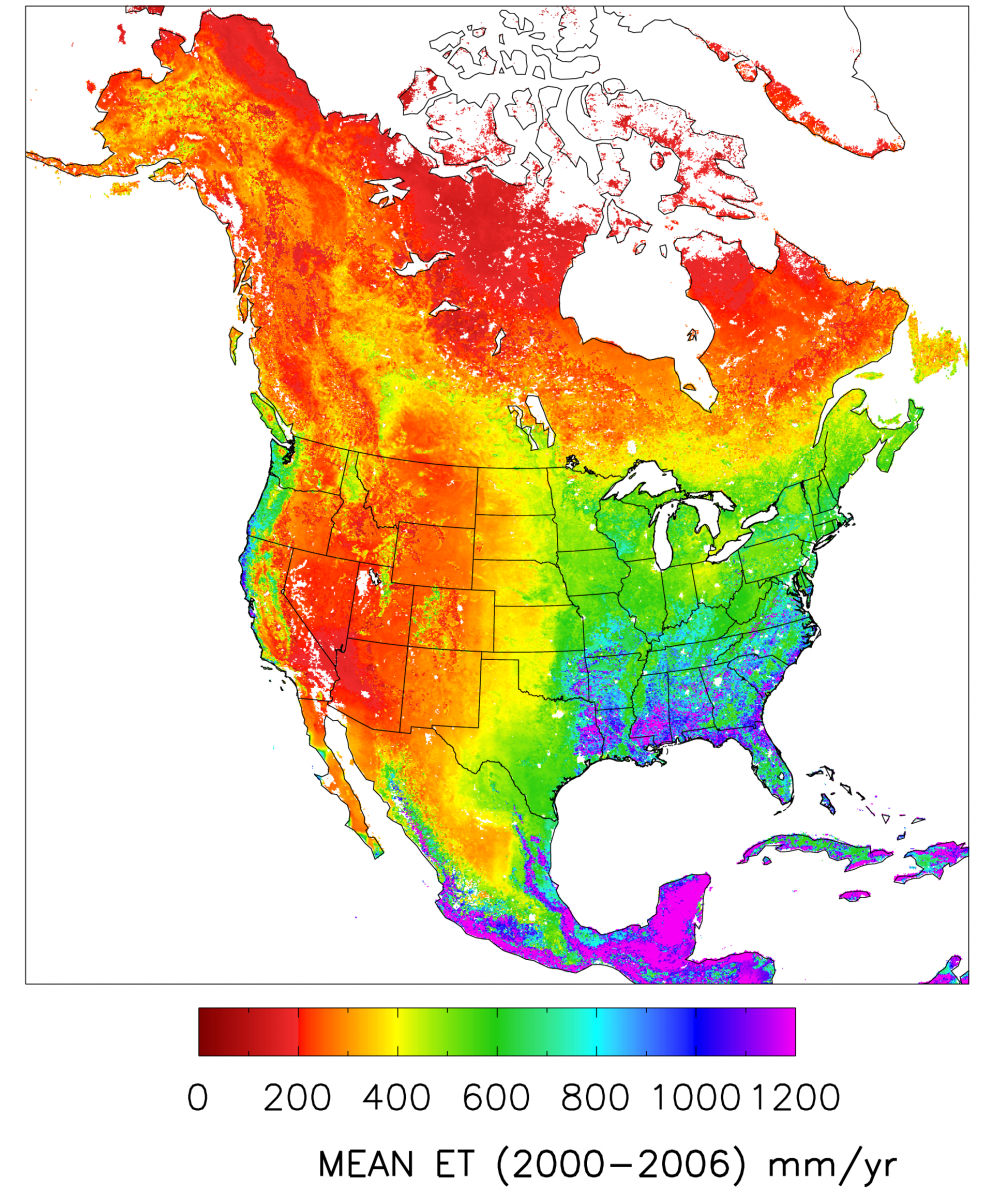
Global Average ET over 2000-2006:
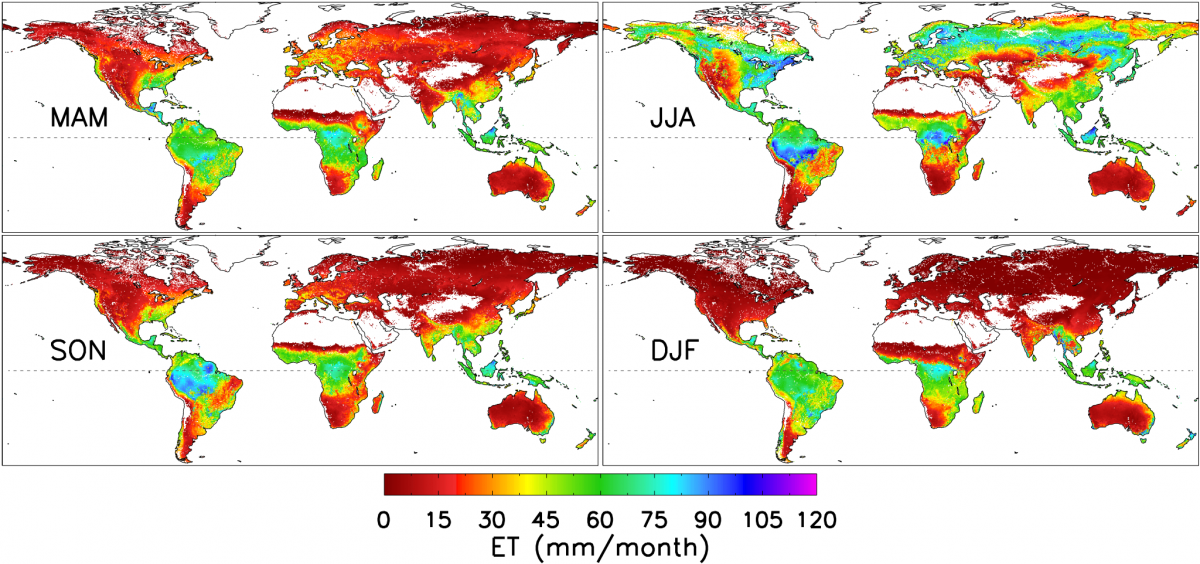
Seasonality of Global ET:
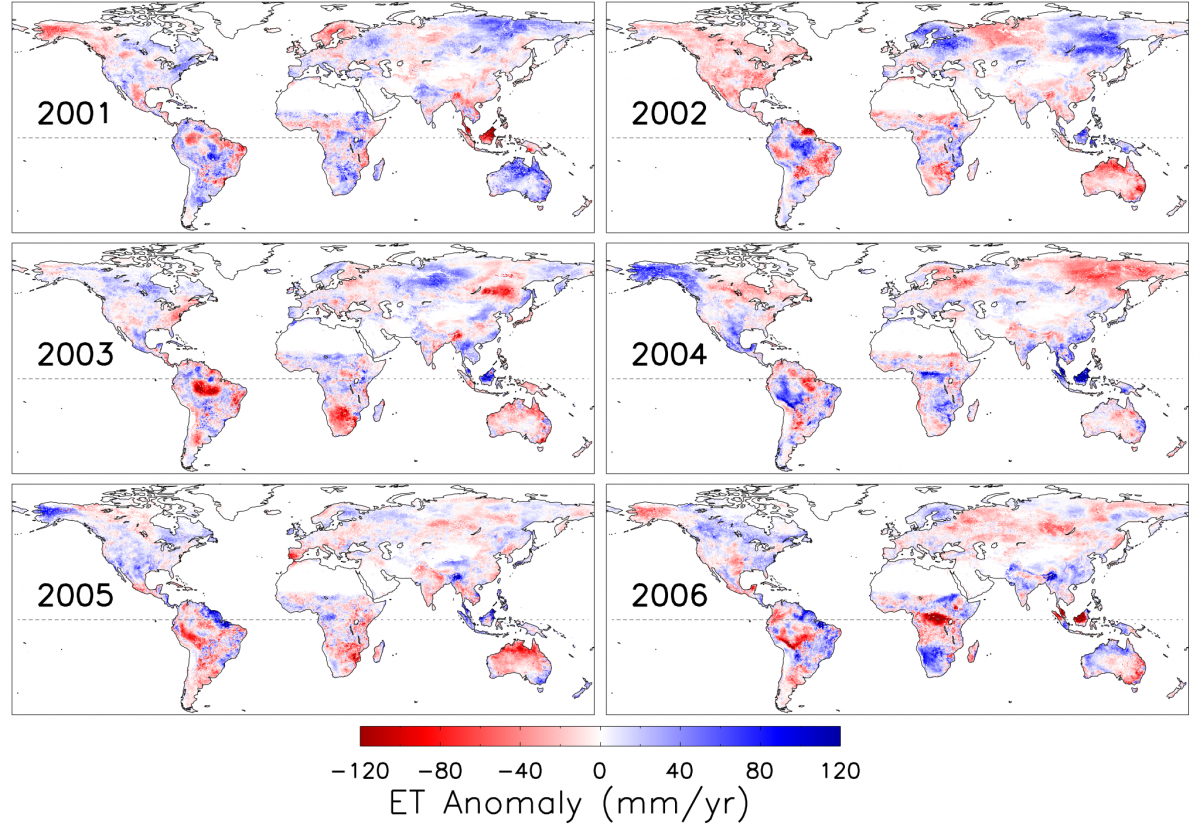
Global annual ET anomalies (2001-2006) relative to the average over 2000-2006:
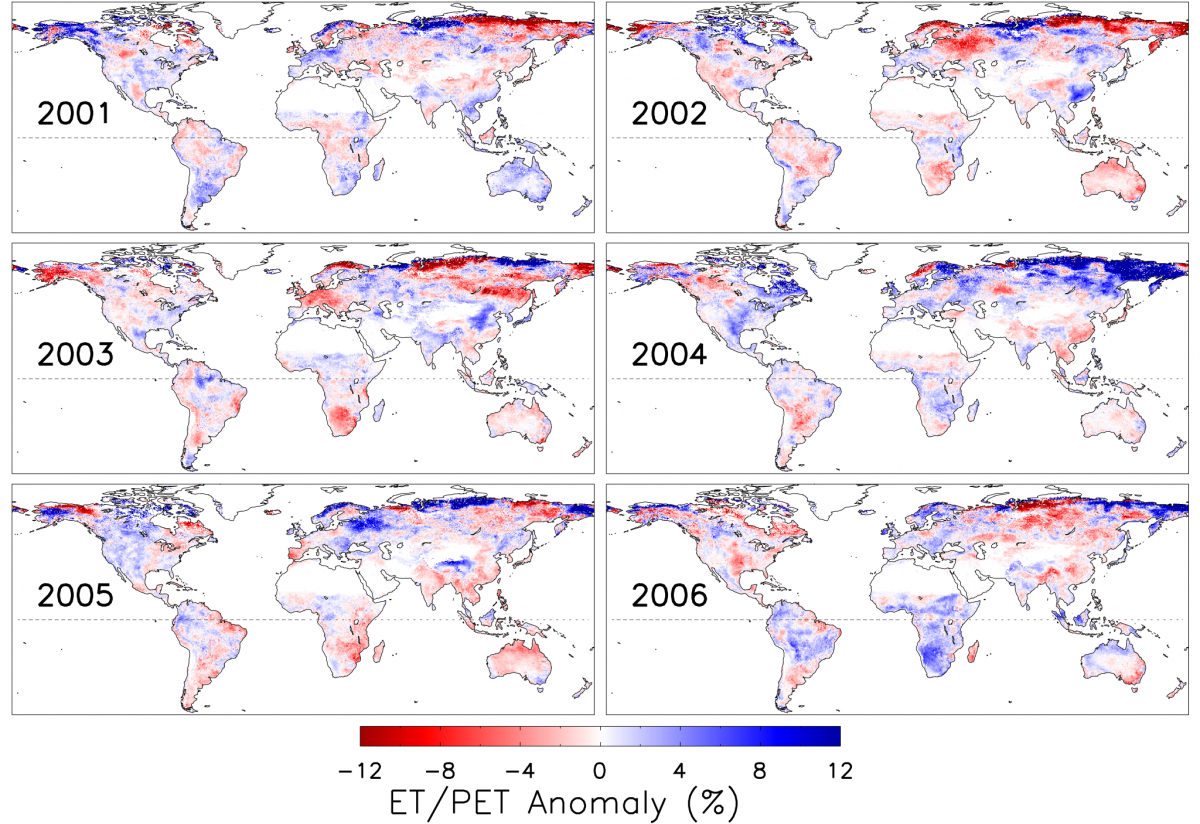
Global ET/PET ratio anomalies (2001-2006) relative to the average ET/PET over 2000-2006:
North American Carbon Program (NaCP) Evapotransipiration:
North American ET over 2000-2006
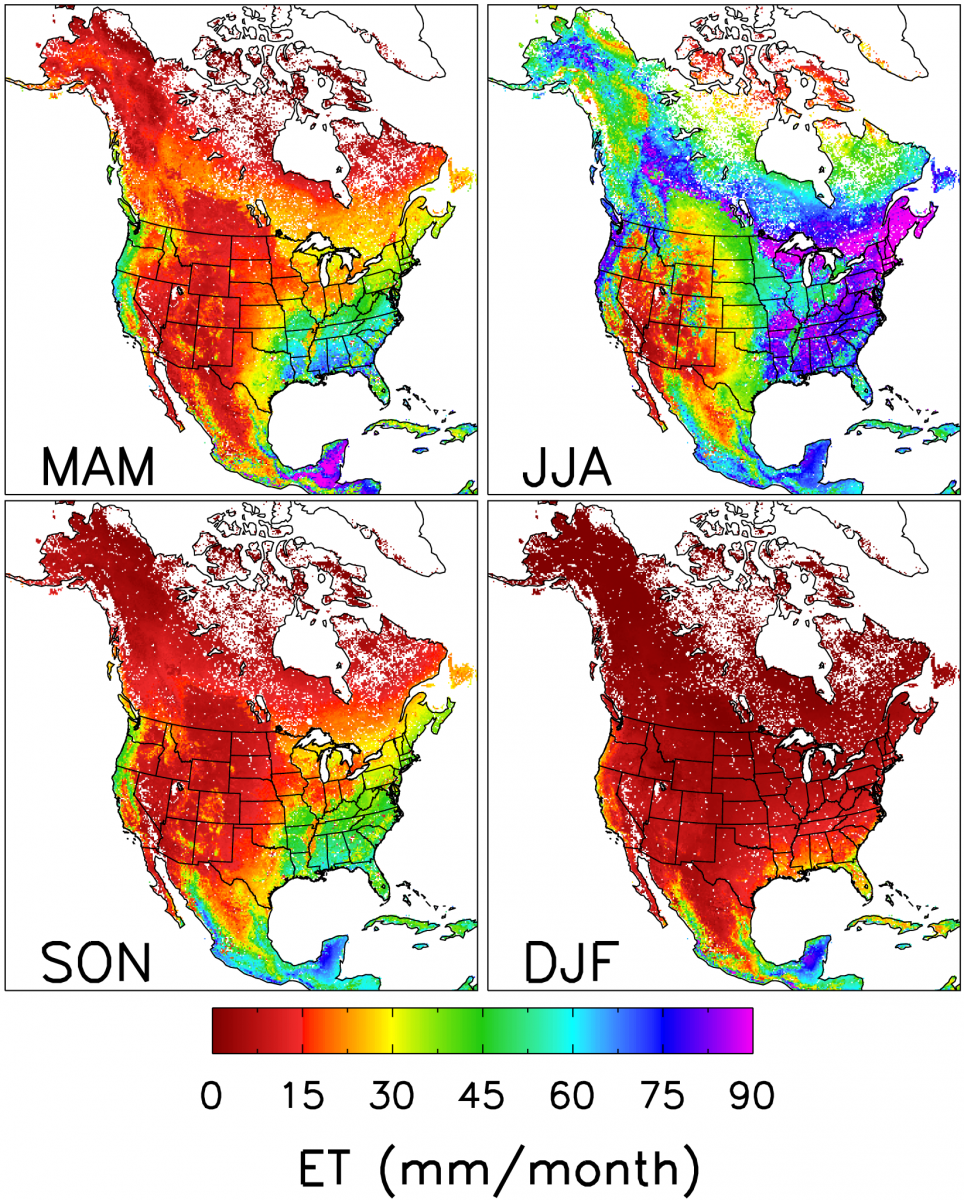
Seasonality of North American ET:
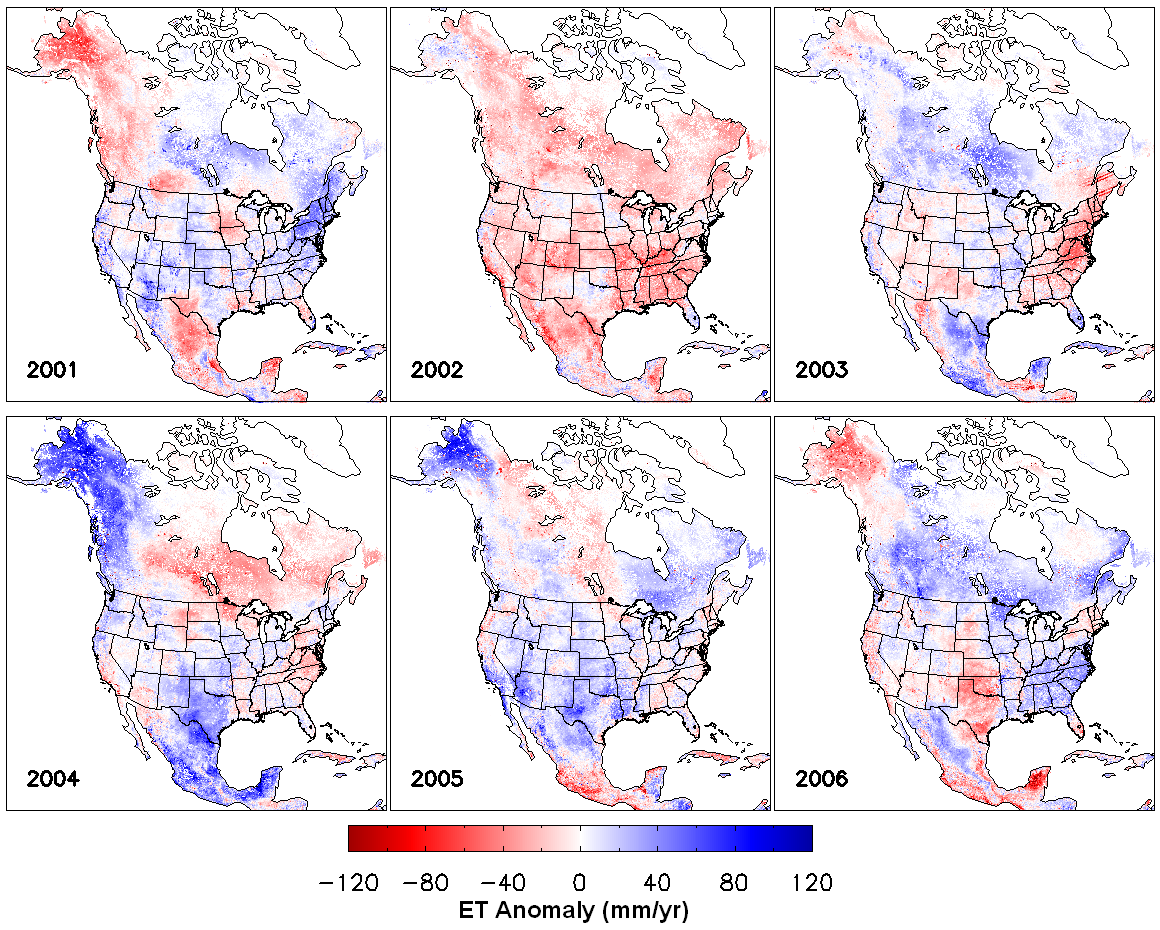
North American annual ET anomalies (2001-2006) relative to the average over 2000-2006:
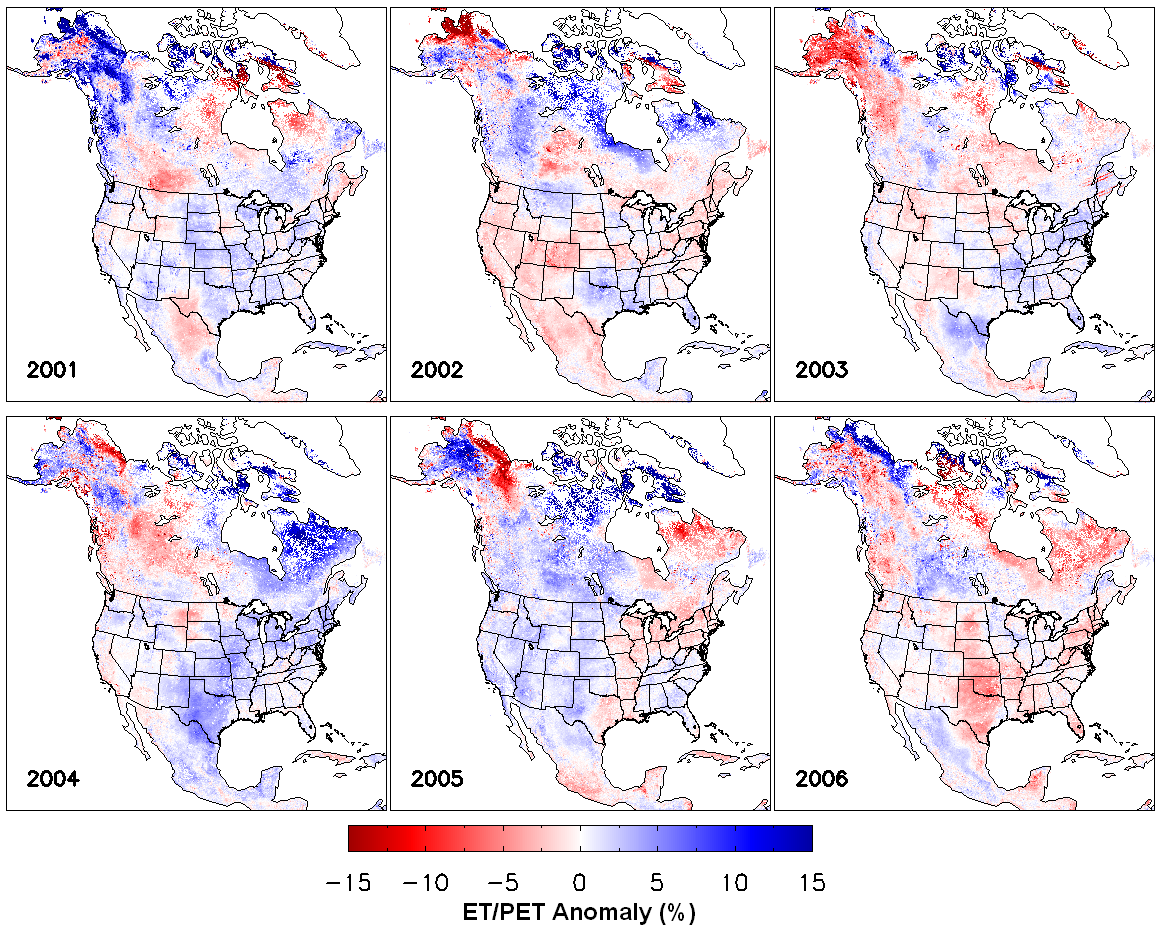
North American ET/PET ratio anomalies (2001-1006) relative to the average ET/PET over 2000-2006:
Global GPP vs. ET:

Selected Publications
Continuity between NASA MODIS Collection 6.1 and VIIRS Collection 2 land products
Citation
Roman, M., C. Justice, I. Paynter, P. Brehm Boucher, S. Devadiga, A. Endsley, A. Erb, M. Friedl, H. Gao, L. Giglio, J. Gray, D. Hall, G. Hulley, J. Kimball, Y. Knyazikhin, A. Lyapustin, R. Myneni, P. Noojipady, J. Pu, G. Riggs, S. Sarkar, C. Schaaf, D. Shah, K. Tran, E. Vermote, D. Wang, Z. Wang, A. Wu, Y. Ye, S. Yu, S. Zhang, S. Zhang, X. Zhang, M. Zhao, C. Davidson, and R. Wolfe, 2024. Continuity between NASA MODIS Collection 6.1 and VIIRS Collection 2 products. Remote Sensing of Environment, 103, 113963.
Abstract
This paper provides a review and summary status of the research underway by the NASA Terra Aqua Suomi-NPP Land Discipline Team to provide continuity of global land data products from the NASA Moderate resolution Imaging Spectroradiometer (MODIS) to the Visible Infrared Imaging Radiometer Suite (VIIRS). The two MODIS instruments on the NASA Earth Observing System Terra (morning overpass) and Aqua (afternoon overpass) platforms have provided more than twenty years of data. The peer-reviewed land products generated from MODIS are now being transitioned to production using VIIRS inputs, with the intention of providing dynamic continuity for the Aqua observations. As part of that process, the products from the two instruments are undergoing intercomparison and evaluation. These results are provided where available and show promising levels of agreement and accuracy in all cases. The paper also offers options for establishing continuity of Terra MODIS data products.
Using SMAP Level-4 Soil Moisture to Constrain MOD16 Evapotranspiration Over the Contiguous USA. Brust C, Kimball J, Maneta M, Jencso K, He M, Reichle R.
Citation
Brust C, Kimball J, Maneta M, Jencso K, He M, Reichle R. Using SMAP Level-4 Soil Moisture to Constrain MOD16 Evapotranspiration Over the Contiguous USA. Remote Sensing of Environment. 2020; In Press.
Abstract
Evapotranspiration (ET) is a key hydrologic variable linking the Earth’s water, carbon and energy cycles. At large spatial scales, remote sensing-based (RS) models are often used to quantify ET. Despite the large number of RS ET models available, few include soil moisture as a key environmental input, which can degrade model accuracy and utility. Here, we use model assimilation enhanced soil moisture estimates from the NASA SMAP (Soil Moisture Active Passive) mission as a water supply control in the MOD16 ET algorithm framework. SMAP-derived daily surface (0-5cm depth) and root zone(0-1m depth) soil moisture are used with MODIS (Moderate Resolution Imaging Spectroradiometer) vegetation observations, and 4km gridded regional surface meteorology (Gridmet) as primary inputs for estimating daily ET and underlying model soil and stomatal conductance terms. We calibrated the model environmental response parameters using tower eddy covariance ET observations representing major North American biomes. The model ET results were validated using a holdout set of tower observations spanning a large regional climate gradient. The updated ET estimates outperform the baseline MOD16 product across all tower validation sites (RMSE = 0.758vs 1.108mm day-1; R2= 0.68 vs 0.45, respectively). Smaller relative improvements were obtained using a recalibrated model with 4km Gridmet meteorology, but no soil moisture control (RMSE = 0.813mm day-1; R2= 0.66), indicating that these changes are essential for the improved model performance. The soil moisture-constrained model improvements and relative benefits from the SMAP observations are greater in arid climates, consistent with stronger soil moisture control on ET in water-limited regions. The use of SMAP soil moisture as an additional model constraint improvesMOD16 regional performance and provides a new framework for investigating both soil and atmosphere controls on ET.
Evaluation of Evapotranspiration Models Using Different LAI and Meteorological Forcing Data from 1982 to 2017. Chen H, Zhu G, Zhang K, Bi J, Jia X, Ding B, Zhang Y, Shang S, Zhao N, Qin W. 2020
Citation
Chen H, Zhu G, Zhang K, Bi J, Jia X, Ding B, Zhang Y, Shang S, Zhao N, Qin W. Evaluation of Evapotranspiration Models Using Different LAI and Meteorological Forcing Data from 1982 to 2017. Remote Sensing. 2020; 12(15):2473.
Abstract
We evaluated the performance of three global evapotranspiration (ET) models at local, regional, and global scales using the multiple sets of leaf area index (LAI) and meteorological data from 1982 to 2017 and investigated the uncertainty in ET simulations from the model structure and forcing data. The three ET models were the Simple Terrestrial Hydrosphere model (SiTH) developed by our team, the Priestley–Taylor Jet Propulsion Laboratory model (PT-JPL), and the MODerate Resolution Imaging Spectroradiometer (MODIS) ET algorithm (MOD16). Comparing the observed with simulated monthly ET by the three models over 43 Fluxnet sites, we found that SiTH overestimated ET for forests with mean slope from 1.25 to 1.67, but it performed better than the other two models over short vegetation. MOD16 and PT-JPL models simulated well for forests but poorly in dryland biomes (slope = 0.25~0.55; R2 = 0.02~0.46). At the catchment scale, all models performed well, except for some tropical and high latitudinal catchments, with NSE values lower than 0 and RMSE and MAE values far beyond their mean values. At the global scale, SiTH highly overestimated ET in tropics, while PT-JPL slightly underestimated ET between 30°N and 60°N and MOD16 underestimated ET between 15°S and 30°S. Generally, the PT-JPL provided the better performance than SiTH and MOD16 models. This study also revealed that the estimated ET by SiTH and especially PT-JPL model were influenced by the uncertainty in meteorological data, and the estimated ET was performed better using MERRA-2 datasets for PT-JPL and using ERA5 datasets for SiTH. While the estimated ET by MOD16 were relatively sensitive to LAI data. In addition, our results suggested that the GLOBMAP and GIMMS datasets were more suitable for long-term ET simulations than the GLASS dataset.
Evaluation of global terrestrial evapotranspiration using state-of-the-art approaches in remote sensing, machine learning and land surface modeling. Pan, S., N. Pan, H. Tian, et al., 2020
Citation
Pan, S., N. Pan, H. Tian, et al., 2020. Evaluation of global terrestrial evapotranspiration using state-of-the-art approaches in remote sensing, machine learning and land surface modeling. Hydrology and Earth System Sciences, 24, 3, 1485-1509.
Abstract
Evapotranspiration (ET) is critical in linking global water, carbon and energy cycles. However, direct measurement of global terrestrial ET is not feasible. Here, we first reviewed the basic theory and state-of-the-art approaches for estimating global terrestrial ET, including remote-sensing-based physical models, machine-learning algorithms and land surface models (LSMs). We then utilized 4 remote-sensing-based physical models, 2 machine-learning algorithms and 14 LSMs to analyze the spatial and temporal variations in global terrestrial ET. The results showed that the ensemble means of annual global terrestrial ET estimated by these three categories of approaches agreed well, with values ranging from 589.6 mm yr−1 (6.56×10⁴ km3 yr−1) to 617.1 mm yr−1 (6.87×10⁴ km3 yr−1). For the period from 1982 to 2011, both the ensembles of remote-sensing-based physical models and machine-learning algorithms suggested increasing trends in global terrestrial ET (0.62 mm yr−2 with a significance level of p<0.05 and 0.38 mm yr−2 with a significance level of p<0.05, respectively). In contrast, the ensemble mean of the LSMs showed no statistically significant change (0.23 mm yr−2, p>0.05), although many of the individual LSMs reproduced an increasing trend. Nevertheless, all 20 models used in this study showed that anthropogenic Earth greening had a positive role in increasing terrestrial ET. The concurrent small interannual variability, i.e., relative stability, found in all estimates of global terrestrial ET, suggests that a potential planetary boundary exists in regulating global terrestrial ET, with the value of this boundary being around 600 mm yr−1. Uncertainties among approaches were identified in specific regions, particularly in the Amazon Basin and arid/semiarid regions. Improvements in parameterizing water stress and canopy dynamics, the utilization of new available satellite retrievals and deep-learning methods, and model–data fusion will advance our predictive understanding of global terrestrial ET.
Satellite-based evapotranspiration in hydrological model calibration. Jiang, L., H. Wu, J. Tao, J.S. Kimball, L. Alfrieri, and X. Chen, 2020
Citation
Jiang, L., H. Wu, J. Tao, J.S. Kimball, L. Alfrieri, and X. Chen, 2020. Satellite-based evapotranspiration in hydrological model calibration. Remote Sensing, 12, 428, doi:10.3390/rs12030428.
Abstract
Hydrological models are usually calibrated against observed streamflow (Qobs), which is not applicable for ungauged river basins. A few studies have exploited remotely sensed evapotranspiration (ETRS) for model calibration but their effectiveness on streamflow simulation remains uncertain. This paper investigates the use of ETRS in the hydrological calibration of a widely used land surface model coupled with a source–sink routing scheme and global optimization algorithm for 28 natural river basins. A baseline simulation is a setup based on the latest model developments and inputs. Sensitive parameters are determined for Qobs and ETRS-based model calibrations, respectively, through comprehensive sensitivity tests. The ETRS-based model calibration results in a mean Kling–Gupta Efficiency (KGE) value of 0.54 for streamflow simulation; 61% of the river basins have KGE > 0.5 in the validation period, which is consistent with the calibration period and provides a significant improvement over the baseline. Compared to Qobs, the ETRS calibration produces better or similar streamflow simulations in 29% of the basins, while further significant improvements are achieved when either better ET or precipitation observations are used. Furthermore, the model results show better or similar performance in 68% of the basins and outperform the baseline simulations in 90% of the river basins using model parameters from the best ETRS calibration runs. This study confirms that with reasonable precipitation input, the ETRS-based spatially distributed calibration can efficiently tune parameters for better ET and streamflow simulations. The application of ETRS for global scale hydrological model calibration promises even better streamflow accuracy as the satellite-based ETRS observations continue to improve.
GRACE-based Mass Conservation as a Validation Target for Basin-Scale Evapotranspiration in the Contiguous United States. Pascolini-Campbell M, Reager J, Fisher J. GRACE 2020
Citation
Pascolini-Campbell M, Reager J, Fisher J. GRACE-based Mass Conservation as a Validation Target for Basin-Scale Evapotranspiration in the Contiguous United States. Water Resources Research. 2020. 56(2).
Abstract
Here, we evaluate basin-scale evapotranspiration (ET) estimates for eleven major river basins in the contiguous United States against a water balance approach with Gravity Recovery and Climate Experiment (GRACE) satellite observations. The relatively precise measurements of large‐scale changes in water mass from GRACE are used to estimate the storage rate term in the terrestrial water budget and consequently provide an estimate, with propagated uncertainty, of basin-aggregated ET from mass conservation. We apply GRACE-based ET to two modeling systems (NLDAS-2 and GLDAS-2.1) comprised of five land surface models and three remote sensing‐based products (MOD16, PT-JPL, and FLUXCOM) for 2003 to 2014. Both the land surface model-based and remote sensing-based ET are persistently lower than GRACE-based ET in all eleven basins tested. We also find that interannual variability is greater for GRACE-ET than the model and remote sensing products, and this is attributed to precipitation variability.
Evaluation and comparison of multiple evapotranspiration data models over the contiguous United States: Implications for the next phase of NLDAS (NLDAS-Testbed) development. Zhang B, Xia Y, Long B, Hobbins M, Zhao X, Hain C, Li Y, Anderson M. 2020
Citation
Zhang B, Xia Y, Long B, Hobbins M, Zhao X, Hain C, Li Y, Anderson M. Evaluation and comparison of multiple evapotranspiration data models over the contiguous United States: Implications for the next phase of NLDAS (NLDAS-Testbed) development. Agricultural and Forest Meteorology. 2020. 252.
Abstract
Terrestrial evapotranspiration (ET) is a major component of the surface hydrological cycle and controls land-atmosphere feedbacks by modulating the surface energy budget. Accurate ET quantification at global or regional scales is crucial for understanding variations in carbon and water cycling in a changing environment. Although various grid-based ET data models have been developed using multiple approaches, these vary in concept and physical scheme, leading to differences in performance. We examine uncertainties associated with the limitations of the physics used to assist in model selection and improvement. We evaluate multiple ET data models, including estimates derived from a variety of land surface models (LSMs) based on the operational North American Land Data Assimilation System (NLDAS) phase 2 (NLDAS-2) and the experimental NASA LIS-based NLDAS Testbed (NLDAS-Testbed) drivers, and satellite retrievals, compared to water budget-derived ET and tower observations. Overall, all models are able to capture the spatial variability of mean annual water balance-based ET (ETwb) and monthly seasonal cycles of tower ET measurements, although there is a large range of estimates. NOAH28, FLUXNET, SSEBop, LandFlux, and GLEAM perform best, as demonstrated by their higher correlation and smaller bias and RMSE values. Simple relative uncertainty analysis shows that the NLDAS-Testbed ensemble mean has a slightly lower uncertainty than that of the NLDAS-2 ensemble. Our study indicates that NLDAS-Testbed/VIC412 (NLDAS version/LSM version) is improving and NLDAS-Testbed /CLSM is deteriorating relative to NLDAS-2/VIC403 and NLDAS-2/Mosaic. NLDAS-Testbed /NOAH36 and NLDAS-Testbed /NOAHMP36 are comparable to NLDAS-2/NOAH28, although biases between models and ETwb exhibit opposite trends. These findings will help further improvement of these models and support future NLDAS development.
Parameter Analysis and Estimates for the MODIS Evapotranspiration Algorithm and Multiscale Verification. Zhang K, Zhu G, Ma J, Yang Y Shang S, Gu C. 2019
Citation
Zhang K, Zhu G, Ma J, Yang Y Shang S, Gu C. Parameter Analysis and Estimates for the MODIS Evapotranspiration Algorithm and Multiscale Verification. Water Resources Research. 2019. 55(3).
Abstract
Accurate estimation of terrestrial evapotranspiration (E) is critical to understand the world's energy and water cycles. MOD16 is the core algorithm of the widely used global E data set (the Moderate Resolution Imaging Spectroradiometer [MODIS] E product). However, it exhibits considerable uncertainties in some regions. Based on the data from 175 flux towers, we identified the key parameters of the MOD16 algorithm using the Sobol’ sensitivity analysis method across biomes. The output of the MOD16 algorithm was sensitive to eight parameters. Among them, β, which is treated as a constant (0.2 kPa) across biomes in the original MOD16 algorithm, was identified as the parameter to which the algorithm was most sensitive. We used the differential‐evolution Markov chain method to obtain the proper posterior distributions for each key parameter across a range of biomes. The values of the key parameters for the different biomes were accurately estimated by differential-evolution Markov chain in comparison with data from the flux towers. We then evaluated the performances of the original MOD16 and the optimized MOD16 and compared them at multiple spatial scales (i.e., site, catchment, and global). We obtained relatively consistent and more reliable E simulations using the optimized MOD16 at all three scales. In the future, more attention should be paid to uncertainties in the algorithm's structure and its parameterizations of soil moisture constraint, canopy resistance, and energy partitioning.
Satellite data-driven modeling of field scale evapotranspiration in croplands using the MOD16 algorithm framework. He, M., J.S. Kimball, Y. Yi, S.W. Running, K. Guan, A. Moreno, X. Wu, and M. Maneta, 2019
Citation
He, M., J.S. Kimball, Y. Yi, S.W. Running, K. Guan, A. Moreno, X. Wu, and M. Maneta, 2019. Satellite data-driven modeling of field scale evapotranspiration in croplands using the MOD16 algorithm framework. Remote Sensing of Environment 230, 111201.
Abstract
Evapotranspiration (ET) is a key variable linking the global water, carbon and energy cycles, while accurate ET estimates are crucial for understanding cropland water use in context with agricultural management. Satellite remote sensing provides spatially and temporally continuous information that can be used for global ET estimation. The NASA MODIS MOD16A2 operational product provides 500-m 8-day global ET estimates extending from 2001 to present. However, reliable estimates for delineating field level cropland ET patterns are lacking. In this investigation, we modified the MOD16 global algorithm to better represent cropland ET by calibrating model parameters according to C3 and C4 crop types, and incorporating finer scale satellite vegetation inputs to derive 30-m cropland ET estimates over the continental USA (CONUS). Similar overlapping enhanced vegetation index (EVI) records from Landsat and MODIS were used to generate a continuous 30-m 8-day fused EVI and ET record extending from 2008 to 2017 over CONUS croplands. The satellite-based ET estimates were compared with tower based ET observations over different crop types, and more traditional cropland actual ET (AET) estimates derived from reference ET and crop-specific coefficients. The new satellite based 30-m cropland ET estimates (ET30m) corresponded favorably with both tower ET observations (ETflux; R2 = 0.69, RMSE = 0.70 mm d−1, bias = 0.04 mm d−1) and the baseline global MOD16A2 ET product (ETMOD16). The ET30m results also showed better performance against the ETflux observations than ETMOD16 (R2 = 0.54, RMSE = 0.82 mm d−1) or AET (R2 = 0.52, RMSE = 2.47 mm d−1) for monitoring CONUS croplands. The spatial and temporal patterns of the ET30m results show enhanced delineation of agricultural water use, including impacts from variable climate, cropland area and diversity. The resulting ET30m record is suitable for operational applications promoting more effective agricultural water management and food security.
Stand-alone uncertainty characterization of GLEAM, GLDAS and MOD16 evapotranspiration products using an extended triple collocation approach. Khan M, Liaqat U, Baik J, Choi M. 2018
Citation
Khan M, Liaqat U, Baik J, Choi M. Stand-alone uncertainty characterization of GLEAM, GLDAS and MOD16 evapotranspiration products using an extended triple collocation approach. Agricultural and Forest Meteorology. 2018. 262.
Abstract
An optimal use of the global scale actual evapotranspiration (AET) products for various hydro-meteorological applications requires a systematic characterization of their uncertainties. This study presents the first application of an extended triple collocation (TC) approach to provide mutually uncorrelated absolute and relative error structure among three readily available AET (MOD16, GLEAM, and GLDAS) products on the point and spatial scale within the extent of Asia. The physical evaluation results of GLEAM, GLDAS and MOD16 exhibited reasonable accuracy compared to the in-situ AET with mean Index of Agreement >0.71, 0.59 and 0.58, respectively, thereby yielding Root Mean Square Error between ∼4–13 mm/8 day over nine AsiaFlux sites representing forest, rice paddy, and grassland biomes. Theoretical uncertainty assessment of four AET dataset combinations revealed that an average ∼1.5–5.5 mm/8 day random error was contributed from in-situ AET, thereby reducing the accuracy of other datasets. GLEAM performed consistently better with least absolute and relative uncertainties over forest compared with rice paddy and grassland surfaces where GLDAS had almost similar errors as those obtained from GLEAM, while MOD16 showed high uncertainties over all vegetation conditions. Interestingly, all four datasets had large relative uncertainties (>25%) for low vegetation compared to the errors of tall canopies. A spatially merged product generated from the least uncertainties showed better agreement in order of GLDAS > GLEAM > MOD16 over 47%, 42% and 11% of the study area. Overall, the application of extended TC approach on the quality of three AET products is a step forward to develop the merged near real-time accurate AET dataset by processing of theoretical and systematic uncertainties in the current AET algorithms.
Algorithm Theoretical Basis Document: MODIS Global Terrestrial Evapotranspiration (ET) Product (NASA MOD16A2/A3) Collection 5. NASA Headquarters. Qiaozhen Mu, Maosheng Zhao, Steven W. Running, November 20, 2013
This Algorithm Theoretical Basis Document (ATBD) describes a level 4 MODIS land data product, MOD16, the global 8-day (MOD16A2) and annual (MOD16A3) terrestrial ecosystem Evapotranspiration (ET) dataset at 1-km spatial resolution over the 109.03 Million km2 global vegetated land areas. The MOD16 algorithm is based on the logic of the Penman-Monteith equation which uses daily meteorological reanalysis data and 8-day remotely sensed vegetation property dynamics from MODIS as inputs.
The MOD16 ET algorithm runs at daily basis and temporally, daily ET is the sum of ET from daytime and night. Vertically, ET is the sum of water vapor fluxes from soil evaporation, wet canopy evaporation and plant transpiration at dry canopy surface. MODIS 8-day FPAR is used as vegetation cover faction to quantify how much surface net radiation is allocated between soil and vegetation; MODIS 8-day albedo and daily surface downward solar radiation and air temperature from daily meteorological reanalysis data are used to calculate surface net radiation and soil heat flux; daily air temperature, vapor pressure deficit (VPD) and relative humidity data, and 8-day MODIS LAI are used to estimate surface stomatal conductance, aerodynamic resistance, wet canopy, soil heat flux and other key environmental variables. MODIS land cover is used to specify the biome type for each pixel, and the biome-dependent constant parameters for the algorithm are saved in a Biome-Property-Lookup-Table (BPLUT). Except for minimum daily air temperature and VPD, which are directly adopted from the existing algorithm of the MODIS global terrestrial gross and net primary production (MODIS GPP/NPP), the BPLUT is tuned largely based on a set of targeted annual ET for each biome derived from MODIS GPP and water use efficiency calculated from eddy flux towers.
The MOD16 ET has been validated with ET measured at eddy flux towers and ET estimated from 232 watersheds. Averaged over 2000-2010, the total global annual ET over the vegetated land surface is 63.4 103 km3, with an average of 569 ± 358 mm yr-1, comparable to the recent global estimates. Similar to other MODIS level 3 or level 4 MODIS land data products, 8-day and monthly MOD16A2 and annual MOD16A3 datasets are saved in 10-degree Sinusoidal HDFEOS tiles. Thanks to the powerful internal compression of HDFEOS, for each year, the size of the MOD16A2 and MOD16A3 together takes about 39GB. Since 2006, there have been 193 users from 30 countries requesting MODIS ET data from us and now MOD16 from 2000 to 2010 are ready and have been released to the public for free download at our ftp site,http://files.ntsg.umt.edu/data/NTSG_Products/MOD16/.
A Remotely Sensed Global Terrestrial Drought Severity Index Mu, Q., M. Zhao, J. S. Kimball, N. G. McDowell, S. W. Running (2013) Bulletin of the American Meteorological Society, 01/2013, Volume 94, Issue 1, Number 1, p.83.98, DOI:10.1175/BAMS-D-11-00213.1
Improvements to a MODIS Global Terrestrial Evapotranspiration Algorithm Mu, Q., M. Zhao, S. W. Running Remote Sensing of Environment, Volume 115, pages 1781-1800 (doi:10.1016/j.rse.2011.02.019)
MODIS global evapotranspiration (ET) products by Mu et al. [Mu, Q., F.A. Heinsch, M. Zhao, S.W. Running (2007) Development of a global evapotranspiration algorithm based on MODIS and global meteorology data. Remote Sensing of Environment 111, 519-536 (doi: 10.1016/j.rse.2007.04.015).] are the first regular 1-km2 land surface ET dataset for the 109.03 Million km2 global vegetated land areas at an 8-day interval. In this study, we have further improved the ET algorithm in Mu et al.’s paper (2007a, hereafter called old algorithm) by 1) simplifying the calculation of vegetation cover fraction; 2) calculating ET as the sum of daytime and nighttime components; 3) adding soil heat flux calculation; 4) improving estimates of stomatal conductance, aerodynamic resistance and boundary layer resistance; 5) separating dry canopy surface from the wet; and 6) dividing soil surface into saturated wet surface and moist surface. We compared the improved algorithm with the old one both globally and locally at 46 eddy flux towers. The global annual total ET over the vegetated land surface is 62.8×10³ km3, agrees very well with other reported estimates of 65.5×10³ km3 over the terrestrial land surface, which is much higher than 45.8×10³ km3 estimated with the old algorithm. For ET evaluation at eddy flux towers, the improved algorithm reduces mean absolute bias (MAE) of daily ET from 0.39 mm day-1 to 0.33 mm day-1 driven by tower meteorological data, and from 0.40 mm day-1 to 0.31 mm day-1 driven by GMAO data, a global meteorological reanalysis dataset. MAE values by the improved ET algorithm are 24.6% and 24.1% of the ET measured from towers, within the range (10-30%) of the reported uncertainties in ET measurements, implying an enhanced accuracy of the improved algorithm. Compared to the old algorithm, the improved algorithm increases the skill score with tower-driven ET estimates from 0.50 to 0.55, and from 0.46 to 0.53 with GMAO-driven ET. Based on these results, the improved ET algorithm has a better performance in generating global ET data products, providing critical information on global terrestrial water and energy cycles and environmental changes.
Direct impacts on local climate of sugarcane expansion in Brazil. Loarie, S. R., D. B. Lobell, G. P. Asner, Q. Mu, C. B. Field Nature Climate Change 1 (2): 105-109. (2011) | doi:10.1038/nclimate1067.
The increasing global demand for biofuels will require conversion of conventional agricultural or natural ecosystems. Expanding biofuel production into areas now used for agriculture reduces the need to clear natural ecosystems, leading to indirect climate benefits through reduced greenhouse-gas emissions and faster payback of carbon debts. Biofuel expansion may also cause direct, local climate changes by altering surface albedo and evapotranspiration, but these effects have been poorly documented. Here we quantify the direct climate effects of sugar-cane expansion in the Brazilian Cerrado, on the basis of maps of recent sugar-cane expansion and natural-vegetation clearance combined with remotely sensed temperature, albedo and evapotranspiration over a 1:9 million km2 area. On a regional basis for clear-sky daytime conditions, conversion of natural vegetation to a crop/pasture mosaic warms the cerrado by an average of 1:55 (1:45–1:65) °C, but subsequent conversion of that mosaic to sugar cane cools the region by an average of 0:93 (0:78–1:07) °C, resulting in a mean net increase of 0:6 °C. Our results indicate that expanding sugar cane into existing crop and pasture land has a direct local cooling effect that reinforces the indirect climate benefits of this land-use option.
Recent decline in the global land evapotranspiration trend due to limited moisture supply. Jung, M., M. Reichstein, P. Ciais, S.I. Seneviratne, J. Sheffield, M. L. Goulden, G. B. Bonan, A. Cescatti, J. Chen, R. de Jeu, A. J. Dolman, W. Eugster, D. Gerten, D. Gianelle, N. Gobron, J. Heinke, J. S. Kimball, B. E. Law, L. Montagnani, Q. Mu, B. Mueller, K. W. Oleson, D. Papale, A. D. Richardson, O. Roupsard, S. W. Running, E. Tomelleri, N. Viovy, U. Weber, C. Williams, E. Wood, S. Zaehle and K. Zhang, Nature, Volume 467, page 951--954 - October 2010 (doi: 10.1038/nature09396)
More than half of the solar energy absorbed by land surfaces is currently used to evaporate water. Climate changes is expected to intensify the hydrological cycle and to alter evapotranspiration, with implications for ecosystem services and feedback to regional and global climate. Evapotranspiration changes may already be underway, but direct observational constraints are lacking at the global scale. Until evidence is available, changes in the water cycle on land - a key diagnostic criterion of the effects of climate change and variability - remain uncertain. Here we provide a data-driven estimate of global land evapotranspiration from 1982 to 2008, compiled using a global monitoring network, meteorological and remote sensing observations and a machine learning algorithm. In Addition, we have assessed evapotranspiration variations over the same time period using an ensemble of process-based land-surface models. Our results suggest that global annual evapotranspiration increased on average by 7.1 ± 1.0 millimeters per year per decade from 1982 to 1997. After that, coincident with the last major El Niño event in 1998, the global evapotranspiration increase seems to have ceased until 2008. This change was driven primarily by moisture limitation in the Southern Hemisphere, particularly Africa and Australia. In these regions, microwave satellite observations indicate that soil moisture limitations on evapotranspiration largely explain the recent decline of the global land-evapotranspiration trend. Whether the changing behavior of evapotranspiration is representative of natural climate variability or reflects a more permanent reorganization of the land water cycle is a key question for earth system science.
Satellite assessment of land surface evapotranspiration for the pan-Arctic domain. Mu, Q., L. A. Jones, J. S. Kimball, K. C. McDonald and S. W. Running. Water Resources Research, Volume 45, Number W09420 - 2009 (doi: 10.1029/2008WR007189)
Regional evapotranspiration (ET), including water loss from plant transpiration and soil evaporation, is essential to understanding interactions between land-atmosphere surface energy and water balances. Vapor pressure deficit (VPD) and surface air temperature are key variables for stomatal conductance and ET estimation. Mu et al. (2007) developed an algorithm to estimate ET using the Penman-Monteith approach driven by MODIS (MODerate resolution Imaging Spectroradiometer) derived vegetation data and daily surface meteorological inputs including incoming solar radiation, air temperature and VPD. The model was applied using alternate daily meteorological inputs, including: 1) site level weather station observations, 2) VPD and air temperature derived from the Advanced Microwave Scanning Radiometer (AMSR-E) on the EOS Aqua satellite, and 3) Global Modeling and Assimilation Office (GMAO) reanalysis meteorology based surface air temperature, humidity and solar radiation data. Model performance was assessed across a North American latitudinal transect of six eddy covariance flux towers representing northern temperate grassland, boreal forest and tundra biomes. Model results derived from the three meteorology data sets agree well with observed tower fluxes (r>0.7; P<0.003; root mean square error of latent heat flux <30 W m-2) and capture spatial patterns and seasonal variability in ET. The MODIS-AMSR-E derived ET results also show similar accuracy to ET results derived from GMAO, while ET estimation error was generally more a function of algorithm parameterization than differences in meteorology drivers. Our results indicate significant potential for regional mapping and monitoring daily land surface ET using synergistic information from satellite optical-IR and microwave remote sensing.
The net carbon drawdown of small scale afforestation from satellite observations
Montenegro, A., M. Eby, Q. Mu, M. Mulligan, A. J. Weaver, E. C. Wiebe, M. Zhao
Global and Planetary Change 69 (2009), page 195-204 (doi:10.1016/j.gloplacha.2009.08.005)
Climate models indicate that warming due to increase in shortwave absorption from the lowering of albedo caused by afforestation reduces and can even overcome, particularly at high latitudes, the cooling caused by the carbon drawdown. Montenegro et al. used high resolution (0.05×0.05° to 1×1°) global satellite observations from an albedo and carbon density model, MOD16 ET model and cloud cover model to investigate the effects of afforestation. Results are markedly different from the coarser (~2.5×~2.5°) model-based studies. Between 40°S and 60°N afforestation always results in cooling. Many of the areas with the highest net carbon drawdown (drawdown after albedo effects) are at high latitudes. There is large zonal variability in drawdown and latitude is not a good indicator of afforestation efficiency. The overall efficiency of afforestation, defined as the net carbon drawdown divided by the total drawdown, is about 50%. By only considering the total drawdown and not considering albedo effects, the Kyoto Protocol carbon accounting rules grossly overestimate the cooling caused by afforestation drawdown.
Satellite based analysis of northern ET trends and associated changes in the regional water balance from 1983 to 2005
Zhang, K., J. S. Kimball, Q. Mu, L. A. Jones, S. Goetz and S. W. Running.
Journal of Hydrology, Volume 379, page 92-110 - 2009 (doi: 10.1016/j.jhydrol.2009.09.047)
We developed an evapotranspiration (ET) algorithm driven by satellite remote sensing inputs, including AVHRR GIMMS NDVI, MODIS land cover and NASA/GEWEX solar radiation and albedo, and regionally corrected NCEP/NCAR Reanalysis daily surface meteorology. The algorithm was used to assess spatial patterns and temporal trends in ET over the pan-Arctic basin and Alaska from 1983 to 2005. We then analyzed associated changes in the regional water balance defined as precipitation (P) minus ET, where monthly P was defined from Global Precipitation Climatology Project (GPCP) and Global Precipitation Climatology Center (GPCC) sources. Monthly ET results derived from both in situ meteorological measurements and coarse resolution model reanalysis inputs agreed well (RMSE = 5.1–6.3 mm month-1; R2 = 0.91–0.92) with measurements from eight independent flux towers representing regionally dominant land cover types. ET showed generally positive trends over most of the pan-Arctic domain, though negative ET trends occurred over 32% of the region, primarily in boreal forests of southern and central Canada. Generally positive trends in ET, P and available long-term river discharge measurements imply that the pan-Arctic terrestrial water cycle is intensifying despite uncertainty in regional P and associated water balance estimates. Increasing water deficits in eastern Alaska, Canadian Yukon and western Prairie Provinces, and Northern Mongolia agree with regional drought records and recent satellite observations of vegetation browning and productivity decreases. Our results indicate that the pan-Arctic water balance is responding to a warming climate in complex ways with direct links to terrestrial carbon and energy cycles.
Development of a global evapotranspiration algorithm based on MODIS and global meteorology data
Mu, Q., F. A. Heinsch, M. Zhao, S. W. Running
Remote Sensing of Environment, Volume 111, page 519-536 - 2007 (doi: 10.1016/j.rse.2007.04.015)
Mu et al. (2007) developed a global remote sensing evapotranspiration (ET) algorithm based on Cleugh et al.’s (2007) Penman-Monteith based ET (RS-PM). Our algorithm considers both the surface energy partitioning process and environmental constraints on ET. We use ground-based meteorological observations and remote sensing data from the MODerate Resolution Imaging Spectroradiometer (MODIS) to estimate global ET by (1) adding vapor pressure deficit and minimum air temperature constraints on stomatal conductance; (2) using leaf area index as a scalar for estimating canopy conductance; (3) replacing the Normalized Difference Vegetation Index with the Enhanced Vegetation Index thereby also changing the equation for calculation of the vegetation cover fraction (FC); and (4) adding a calculation of soil evaporation to the previously proposed RS-PM method.
We evaluate our algorithm using ET observations at 19 AmeriFlux eddy covariance flux towers. We calculated ET with both our Revised RS-PM algorithm and the RS-PM algorithm using Global Modeling and Assimilation Office (GMAO v. 4.0.0) meteorological data and compared the resulting ET estimates with observations. Results indicate that our Revised RS-PM algorithm substantially reduces the root mean square error (RMSE) of the 8-day latent heat flux (LE) averaged over the 19 towers from 64.6 W/m2 (RS-PM algorithm) to 27.3 W/m2 (Revised RS-PM) with tower meteorological data, and from 71.9 W/m2 to 29.5 W/m2 with GMAO meteorological data. The average LE bias of the tower-driven LE estimates to the LE observations changed from 39.9 W/m2 to -5.8 W/m2 and from 48.2 W/m2 to -1.3 W/m2 driven by GMAO data. The correlation coefficients increased slightly from 0.70 to 0.76 with the use of tower meteorological data. We then apply our Revised RS-PM algorithm to the globe using 0.05° MODIS remote sensing data and reanalysis meteorological data to obtain the annual global ET (MODIS ET) for 2001. As expected, the spatial pattern of the MODIS ET agrees well with that of the MODIS global terrestrial gross and net primary production (MOD17 GPP/NPP), with the highest ET over tropical forests and the lowest ET values in dry areas with short growing seasons. Our ET algorithm can capture the seasonal and interannual variability of water cycle. This MODIS ET product provides critical information on the regional and global water cycle and resulting environment changes.
Regional evaporation estimates from flux tower and MODIS satellite data
Cleugh, H. A., R. Leuning, Q. Mu and S. W. Running
Remote Sensing of Environment, Volume 106, page 285–304 - 2007 (doi: 10.1016/j.rse.2006.07.007)
Cleugh et al. (2007) developed a remote sensing ET algorithm based on Penman-Monteith equation (P-M). The model was tested using 3 years of evaporation and meteorological measurements from two contrasting Australian ecosystems, a cool temperate, evergreen Eucalyptus forest and a wet/dry, tropical savanna. The P-M model adequately estimated the magnitude and seasonal variation in evaporation in both ecosystems (RMSE=27W/m−2, R2=0.74), demonstrating the validity of the proposed surface conductance algorithm. This, and the ability to constrain evaporation estimates via the energy balance, demonstrates the superiority of the P-M equation over the surface temperature-based model.
Evaluating water stress controls on primary production in biogeochemical and remote sensing based models
Mu, Q., M. Zhao, F. A. Heinsch, M. Liu, H. Tian and S. W. Running
Journal of Geophysical Research, Volume 112, Number G01012 - 2007 (doi: 10.1029/2006JG000179)
Water stress is one of the most important limiting factors controlling terrestrial primary production, and the performance of a primary production model is largely determined by its capacity to capture environmental water stress. The algorithm that generates the global near real-time MODIS GPP/NPP products (MOD17) uses VPD (Vapor Pressure Deficit) alone to estimate the environmental water stress. This paper compares the water stress calculation in the MOD17 algorithm with results simulated using a process-based biogeochemical model (Biome-BGC) to evaluate the performance of the water stress determined using the MOD17 algorithm. The investigation study areas include China and the conterminous U.S. because of the availability of daily meteorological observation data. Our study shows that VPD alone can capture interannual variability of the full water stress nearly over all the study areas. In wet regions, where annual precipitation is greater than 400 mm/yr, the VPD–based water stress estimate in MOD17 is adequate to explain the magnitude and variability of water stress determined from atmospheric VPD and soil water in Biome-BGC. In some dry regions, where soil water is severely limiting, MOD17 underestimates water stress, overestimates GPP, and fails to capture the intra-annual variability of water stress. The MOD17 algorithm should add soil water stress to its calculations in these dry regions, thereby improving GPP estimates. Interannual variability in water stress is simpler to capture than the seasonality, but it is more difficult to capture this interannual variability in GPP. The MOD17 algorithm captures inter- and intra-annual variability of both the Biome-BGC-calculated water stress and GPP better in the conterminous USA than in the strongly monsoon-controlled China.