
Project Summary
Our goals are to operationally detect all major terrestrial ecosystem disturbances by using satellite remote sensing. These disturbances can be induced by different causes, such as wildfires, hurricanes, insect outbreaks, heatwaves, wind, ice storms, and deforestation. Quantification of the time, extent and severity of disturbances and the following recovery is critical to expedite our understanding of how climate change and human activity affect the dynamics of ecosystems. It also provides vital information for the global carbon, water and energy studies, and assessments of ecosystem structure and biodiversity.
MGDI Algorithm Description
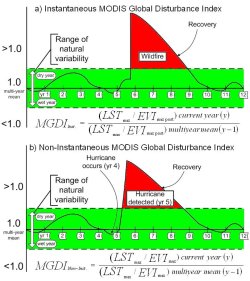
Following the occurrence of a major disturbance, there will be a reduction in Enhanced Vegetation Index (EVI) because of vegetation damage; in contrast, Land Surface Temperature (LST) will increase because more absorbed solar radiation will be converted into sensible heat as a result of the reduction in evapotranspiration from less vegetation density. MGDI takes advantage of the contrast changes in EVI and LST following disturbance to enhance the signal to effectively detect the location and intensity of disturbances.
Key Datasets
Selected Publications
A global comparison between station air temperatures and MODIS land surface temperatures reveals the cooling role of forests
Mildrexler, D. J., M. Zhao and S. W. Running
Journal of Geophysical Research, 116, G03025, doi:10.1029/2010JG001486, 2011.
Most global temperature analyses are based on station air temperatures. This study presents a global analysis of the relationship between remotely sensed annual maximum LST (LSTmax) from the Aqua/Moderate Resolution Imaging Spectroradiometer (MODIS) sensor and the corresponding site‐based maximum air temperature (Tamax) for every World Meteorological Organization station on Earth. The relationship is analyzed for different land cover types. We observed a strong positive correlation between LSTmax and Tamax. As temperature increases, LSTmax increases faster than Tamax and captures additional information on the concentration of thermal energy at the Earth’s surface, and biophysical controls on surface temperature, such as surface roughness and transpirational cooling. For hot conditions and in nonforested cover types, LST is more closely coupled to the radiative and thermodynamic characteristics of the Earth than the air temperature (Tair). Barren areas, shrublands, grasslands, savannas, and croplands have LSTmax values between 10°C and 20°C hotter than the corresponding Tamax at higher temperatures. Forest cover types are the exception with a near 1:1 relationship between LSTmax and Tamax across the temperature range and 38°C as the approximate upper limit of LSTmax with the exception of subtropical deciduous forest types where LSTmax occurs after canopy senescence. The study shows a complex interaction between land cover and surface energy balances. This global, semiautomated annual analysis could provide a new, unique, monitoring metric for integrating land cover change and energy balance changes.
Satellite finds highest land skin temperature on Earth
Milldrexler D.J., M. Zhao and S.W. Running
Bulletin of the American Meteorological Society. 92: 855–860. 2011
Finding the hottest spot on Earth based on scattered site-based air temperature measurements is a limited approach due to the lack of spatial coverage of the existing site-based weather stations. The Aqua/MODIS remote sensor is used to evaluate the continuous patterns of thermal maxima across the Earth's surface and identify the highest radiometric surface temperature annually for 7 years (2003 to 2009). The critical difference between radiometric surface temperature provided by the satellite and air temperature from WMO stations is described and contrasted with practical examples. A new histogram of the global maximum LSTs is presented that merges into a single metric important biophysical and biogeographical factors of the Earth system that are usually measured individually. These contributing factors can include 1) intensification of extreme maximum surface temperatures; 2) changes in land cover; 3) changes in albedo; 4) surface–atmosphere energy fluxes; 5) changes in ecosystem disturbance regimes; 6) air temperature; and 7) atmospheric aerosol concentrations. The annual maximum LST histogram could become a new type of integrative global change metric.
Testing a MODIS Global Disturbance Index across North America
Mildrexler, D. J., M. Zhao and S. W. Running
Remote Sensing of Environment. 113: 2103-2117. 2009
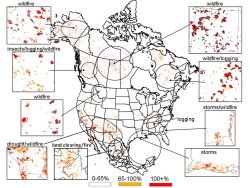
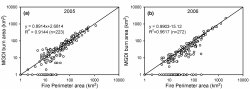
Large-scale ecosystem disturbances (LSEDs) have major impacts on the global carbon cycle as large pulses of CO2 and other trace gases from terrestrial biomass loss are emitted to the atmosphere during disturbance events. The high temporal and spatial variability of the atmospheric emissions combined with the lack of a proven methodology to monitor LSEDs at the global scale make the timing, location and extent of vegetation disturbance a significant uncertainty in understanding the global carbon cycle. The MODIS Global Disturbance Index (MGDI) algorithm is designed for large-scale, regular, disturbance mapping using Aqua/Moderate Resolution Imaging Spectroradiometer (MODIS) Land Surface Temperature (LST) and Aqua/MODIS Enhanced Vegetation Index (EVI) data. The MGDI uses annual maximum composite LST data to detect fundamental changes in land-surface energy partitioning, while avoiding the high natural variability associated with tracking LST at daily, weekly, or seasonal time frames. Here we apply the full Aqua/MODIS dataset through 2006 to the improved MGDI algorithm across the woody ecosystems of North America and test the algorithm by comparison with confirmed, historical wildfire events and the windfall areas of documented major hurricanes. The MGDI accurately detects the location and extent of wildfire throughout North America and detects high and moderate severity impacts in the windfall area of major hurricanes. We also find detections associated with clear-cut logging and land-clearing on the forest–agricultural interface. The MGDI indicates that 1.5% (195,580 km2) of the woody ecosystems within North America was disturbed in 2005 and 0.5% (67,451 km2) was disturbed in 2006. The interannual variability is supported by wildfire detections and official burned area statistics.
Ecosystem Disturbance, Carbon, and Climate
Running, S. W.
Science. 321: 652-653. 2008
Models of climate change effects should incorporate land-use changes and episodic disturbances such as fires and insect epidemics.
A New Satellite Based Methodology for Continental Scale Disturbance Detection
Mildrexler, D. J., M. Zhao, F. A. Heinsch and S. W. Running
Ecological Applications, 17: 235-250. 2007
The timing, location, and magnitude of major disturbance events are currently major uncertainties in the global carbon cycle. Accurate information on the location, spatial extent, and duration of disturbance at the continental scale is needed to evaluate the ecosystem impacts of land cover changes due to wildfire, insect epidemics, flooding, climate change, and human-triggered land use. This paper describes an algorithm developed to serve as an automated, economical, systematic disturbance detection index for global application using Moderate Resolution Imaging Spectroradiometer (MODIS)/Aqua Land Surface Temperature (LST) and Terra/MODIS Enhanced Vegetation Index (EVI) data from 2003 to 2004. The algorithm is based on the consistent radiometric relationship between LST and EVI computed on a pixel-by-pixel basis. We used annual maximum composite LST data to detect fundamental changes in land–surface energy partitioning, while avoiding the high natural variability associated with tracking LST at daily, weekly, or seasonal time frames. Verification of potential disturbance events from our algorithm was carried out by demonstration of close association with independently confirmed, well-documented historical wildfire events throughout the study domain. We also examined the response of the disturbance index to irrigation by comparing a heavily irrigated poplar tree farm to the adjacent semiarid vegetation. Anomalous disturbance results were further examined by association with precipitation variability across areas of the study domain known for large interannual vegetation variability. The results illustrate that our algorithm is capable of detecting the location and spatial extent of wildfire with precision, is sensitive to the incremental process of recovery of disturbed landscapes, and shows strong sensitivity to irrigation. Disturbance detection in areas with high interannual variability of precipitation will benefit from a multiyear data set to better separate natural variability from true disturbance.
NTSG Personnel
- Maosheng Zhao
- Steve Running
- David Mildrexler